. 2016 Nov 1:5:e19274.
doi: 10.7554/eLife.19274.

Biomolecular interactions modulate macromolecular structure and dynamics in atomistic model of a bacterial cytoplasm

Affiliations

Biomolecular interactions modulate macromolecular structure and dynamics in atomistic model of a bacterial cytoplasm

Isseki Yu et al. Elife. .

Abstract

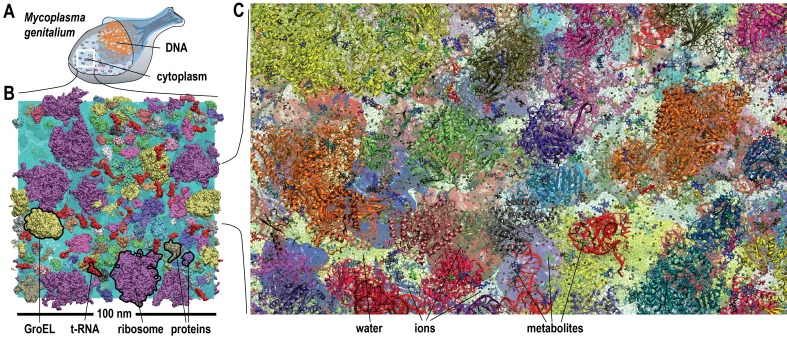
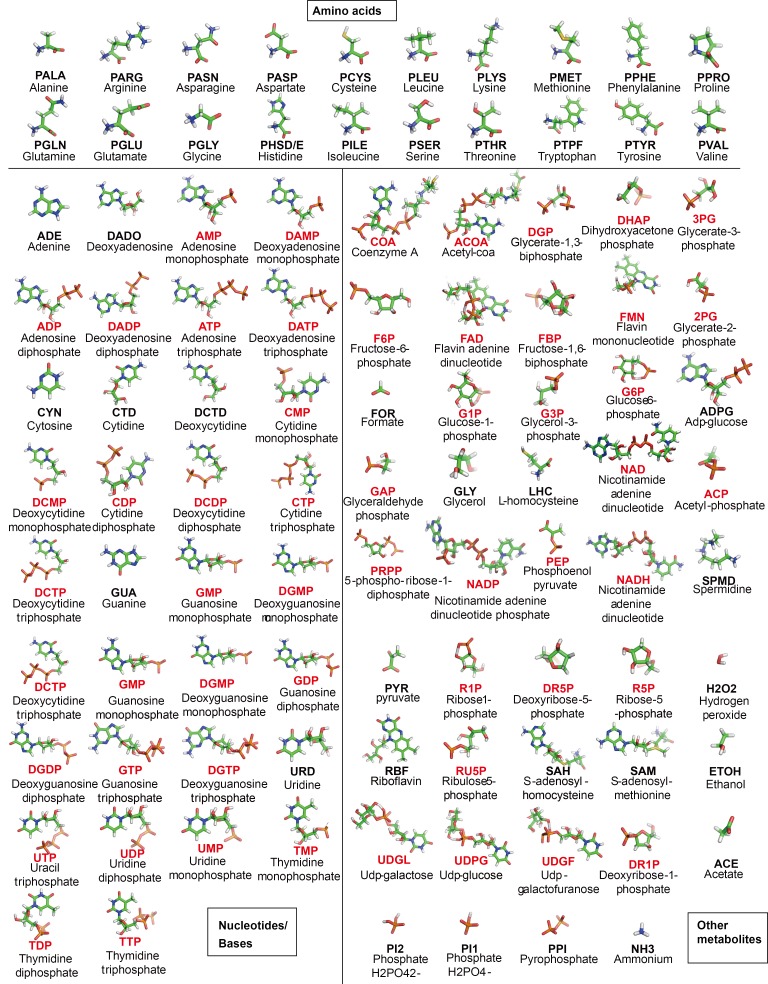
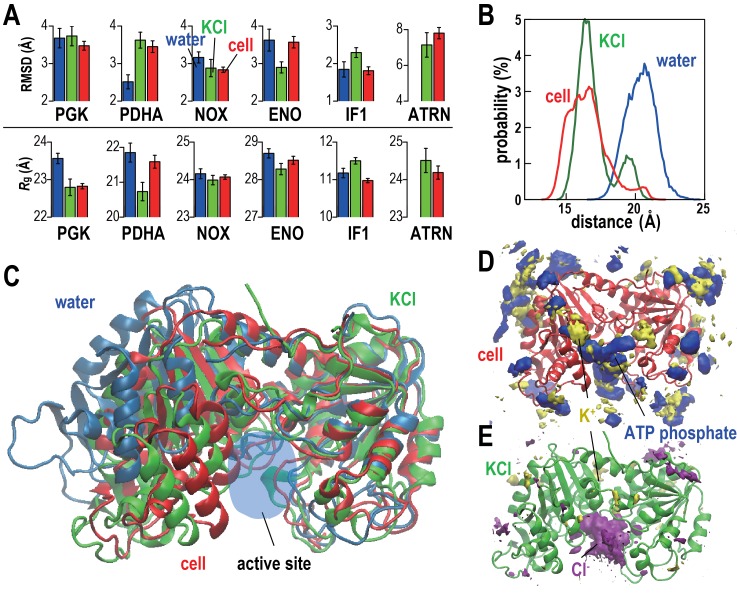
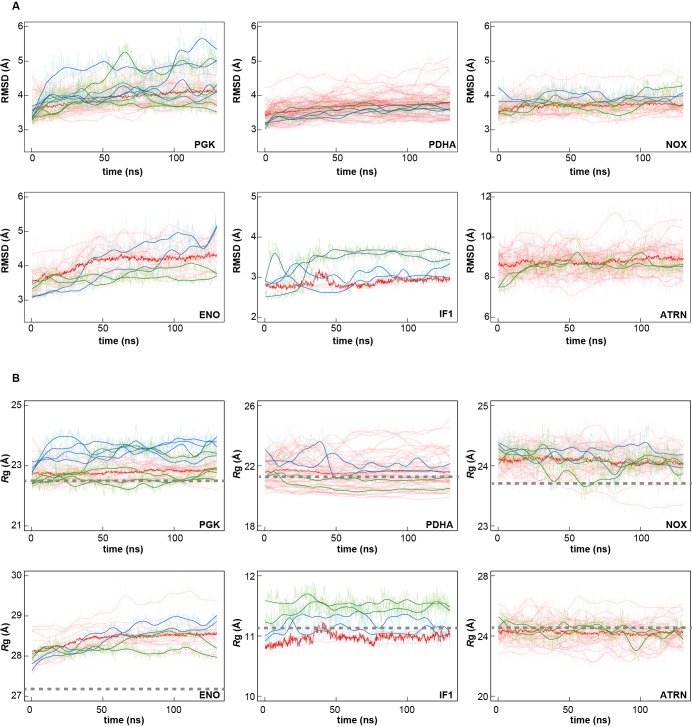
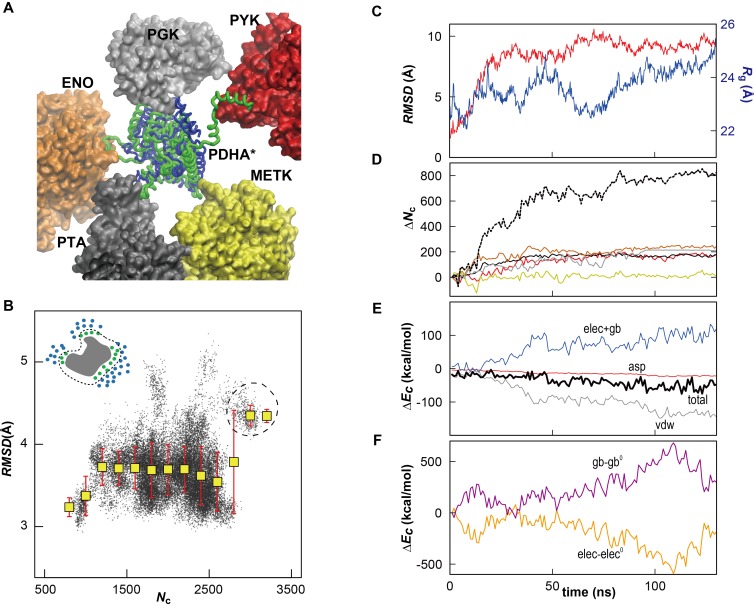
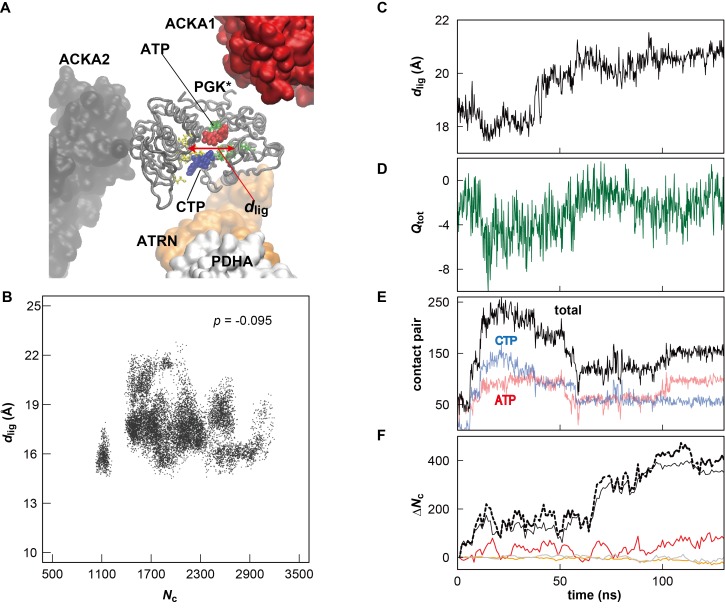
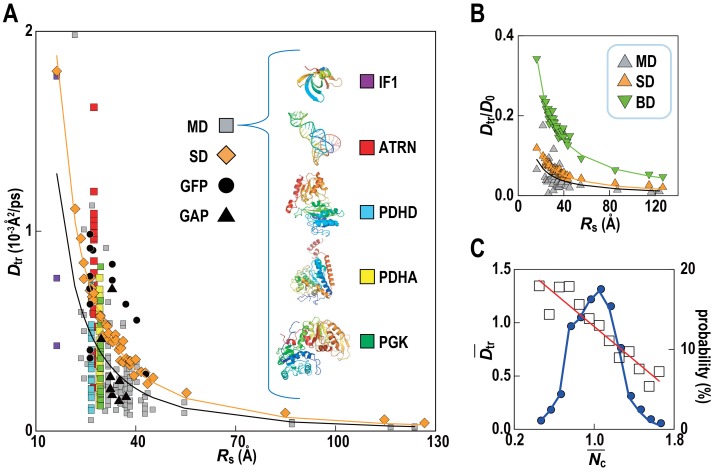
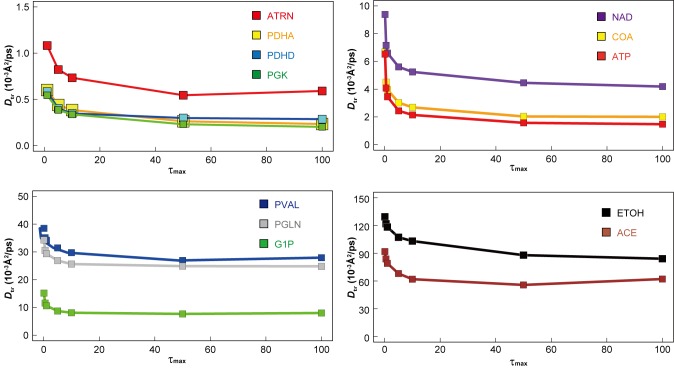
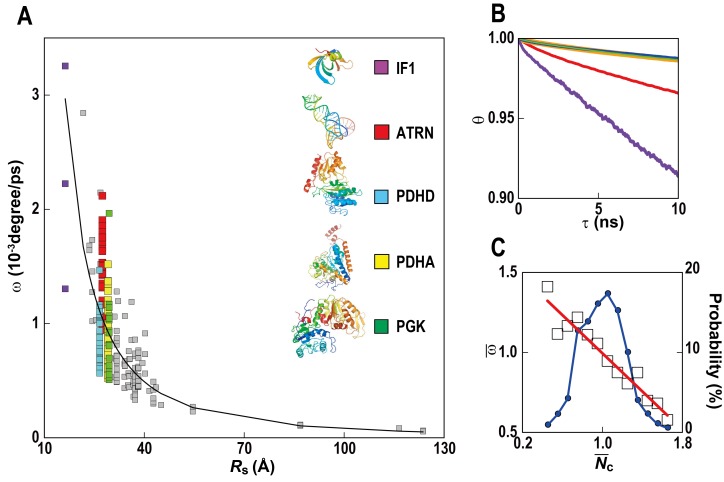
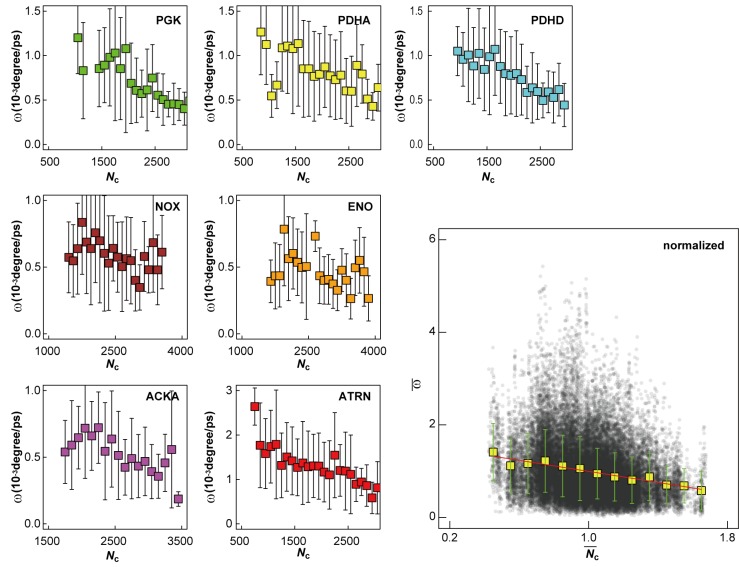
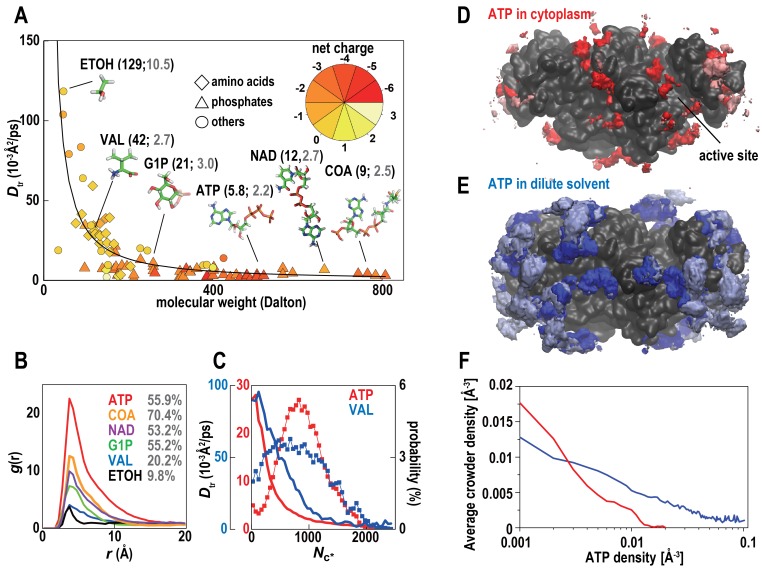
Biological macromolecules function in highly crowded cellular environments. The structure and dynamics of proteins and nucleic acids are well characterized in vitro, but in vivo crowding effects remain unclear. Using molecular dynamics simulations of a comprehensive atomistic model cytoplasm we found that protein-protein interactions may destabilize native protein structures, whereas metabolite interactions may induce more compact states due to electrostatic screening. Protein-protein interactions also resulted in significant variations in reduced macromolecular diffusion under crowded conditions, while metabolites exhibited significant two-dimensional surface diffusion and altered protein-ligand binding that may reduce the effective concentration of metabolites and ligands in vivo. Metabolic enzymes showed weak non-specific association in cellular environments attributed to solvation and entropic effects. These effects are expected to have broad implications for the in vivo functioning of biomolecules. This work is a first step towards physically realistic in silico whole-cell models that connect molecular with cellular biology.

Keywords: biophysics; computational biology; crowding effects; diffusion; metabolite dynamics; native state stability; none; quinary interactions; structural biology; systems biology; whole-cell modeling.


Conflict of interest statement

The authors declare that no competing interests exist.

Figures

Figure 1.
Figure 1.. Molecular model of a bacterial cytoplasm.
(A) Schematic illustration of Mycoplasma genitalium (MG). (B) Equilibrated MGh system highlighted with proteins, tRNA, GroEL, and ribosomes. (C) MGh cl ose-up showing atomistic level of detail. See also supplementary Figures 1 and 2 for structures of individual macromolecules and metabolites as well as supplementary Figure 3 for initial configurations of the simulated systems. DOI: http://dx.doi.org/10.7554/eLife.19274.003
Figure 1—figure supplement 1.
Figure 1—figure supplement 1.. Macromolecular components.
Structures of macromolecular complexes colored by residues index with tag, Stokes radius, and name. DOI: http://dx.doi.org/10.7554/eLife.19274.004
Figure 1—figure supplement 2.
Figure 1—figure supplement 2.. Structure of metabolites in MGh.
For each metabolite, the abbreviation used in the text and its full name are given. Phosphates are highlighted in red. DOI: http://dx.doi.org/10.7554/eLife.19274.005
Figure 1—figure supplement 3.
Figure 1—figure supplement 3.. Initial configurations of simulated systems.
Initial simulation boxes with colors indicating different macromolecular types. DOI: http://dx.doi.org/10.7554/eLife.19274.006
Figure 2.
Figure 2.. Conformational stability of macromolecules in crowded and dilute environments.
(A) Time-averaged RMSDs (from starting structures) and radii of gyration (Rg) for selected macromolecules in MGm1(red), in dilute solution with only counterions (blue) and with KCl excess salt (green). Statistical errors are with respect to copies of the same type. (B) Probability of the center of mass distances between the ligand binding sites dlig for PGK in MGm1 (red), in water (blue), and in KCl (green). (C): Final snapshots of PGK in MGm1 (red), in water (blue), and in KCl (green). (D) Time- and ensemble-averaged 3D distribution of atoms in the ATP phosphate group (blue, 0.002 Å−3) and K+ (yellow, 0.001 Å−3) around PGK in MGm1. (E) Time- and ensemble-averaged 3D distribution of K+ (yellow, 0.001 Å−3) and Cl- (purple, 0.001 Å−3) around PGK in KCl aqueous solution. See also supplementary Figures 1, 2 and 3 showing time series of structural stability measures and the influence of the local crowding environment on the structure of PGK and PDHA. DOI: http://dx.doi.org/10.7554/eLife.19274.009
Figure 2—figure supplement 1.
Figure 2—figure supplement 1.. Time series of structural stability measures for selected macromolecules.
Root mean square deviations (RMSD) relative to initial structures based on Cα or P atoms of core structures as explained in Analysis Details (A); and radii of gyration based on all Cα or P atoms (Rg; B) for PGK, PDHA, NOX, ENO, IF1, and ATRN (for abbreviations see Figure 1—figure supplement 1) in MGm1 (red), in water with only counterions (blue), and in KCl solution (green) are shown. Window-averaged time series are shown as solid lines. Rg values of initial models are indicated as dashed grey lines. DOI: http://dx.doi.org/10.7554/eLife.19274.010
Figure 2—figure supplement 2.
Figure 2—figure supplement 2.. Influence of local crowding environment on the structure of PDHA in MGm1.
(A) Denatured (green) conformation of one of the 39 copies of PDHA (denoted as PDHA*) due to contacts with other cytoplasmic proteins (PYK (red), PGK (gray), ENO (orange), PTA (black), and METK (yellow)). The initial, native, homology model is shown in blue. (B) Correlation between coordination number of crowder Cα atoms Nc (see Materials and methods) and RMSD (based on Cα atoms relative to the initial model) for PDHA. The schematic figure in upper left shows the target protein (gray) surrounded by cytoplasmic proteins (blue). The atoms counted in Nc (green) are shown in green. Histogram averages are shown as yellow boxes with standard deviations indicated as red bars. The dashed circle corresponds to the denatured state shown in panel A. Instantaneous values of Nc, dlig and RMSD were calculated using an interval of 200 ps using 39 copies of PDHA, respectively, in the MGm1 system. (C) Time history of RMSD (based on Cα atoms relative to the structure after the equilibration) (red) and radius of gyration (Rg) (blue) of PDHA*. (D) Time history of the contact pair between all atoms in the PDHA* and all atoms in five vicinal proteins (line color corresponds to those proteins in panel A) with the total value of them (dashed black). The schematic figure in the upper left shows the contact pairs (dashed line) between the atoms in two proteins (green and blue). The cutoff distance of the contact pair was set to 10 Å. (E) Time histories of the energy changes of PDHA* upon crowding (ΔEc) (i.e. the energy of all proteins (PDHA* with 5 vicinal proteins) subtracted by those energies of isolated PDHA* and the five vicinal proteins). Each energy component of ΔEc is shown with different colors (van der Waals energy (vdw; gray), cost of cavity formation calculated as 0.005 cal/mol/Å2 * SASA (asp; red), combination of the vacuum electrostatic and electrostatic solvation energies (elec+gb; blue), and the total energy (tot; thick black line). (F) Time history of the electrostatic Coulomb energy (elec; orange) and electrostatic solvation energy obtained via the GBMV generalized Born method in CHARMM (Lee et al., 2003) (gb; violet) where energies of PDHA* upon crowding relative to the initial values were elec0 = −1399 and gb= 1406 kcal/mol, respectively. DOI: http://dx.doi.org/10.7554/eLife.19274.011
Figure 2—figure supplement 3.
Figure 2—figure supplement 3.. Influence of metabolite binding and local crowding environment on the structure of PGK in MGm1.
(A) Atoms in two ligand binding sites (yellow and green licorice) of one of the 18 copies of PGK (denoted as PGK*) (gray tube) in the MGm1 system. The distance between the center of mass for Cα atoms in each site is denoted as dlig (red arrow). Two major metabolites binding the active site of PGK* are shown in red (ATP) and blue (CTP), respectively. Proteins near the PGK* (two ACKAs (red and black), ATRN (orange) and PDHA (white)) are shown in surface. (B) Correlation between Nc and dlig for all copies of PGK in MGm1 system. The correlation coefficient p between Nc and dlig is indicated. (C) Time history of dlig for PGK*. (D) Time history of the total atomic charge (Qtot) of the metabolites and ions binding the active site of PGK*. Atomic charge was counted when the minimum distance from the metabolite (or ion) atom to any Cα atoms in the active site of PGK* is smaller than 8 Å. (E) Time history of the contact pairs between all atoms in the active site of PGK* and atoms in the phosphate group of nucleotides entering the binding the site. The cutoff distance for defining a contact was set to 5 Å. (F) Time history of the contact pairs between all atoms in the PGK* and all atoms in three vicinal proteins (the line color corresponds to those proteins in panel A) with the total number of contacts shown as a dashed black line. The cutoff distance for defining a contact was set to 10 Å. DOI: http://dx.doi.org/10.7554/eLife.19274.012
Figure 3.
Figure 3.. Association of metabolic proteins in crowded environments.
(A) Intermolecular distance changes between initial and final time (ΔdAB) for pairs of glycolytic enzymes, other regular proteins, RNAs, and ribosomes/GroEL (huge). (B) Solvation free energies ΔGsol normalized by the solvent-accessible surface area (SASA) for equilibrated copies of macromolecules in MGm1 using GBMV (Lee et al., 2003) in CHARMM (Brooks et al., 2009). See also supplementary Figure 1 showing the influence of large macromolecules on the association of small proteins based on simple Lennard-Jones mixtures. DOI: http://dx.doi.org/10.7554/eLife.19274.015
Figure 3—figure supplement 1.
Figure 3—figure supplement 1.. Influence of large macromolecules on the association of small proteins.
(AD) Two-component mixtures of small Lennard-Jones particles ‘A’ (2 Å, white) in the presence of same size particles ‘B’ (LJ_AB) or in the presence of larger particles ‘C’ (3.509 Å, LJ_AC) or ‘D’ (5.570 Å, LJ_AD) occupying the same volume (3400 Å3) in a (18.666 Å)3 cubic box. In an additional simulation, LJ_AD_rep, the ‘D’ particle had a unit charge to create repulsion. (E) Pairwise density distribution function ρ(r) for ‘A’ particles in LJ_AB (blue), in LJ_AC (green), LJ_AD (red) and LJ_AD_rep (dashed red). (F) Cumulative numbers of particles within spherical shells around ‘A’ particles show an extra particle in LJ_AD and LJ_AD_rep beyond r = 4 Å but with the difference disappearing in LJ_AD_rep at 6 Å. DOI: http://dx.doi.org/10.7554/eLife.19274.016
Figure 4.
Figure 4.. Translational diffusion of macromolecules in MGm1 slows down as a function of Stokes radius and is dependent on local crowding.
(A) Translational diffusion coefficients (Dtr) of macromolecules in MGm1 vs. Stokes radii (Rs) from MD, and SD compared with experimental data for green fluorescent protein (GFP) and GFP-attached proteins in E. coli (Nenninger et al., 2010). Fitted functions are Dtr = 341/Rs2 (MD) and Dtr = 496/Rs2 (SD). (B) Dtr/D0 using D0 from HYDROPRO (Fernandes and de la Torre, 2002) for MGm1 (grey), SD (orange), and BD (green). Fitted functions for Dtr/D0 are 1.5/Rs (MD), 2.0/Rs (SD), and 5.6/Rs (BD). (C) Normalized translational diffusion coefficient (Dtr¯) vs. normalized coordination number (Nc¯) for selected macromolecules (white squares) and distribution of macromolecules vs. Nc¯ (blue line). See also supplementary Figures 1 and 2 showing the dependency of the calculated diffusion coefficients on the observation time and the influence of the local crowding environment on the diffusion coefficients of individual proteins. DOI: http://dx.doi.org/10.7554/eLife.19274.017
Figure 4—figure supplement 1.
Figure 4—figure supplement 1.. Dependency of translational diffusion coefficient Dtr on the maximum observation time τmax.
Dtr for macromolecules ATRN, PDHA, PDHD and PGK (see Figure 1—figure supplement 1 for abbreviations) and metabolites NAD, COA, ATP, VAL, GLN, G1P, ETOH, and ACE (see Figure 1—figure supplement 2 for abbreviations) as a function of τmax (see Materials and methods) in MGm1. DOI: http://dx.doi.org/10.7554/eLife.19274.018
Figure 4—figure supplement 2.
Figure 4—figure supplement 2.. Influence of local crowding environment on Dtr.
Dtr for macromolecules PGK, PDHA, PDHD, NOX, ENO, ACKA, and ATRN in MGm1 as a function of coordination number of crowder Cα atoms Nc. For each type of macromolecule, Dtr and Nc at given time windows were normalized by their average values over multiple copies and the entire trajectory. Normalized diffusion coefficients Dtr¯ as a function of normalized coordination numbers Nc¯ for all seven macromolecules at different 10 ns time windows from MGm1are combined in the larger figure. Yellow square markers with standard deviations show histogram-averaged values of Dtr¯ in 0.1 intervals of Nc¯. A linear function Dtr¯=mNc¯+n was fitted to the data (shown in red). DOI: http://dx.doi.org/10.7554/eLife.19274.019
Figure 5.
Figure 5.. Rotational diffusion of macromolecules.
(A) Averaged angular velocity (ω) of macromolecules in MGm1 as a function of their Stokes radii (Rs) (gray squares with IF1, ATRN, PDHD, PDHA, and PGK highlighted in purple, red, blue, yellow, and green, respectively) (B) Rotational correlation functions (θ) of macromolecules (IF1, ATRN, PDHD, PDHA, and PGK colored in purple, red, blue, yellow, and green, respectively). (C) Normalized angular velocities (ω¯) vs. normalized coordination numbers (Nc¯) (white square) averaged over abundant macromolecules vs. macromolecular distribution as in Figure 4. See also supplementary Figure 1 showing the influence of the local crowding environment on the rotational diffusion of individual macromolecules. DOI: http://dx.doi.org/10.7554/eLife.19274.021
Figure 5—figure supplement 1.
Figure 5—figure supplement 1.. Influence of local crowding environment on angular velocity ω.
Averaged angular velocities ω for macromolecules PGK, PDHA, PDHD, NOX, ENO, ACKA, and ATRN in MGm1 as a function of coordinate number of crowder Cα atoms Nc. Normalized angular velocities ω¯ as a function of normalized coordination numbers Nc¯ are shown as in (A). For each type of macromolecule, w and Nc at given time windows were normalized by their average values over multiple copies and the entire trajectory. Normalized diffusion coefficients ω¯ as a function of normalized coordination numbers Nc¯ for all seven macromolecules at different 10 ns time windows from MGm1are combined in the larger figure. Yellow square markers with standard deviations show histogram-averaged values of ω¯ in 0.1 intervals of Nc¯. A linear function was fitted to the data (shown in red). DOI: http://dx.doi.org/10.7554/eLife.19274.022
Figure 6.
Figure 6.. Metabolites in cytoplasmic environments interact extensively with macromolecules resulting in significantly reduced diffusion.
(A) Translational diffusion coefficients (Dtr) for metabolites in MGm1 as a function of molecular weight (phosphates: diamond; amino acids: triangles; others: circles; color reflects charge). For abundant metabolites, diffusion coefficients in bulk (black) and during macromolecular interaction (grey) are given in parentheses. (B) Normalized conditional distribution function, g(r), for heavy atoms of selected metabolites vs. the distance to the closest macromolecule heavy atom. The percentage of metabolites interacting with a macromolecule is listed. (C) Dtr of ATP and VAL as a function of the coordination number with macromolecules (Nc*) (line) and the distribution of Nc* (%) (line with points). (D) Time-averaged 3D distribution of all atoms in ATP (red, 0.008 Å−3) around ACKA molecules in MGm1. Pink color indicates regions where all-atom crowder densities also exceed 0.008 Å−3. (E) Same as in (D) but the density of ATP is shown in dilute solvent (blue) with light blue indicating overlap with the crowder density distribution form the MGm1 simulations. (F) Correlation between average crowder atom densities in MGm1 and volume density grid voxel ATP densities in dilute (blue) and crowded (red) environments. In the dilute case, we compute the crowder atom densities in MGm1 as a function of the grid ATP densities in the dilute simulations of PDHA. Therefore, high average crowder atom densities in the cytoplasmic model at sites with high ATP densities under dilute conditions means that those ATP sites would be displaced by interacting crowders in the cytoplasmic environment. See also supplementary Figure 1 showing analysis details for the calculation of the ATP distributions. DOI: http://dx.doi.org/10.7554/eLife.19274.024
Figure 6—figure supplement 1.
Figure 6—figure supplement 1.. ATP distribution in cytoplasmic environments.
(A) Schematic representation of theoretically accessible volume, V(r), in crowded environments. The large square box represents the size of the periodic system. The yellow objects represent macromolecules with replicas in an adjacent image outlined with dashed lines. The gray layers surrounding macromolecules represent V(r) with the thickness Δr at a distance r from the closest atom of any macromolecule. Thick black squares indicate the grid elements with centers included when accumulating V(r). (B) V(r) (red layers) at a distance r from the closest atom of any proteins belonging to a given macromolecule type (e.g., ACKA). With larger r, V(r) is interrupted by other macromolecules. In this case, the part of the V(r) overlapping with the van der Waals surface of macromolecules is eliminated. (C) V(r) at distance r from the closest atom of single protein under dilute conditions. (D) Profiles of the heavy atom number density of ATPs (ρ(r)) as a function of the closest distance from any heavy atom of ACKAs in the MGm1 system (red) and from any heavy atom in single ACKA in dilute solvent with metabolites (blue). The black line indicates the profile of ρ(r) as function of the closest distance from any heavy atom of the macromolecules in the MGm1 system. (E) Profiles of the theoretically accessible volume V(r) as a function of the closest distance from any heavy atoms in ACKAs in MGm1 (red) and from any heavy atom in ACKA_m (blue). The gray line shows the profile of V(r) as a function of the closest distance from any macromolecule heavy atom in the MGm1 system. The profile around ACKAs in MGm1 (red lines in D and C) was obtained by dividing the total volume of V(r) by the number of ACKA copies in the MGm1 system. DOI: http://dx.doi.org/10.7554/eLife.19274.025

References

    1. Ando T, Skolnick J. Crowding and hydrodynamic interactions likely dominate in vivo macromolecular motion. PNAS. 2010;107:18457–18462. doi: 10.1073/pnas.1011354107. - DOI - PMC - PubMed
    1. Asakura S, Oosawa F. Interaction between particles suspended in solutions of macromolecules. Journal of Polymer Science. 1958;33:183–192. doi: 10.1002/pol.1958.1203312618. - DOI
    1. Banchio AJ, Brady JF. Accelerated stokesian dynamics: Brownian motion. The Journal of Chemical Physics. 2003;118:10323–10332. doi: 10.1063/1.1571819. - DOI
    1. Banks DS, Fradin C. Anomalous diffusion of proteins due to molecular crowding. Biophysical Journal. 2005;89:2960–2971. doi: 10.1529/biophysj.104.051078. - DOI - PMC - PubMed
    1. Bennett BD, Kimball EH, Gao M, Osterhout R, Van Dien SJ, Rabinowitz JD. Absolute metabolite concentrations and implied enzyme active site occupancy in Escherichia coli. Nature Chemical Biology. 2009;5:593–599. doi: 10.1038/nchembio.186. - DOI - PMC - PubMed

Publication types

MeSH terms

Substances