

Comparison of Frailty Measures as Predictors of Outcomes After Orthopedic Surgery
- PMID: 27801939
- PMCID: PMC5173406
- DOI: 10.1111/jgs.14387
Comparison of Frailty Measures as Predictors of Outcomes After Orthopedic Surgery
Erratum in
-
Erratum.J Am Geriatr Soc. 2017 Feb;65(2):453. doi: 10.1111/jgs.14853. J Am Geriatr Soc. 2017. PMID: 28198562 No abstract available.
Abstract
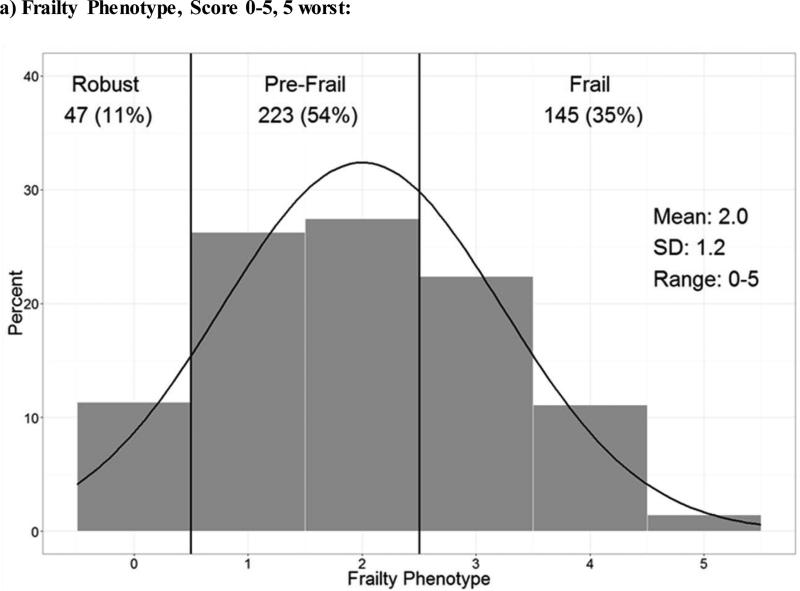
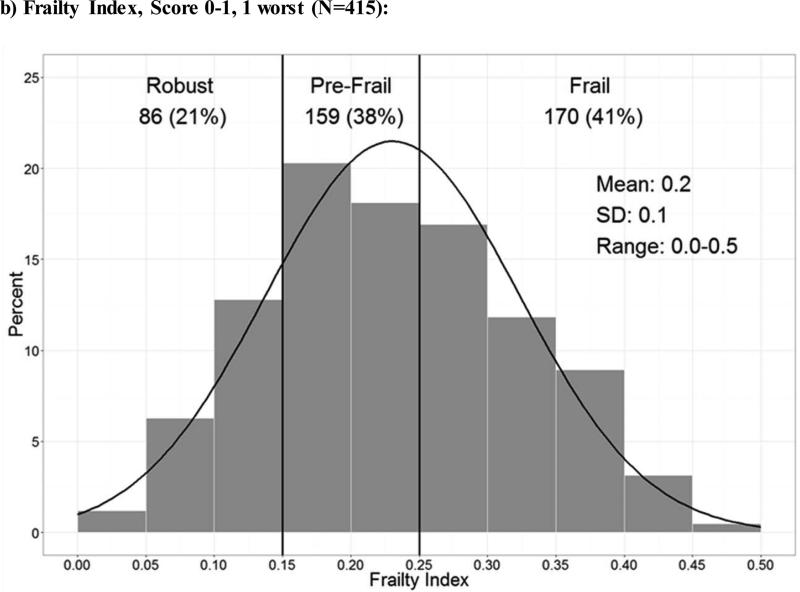
Objectives: To apply the Frailty Phenotype (FP) and Frailty Index (FI) before major elective orthopedic surgery to categorize frailty status and assess associations with postoperative outcomes.
Design: Prospective cohort study.
Setting: Two tertiary hospitals in Boston, Massachusetts.
Participants: Individuals aged 70 and older undergoing scheduled orthopedic surgery enrolled in the Successful Aging after Elective Surgery (SAGES) Study (N = 415).
Measurements: Preoperative evaluation included assessment of frailty using the FP and FI. The weighted kappa statistic was used to determine concordance between the two frailty measures and multivariable modeling to determine associations between each measure and postoperative complications, postoperative length of stay (LOS) of longer than 5 days, discharge to postacute institutional care (PAC), and 300 day readmission.
Results: Frailty was highly prevalent (FP, 35%; FI, 41%). There was moderate concordance between the FP and FI (κ = 0.42, 95% confidence interval (CI) 0.36-0.49). When using the FP, being prefrail predicted greater risk of complications (relative risk (RR) = 1.6, 95% CI = 1.1-2.1) and discharge to PAC (RR = 1.8, 95% CI = 1.2-2.9) than being robust, and being frail predicted more complications (RR = 1.7, 95% CI = 1.1-2.1), LOS longer than 5 days (RR = 3.1, 95% CI = 1.1-8.8), and discharge to PAC (RR = 2.3 95% CI = 1.4-3.7). When using FI, being prefrail predicted LOS longer than 5 days (RR = 2.1, 95% CI = 1.0-4.8) and discharge to PAC (RR = 1.5, 95% CI = 1.4-2.1), as did being frail (RR = 1.9, 95% CI = 1.4-2.5; RR = 3.1, 95% CI = 1.4-6.8, respectively). The other outcomes were not significantly associated with frailty status.
Conclusion: FP and FI predict postoperative outcomes after major elective orthopedic surgery and should be considered for preoperative risk stratification.
Keywords: elderly; frailty measures; orthopedic procedures; preoperative evaluation; surgery outcomes.
© 2016, Copyright the Authors Journal compilation © 2016, The American Geriatrics Society.
Figures
References
-
- Centers for Medicare and Medicaid Services (CMS) [June 1, 2013];Healthcare Expenditures. Centers for Medicare and Medicaid Services (online) Available at: http://www.cms.gov/Research-Statistics-Data-and-Systems/Statistics-Trend....
-
- Centers for Disease Prevention and Control (CDC) Fast Stats: Inpatient Surgery. Centers for Disease Control and Prevention; [June 1, 2013]. (online). Available at: http://www.cdc.gov/nchs/fastats/insurg.htm.
-
- U.S. Department of Health & Human Services - Administration of Aging [November 28, 2013];Aging Statistics. (online) Available at: http://www.aoa.gov/AoARoot/(S(2ch3qw55k1qylo45dbihar2u))/Aging_Statistic....
-
- Department of Health and Human Services of the Centers for Medicare & Medicaid Services CFR Parts 412, 482, 485, and 489, RIN 0938-AR53. 2013
Publication types
MeSH terms
Grants and funding
LinkOut - more resources
Full Text Sources
Other Literature Sources
