. 2016 Oct 15;143(20):3674-3685.
doi: 10.1242/dev.139360.

Transient ectopic expression of the histone demethylase JMJD3 accelerates the differentiation of human pluripotent stem cells

Affiliations

Transient ectopic expression of the histone demethylase JMJD3 accelerates the differentiation of human pluripotent stem cells

Tomohiko Akiyama et al. Development. .

Abstract

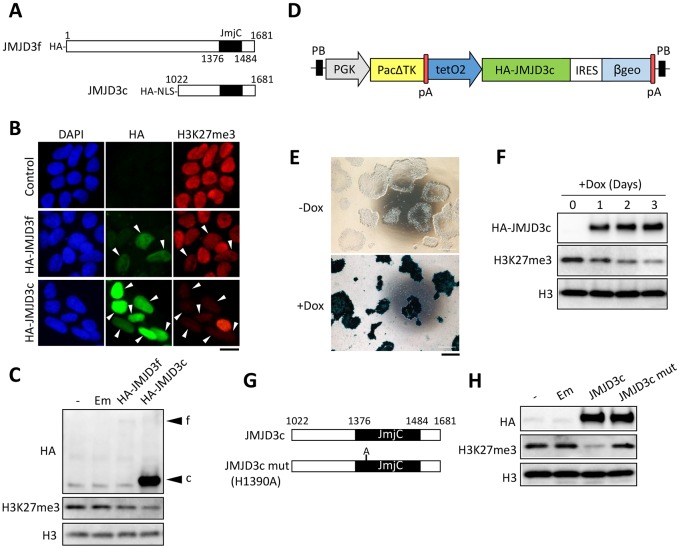
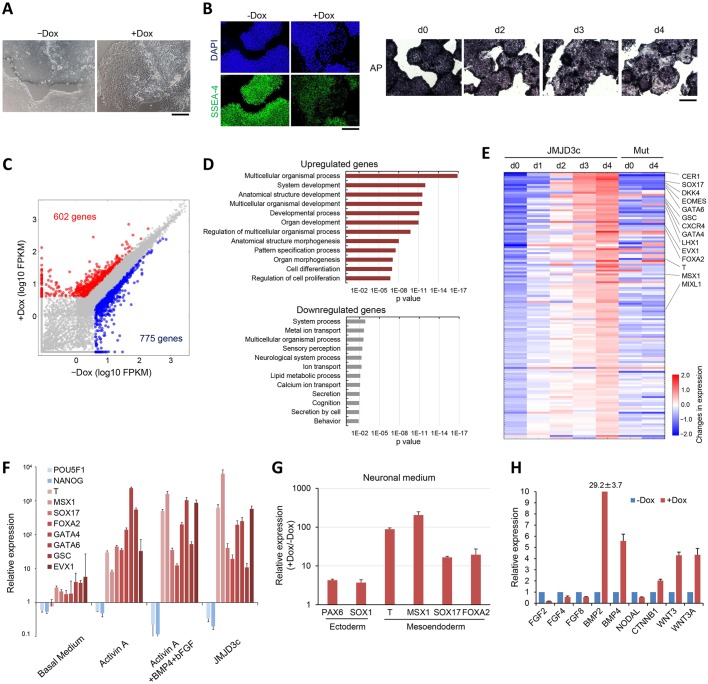
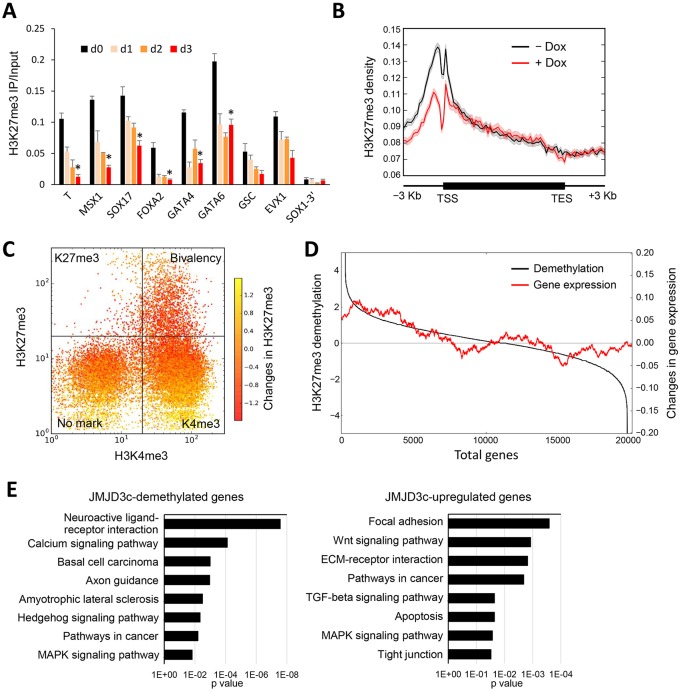
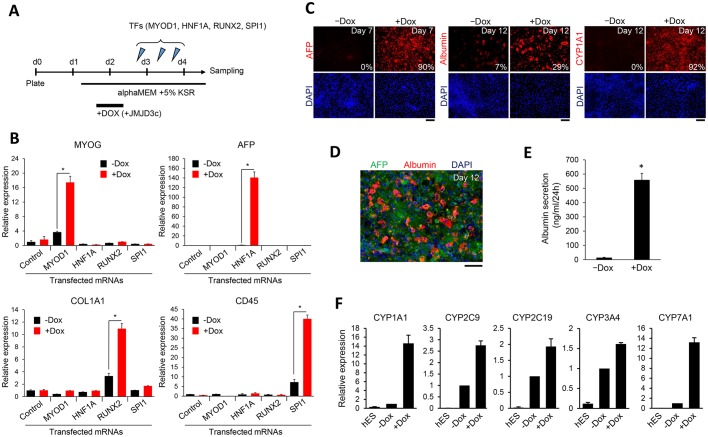
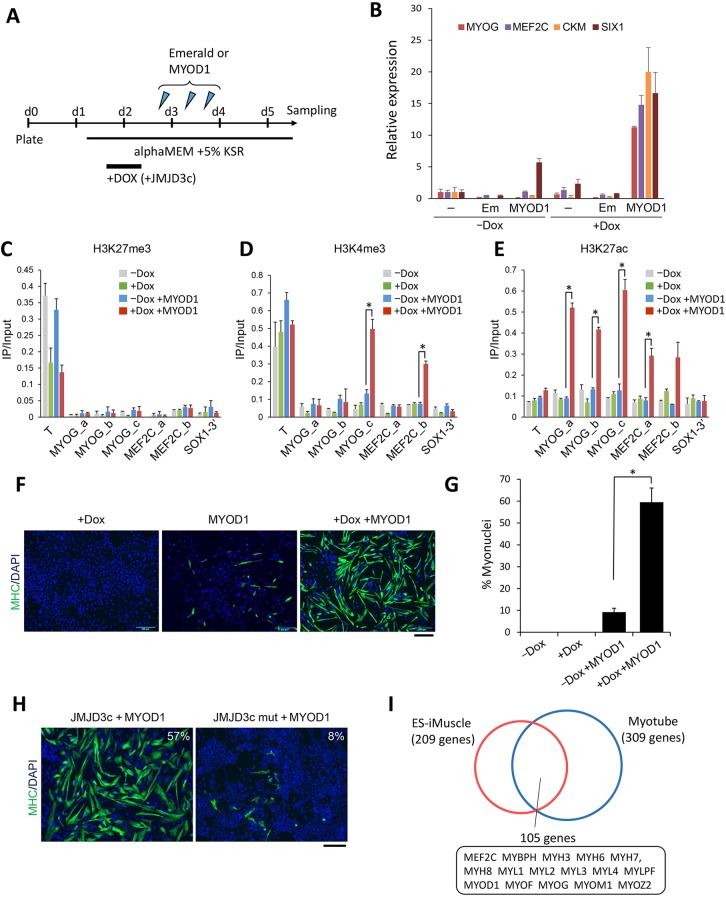
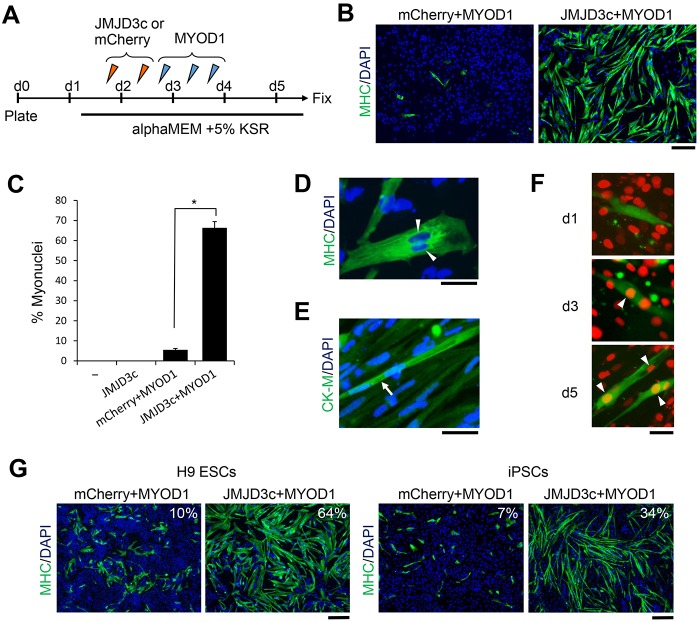
Harnessing epigenetic regulation is crucial for the efficient and proper differentiation of pluripotent stem cells (PSCs) into desired cell types. Histone H3 lysine 27 trimethylation (H3K27me3) functions as a barrier against cell differentiation through the suppression of developmental gene expression in PSCs. Here, we have generated human PSC (hPSC) lines in which genome-wide reduction of H3K27me3 can be induced by ectopic expression of the catalytic domain of the histone demethylase JMJD3 (called JMJD3c). We found that transient, forced demethylation of H3K27me3 alone triggers the upregulation of mesoendodermal genes, even when the culture conditions for the hPSCs are not changed. Furthermore, transient and forced expression of JMJD3c followed by the forced expression of lineage-defining transcription factors enabled the hPSCs to activate tissue-specific genes directly. We have also shown that the introduction of JMJD3c facilitates the differentiation of hPSCs into functional hepatic cells and skeletal muscle cells. These results suggest the utility of the direct manipulation of epigenomes for generating desired cell types from hPSCs for cell transplantation therapy and platforms for drug screenings.

Keywords: Hepatocytes; Histone demethylase; Human pluripotent stem cells; JMJD3; KDM6B; Skeletal muscle.


Conflict of interest statement

The authors declare no competing or financial interests.

Figures

Fig. 1.
Fig. 1.
Generation of H3K27me3-deficient hESCs by ectopic JMJD3c expression. (A) Structures of the JMJD3f and JMJD3c proteins. JMJD3c was designed to contain the JmjC domain (amino acids 1376-1484). HA was added to JMJD3f and JMJD3c and an NLS was added to the N terminus of JMJD3c. (B) hESCs were transfected with the synthetic mRNAs for HA-JMJD3f or HA-JMJD3c and were stained with HA and H3K27me3 antibodies. Non-transfected hESCs were used as a control. The arrowheads indicate the transfected cells. The mean fluorescent intensities of H3K27me3 in the transfected cells were 0.65 for HA-JMJD3f and 0.26 for HA-JMJD3c compared with the non-transfected cells. More than 20 nuclei from three independent experiments were examined. Scale bar: 20 μm. (C) The effects of transfection of the HA-JMJD3c and HA-JMJD3f mRNAs on the H3K27me3 levels were analyzed by immunoblotting. Emerald mRNA (Em) was transfected as a control. The H3 antibody was used as a loading control. The average signal intensities of H3K27me3 from two independent biological replicates were 0.92 for Em, 0.65 for HA-JMJD3f, and 0.36 for HA-JMJD3c compared with the non-transfected cells. (D) Construct used for Tet-On induction of JMJD3c expression in hESCs (JMJD3c-hESCs). pA, polyA signal; PB, piggyBac repeat. (E) JMJD3c-hESCs were stained with X-Gal 3 days after Dox treatment. Scale bar: 500 μm. (F) HA-JMJD3c-induced H3K27me3 demethylation was detected 1 to 3 days after Dox treatment. The average signal intensities of H3K27me3 from two independent biological replicates were 0.70 on Day 1, 0.52 on Day 2, and 0.24 on Day 3 compared with Day 0. (G) A point mutation in JMJD3c (mut) was inserted at aa 1390 for catalytic inactivation. (H) Effects of HA-JMJD3c and the HA-JMJD3c mut on the H3K27me3 levels. The average signal intensities of H3K27me3 from two independent biological replicates were 0.97 for Em, 0.23 for JMJD3c, and 1.0 for the JMJD3c mut compared with the non-transfected cells.
Fig. 2.
Fig. 2.
Developmental genes are upregulated in the JMJD3c-hESCs. (A) Morphologies of untreated (–Dox) and Dox-treated (+Dox) JMJD3c-hESCs. Scale bar: 100 μm. (B) SSEA-4 staining and alkaline phosphatase (AP) activity in the JMJD3c-hESCs after Dox treatment. Scale bars: 200 μm. (C) Scatter plot showing the comparison of the transcriptomes between the untreated (–Dox) and Dox-treated (+Dox) JMJD3c-hESCs. RNA-seq expression values (log10 of FPKM) are shown. (D) GO analyses of the up- and downregulated genes in the JMJD3c-hESCs. (E) Heat map analysis showing the changes in the expression of upregulated genes in the JMJD3c-hESCs from Day 0 to Day 4 after Dox treatment. Representative developmental genes are shown. The expression levels of these genes were not significantly changed in the JMJD3c mut-hESCs (Mut) at 4 days after Dox treatment. The color scale indicates log2 (fold change, +Dox/−Dox) gene expression. (F) qRT-PCR analyses showing the relative expression levels of pluripotent genes and mesoendodermal genes under differentiation conditions compared with hESCs. Basal medium, medium without cytokines and growth factors; Activin-A, medium used for endodermal differentiation; Activin-A+BMP4+bFGF, medium used for mesoendodermal differentiation; JMJD3c, medium with Dox. The expression levels were normalized to GAPDH. The error bars indicate the s.e.m. from two independent biological replicates. (G) qRT-PCR analyses showing the relative expression levels of ectodermal and mesoendodermal genes in the untreated and Dox-treated JMJD3c-hESCs cultured in neural induction medium (N2 medium). The error bars indicate the s.e.m. from three independent biological replicates. (H) qRT-PCR analyses showing the relative expression levels of FGF, BMP, NODAL and Wnt/β-catenin-related genes in the untreated and Dox-treated JMJD3c-hESCs. The error bars indicate the s.e.m. from three independent biological replicates.
Fig. 3.
Fig. 3.
Genome-wide reduction of H3K27me3 levels is induced by JMJD3c overexpression. (A) Changes in the H3K27me3 levels at developmental genes in JMJD3c-hESCs resulting from Dox treatment (Days 0 to 3) were analyzed by ChIP-qPCR. The 3′ region of SOX1 (SOX1-3′) was used as a negative control. The error bars indicate the s.e.m. from three independent biological replicates. *P<0.01, t-test. (B) ChIP-seq analyses of H3K27me3 in JMJD3c-hESCs treated with or without Dox for 3 days. The average profiles of H3K27me3 at the genomic regions (from 3 kb upstream to 3 kb downstream of gene bodies) are shown. TES, transcription end site; TSS, transcription start site. (C) Changes in H3K27me3 levels at the promoters of 20,242 Ensembl genes. ChIP-seq analysis of H3K4me3 and H3K27me3 was performed in JMJD3c-hESCs treated with or without Dox. The plots indicate the genes categorized by the H3K4me3 and H3K27me3 levels in the pluripotent state (−Dox). K4me3, the genes marked by H3K4me3 only; K27me3, the genes marked by H3K27me3 only; Bivalency, the genes marked by H3K4me3 and H3K27me3; No mark, the genes without H3K4me3 or H3K27me3 markers. The color scale indicates the log2 (fold change) of the H3K27me3 levels in the +Dox/–Dox cells. The demethylated genes are shown in red. (D) Relationship between the changes in gene expression and H3K27me3 demethylation following JMJD3c overexpression. The total genes (20,242 Ensembl genes) were sorted according to the log2 ratio of H3K27me3 demethylation in the +Dox/–Dox cells (black). The average values of the log2 ratio of gene expression (+Dox/–Dox) in a sliding window of 1000 genes are shown (red). The upregulated genes were significantly distributed in the H3K27me3 demethylated genes (P-value=9.69×10⁻⁸). (E) Functional annotation analysis of the H3K27me3-demethylated genes and upregulated genes following JMJD3c overexpression. Nine hundred demethylated genes (fold change <0.5, +Dox/–Dox) and 603 upregulated genes (fold change >2, +Dox/–Dox) were analyzed to annotate the signaling pathways. The P-value indicates the significance of the GO term enrichment.
Fig. 4.
Fig. 4.
Transient JMJD3c expression enhances hESC differentiation into multiple cell lineages. (A) Schematic of the experimental protocol for the data shown in B. JMJD3c-hESCs were treated with or without Dox on Days 1 to 2 after plating and were transfected with synthetic mRNAs for MYOD1, HNF1A, RUNX2 or SPI1 three times on Days 2 and 3. Synthetic mRNAs for Emerald or mCherry were transfected as controls. The cells were cultured in αMEM+5% KSR (KnockOut Serum Replacement) and collected for RT-PCR analyses on Day 4. (B) qRT-PCR analyses of tissue-specific genes (MYOG, AFP, COL1A1, CD45) in transcription factor-transfected cells with (+Dox) or without (−Dox) Dox treatment. Each transcription factor indicated on the x-axis was transfected into the JMJD3c-hESCs. The expression levels were normalized to GAPDH. The error bars indicate the s.e.m. from three independent biological replicates. *P<0.05, t-test. (C) Hepatic differentiation of JMJD3c-hESCs. The cells were treated with or without Dox for 3 days [from Day 1 (prior to differentiation) to Day 2 (after differentiation)]. The differentiated cells were immunostained with an antibody against AFP on Day 7 and with antibodies against albumin and CYP1A1 on Day 12. Scale bars: 100 μm. The percentages of AFP-, albumin- and CYP1A1-positive cells are shown. n=3. (D) Co-staining of AFP and albumin in the JMJD3c-induced hepatic cells on Day 12. Scale bar: 100 μm. (E) Albumin secretion level on Day 12 after differentiation was determined by ELISA. The error bars indicate the s.e.m. from two independent biological replicates. *P<0.05, t-test. (F) qRT-PCR analyses of CYP450 genes in hESCs and untreated and Dox-treated hESC-derived hepatic cells. The expression levels were normalized to GAPDH. The error bars indicate the s.e.m. from three independent biological replicates.
Fig. 5.
Fig. 5.
JMJD3c facilitates the MYOD1-mediated muscle differentiation of hESCs. (A) Schematic of the differentiation protocol. JMJD3c-hESCs were treated with or without Dox on Days 1 to 2 after plating and were transfected with synthetic mRNAs for MYOD1 or Emerald three times on Days 2 and 3. The cells were collected for each experiment on Day 5. (B) qRT-PCR analyses of the expression of myogenic genes in MYOD1-differentiated cells with (+Dox) or without (−Dox) Dox treatment. −, no transfection; Em, Emerald transfection; MYOD1, MYOD1 transfection. The expression levels were normalized to GAPDH. The error bars indicate the s.e.m. from three independent biological replicates. (C-E) ChIP-qPCR analyses of H3K27me3 (C), H3K4me3 (D) and H3K27ac (E) in the MYOG and MEF2C promoters of MYOD1-transfected cells with (+Dox) or without (−Dox) Dox treatment. Three (a-c) and two (a,b) regions of the MYOG and MEF2C promoters were tested, respectively. In human myoblasts, the MYOG (a,b) and MEF2C (a) regions are only enriched for H3K27ac, but not H3K4me3, whereas the MYOG (c) and MEF2C (b) regions are enriched for both markers (see also Fig. S6). T, positive control; SOX1-3′, negative control. The error bars indicate the s.e.m. from three independent biological replicates. *P<0.05, t-test. (F) Immunostaining for MHC in the cells overexpressing JMJD3c (+Dox), MYOD1 or both JMJD3c and MYOD1 (+Dox +MYOD1). Scale bar: 200 μm. (G) The percentage of nuclei contained within the MHC-stained cells out of total cells. The error bars indicate the s.e.m. from three independent biological replicates. *P<0.01, t-test. (H) MHC immunostaining in the MYOD1-transfected cells overexpressing JMJD3c or the JMJD3c mutant. The percentage of nuclei contained within the MHC-stained cells is shown. n=3. Scale bar: 200 μm. (I) RNA-seq analyses of upregulated genes in the myogenic cells that were induced from hESCs (ES-iMuscle) and human skeletal myotubes (Myotube). Upregulated genes were determined using ExAtlas (fold-change >4 in induced myogenic cells and >10 in myotubes relative to hESCs, z-value >4).
Fig. 6.
Fig. 6.
Synthetic mRNA-mediated myogenic differentiation of hESCs and iPSCs. (A) Schematic of the differentiation protocol. hESC/iPSCs were transfected with synthetic mRNAs for JMJD3c or mCherry twice on Days 1 and 2 and MYOD1 three times on Days 2 and 3. The cells were fixed for immunostaining on Day 5. (B) MHC immunostaining in cells that were transfected with MYOD1 after mCherry or JMJD3c transfection. Scale bar: 200 μm. (C) The percentage of nuclei contained within MHC-stained cells. The error bars indicate the s.e.m. from three independent biological replicates. *P<0.01, t-test. −, no transfection. (D) Representative image showing muscular fusion (arrowheads). Scale bar: 50 μm. (E) Immunostaining for creatine kinase M (CK-M). The arrow shows a mature skeletal muscle. Scale bar: 50 μm. (F) Induced myogenic cells were labeled with green fluorescence and co-cultured with mouse C2C12 cells, nuclei of which were labeled with red fluorescence. On Days 3 and 5 after co-culturing, cell fusions were detected (arrowheads). Scale bar: 50 μm. (G) H9-hESCs and hiPSCs derived from BJ fibroblasts were transfected with mCherry or JMJD3c, followed by MYOD1, and were immunostained for MHC. Scale bar: 200 μm. n=3. The percentage of nuclei contained within MHC-stained cells is shown.

Similar articles

Cited by

References

    1. Agger K., Cloos P. A., Christensen J., Pasini D., Rose S., Rappsilber J., Issaeva I., Canaani E., Salcini A. E. and Helin K. (2007). UTX and JMJD3 are histone H3K27 demethylases involved in HOX gene regulation and development. Nature 449, 731-734. 10.1038/nature06145 - DOI - PubMed
    1. Akiyama T., Xin L., Oda M., Sharov A. A., Amano M., Piao Y., Cadet J. S., Dudekula D. B., Qian Y., Wang W. et al. (2015). Transient bursts of Zscan4 expression are accompanied by the rapid derepression of heterochromatin in mouse embryonic stem cells. DNA Res. 22, 307-318. 10.1093/dnares/dsv013 - DOI - PMC - PubMed
    1. Akutsu H., Machida M., Kanzaki S., Sugawara T., Ohkura T., Nakamura N., Yamazaki-Inoue M., Miura T., Vemuri M., Rao M. S. et al. (2015). Xenogeneic-free defined conditions for derivation and expansion of human embryonic stem cells with mesenchymal stem cells. Regen. Ther. 1, 18-29. 10.1016/j.reth.2014.12.004 - DOI - PMC - PubMed
    1. Albini S., Coutinho P., Malecova B., Giordani L., Savchenko A., Forcales S. V. and Puri P. L. (2013). Epigenetic reprogramming of human embryonic stem cells into skeletal muscle cells and generation of contractile myospheres. Cell Rep. 3, 661-670. 10.1016/j.celrep.2013.02.012 - DOI - PMC - PubMed
    1. Ang Y.-S., Tsai S.-Y., Lee D.-F., Monk J., Su J., Ratnakumar K., Ding J., Ge Y., Darr H., Chang B. et al. (2011). Wdr5 mediates self-renewal and reprogramming via the embryonic stem cell core transcriptional network. Cell 145, 183-197. 10.1016/j.cell.2011.03.003 - DOI - PMC - PubMed

Publication types

MeSH terms