

Hemoglobin-oxygen affinity in high-altitude vertebrates: is there evidence for an adaptive trend?
- PMID: 27802149
- PMCID: PMC5091379
- DOI: 10.1242/jeb.127134
Hemoglobin-oxygen affinity in high-altitude vertebrates: is there evidence for an adaptive trend?
Abstract
In air-breathing vertebrates at high altitude, fine-tuned adjustments in hemoglobin (Hb)-O2 affinity provide an energetically efficient means of mitigating the effects of arterial hypoxemia. However, it is not always clear whether an increased or decreased Hb-O2 affinity should be expected to improve tissue O2 delivery under different degrees of hypoxia, due to the inherent trade-off between arterial O2 loading and peripheral O2 unloading. Theoretical results indicate that the optimal Hb-O2 affinity varies as a non-linear function of environmental O2 availability, and the threshold elevation at which an increased Hb-O2 affinity becomes advantageous depends on the magnitude of diffusion limitation (the extent to which O2 equilibration at the blood-gas interface is limited by the kinetics of O2 exchange). This body of theory provides a framework for interpreting the possible adaptive significance of evolved changes in Hb-O2 affinity in vertebrates that have colonized high-altitude environments. To evaluate the evidence for an empirical generalization and to test theoretical predictions, I synthesized comparative data in a phylogenetic framework to assess the strength of the relationship between Hb-O2 affinity and native elevation in mammals and birds. Evidence for a general trend in mammals is equivocal, but there is a remarkably strong positive relationship between Hb-O2 affinity and native elevation in birds. Evolved changes in Hb function in high-altitude birds provide one of the most compelling examples of convergent biochemical adaptation in vertebrates.
Keywords: Biochemical adaptation; Blood oxygen transport; Hemoglobin; High-altitude adaptation; Hypoxia; Physiological adaptation.
© 2016. Published by The Company of Biologists Ltd.
Conflict of interest statement
The author declares no competing or financial interests.
Figures
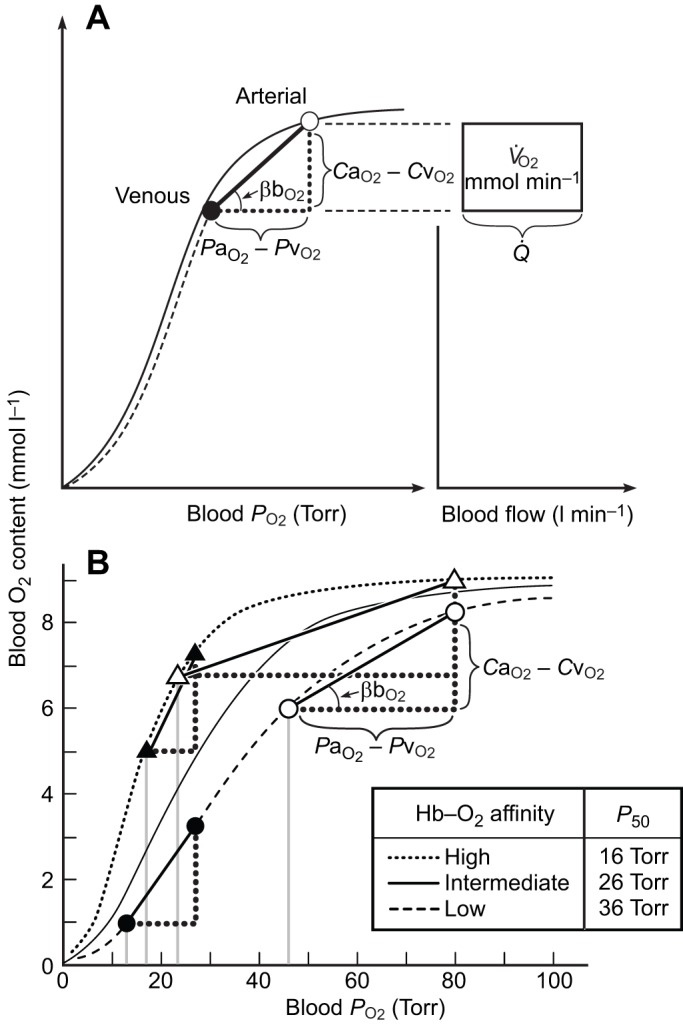
 denotes cardiac output, and
  denotes the rate of O2 consumption. On the right-hand side of the graph, the area of the rectangle is proportional to total O2 consumption, which can be enhanced by increasing
  and/or by increasing βbO2. Increases in βbO2 produce a corresponding increase in CaO2−CvO2 through shifts in the shape or position of the O2 equilibrium curve. (B) O2 equilibrium curves showing the effect of changes in Hb–O2 affinity on tissue O2 delivery under conditions of moderate hypoxia (open symbols) and severe hypoxia (filled symbols). For each pair of arterial and venous points, the PO2 for venous blood (PvO2) is marked by a vertical grey line that extends to the x-axis. The sigmoid O2 equilibrium curves are shown for high, intermediate and low Hb–O2 affinities; P50, the PO2 at which Hb is 50% saturated. Each change in Hb–O2 affinity produces a shift in PvO2, but the PO2 of arterial blood (PaO2) is assumed to remain constant. Note that under conditions of moderate hypoxia the right-shifted curve maximizes βbO2 and preserves a higher PvO2 (an overall index of tissue oxygenation). Under severe hypoxia, by contrast, the left-shifted curve maximizes βbO2 and preserves a higher PvO2 relative to the right-shifted curve. When the kinetics of O2 transfer across the alveolar gas–blood barrier is a limiting step (diffusion limitation), a left-shifted O2 equilibrium curve may also be advantageous under less severe hypoxia (Bencowitz et al., 1982).
Similar articles
-
Altitude acclimatization, hemoglobin-oxygen affinity, and circulatory oxygen transport in hypoxia.Mol Aspects Med. 2022 Apr;84:101052. doi: 10.1016/j.mam.2021.101052. Epub 2021 Dec 5. Mol Aspects Med. 2022. PMID: 34879970 Free PMC article. Review.
-
Bohr effect and temperature sensitivity of hemoglobins from highland and lowland deer mice.Comp Biochem Physiol A Mol Integr Physiol. 2016 May;195:10-4. doi: 10.1016/j.cbpa.2016.01.018. Epub 2016 Jan 22. Comp Biochem Physiol A Mol Integr Physiol. 2016. PMID: 26808972 Free PMC article.
-
Mechanisms of hemoglobin adaptation to high altitude hypoxia.High Alt Med Biol. 2008 Summer;9(2):148-57. doi: 10.1089/ham.2007.1079. High Alt Med Biol. 2008. PMID: 18578646 Free PMC article. Review.
-
The adaptive benefit of evolved increases in hemoglobin-O2 affinity is contingent on tissue O2 diffusing capacity in high-altitude deer mice.BMC Biol. 2021 Jun 22;19(1):128. doi: 10.1186/s12915-021-01059-4. BMC Biol. 2021. PMID: 34158035 Free PMC article.
-
Convergent Evolution of Hemoglobin Function in High-Altitude Andean Waterfowl Involves Limited Parallelism at the Molecular Sequence Level.PLoS Genet. 2015 Dec 4;11(12):e1005681. doi: 10.1371/journal.pgen.1005681. eCollection 2015 Dec. PLoS Genet. 2015. PMID: 26637114 Free PMC article.
Cited by
-
High-Altitude Adaptation: Mechanistic Insights from Integrated Genomics and Physiology.Mol Biol Evol. 2021 Jun 25;38(7):2677-2691. doi: 10.1093/molbev/msab064. Mol Biol Evol. 2021. PMID: 33751123 Free PMC article. Review.
-
Influence of High Hemoglobin-Oxygen Affinity on Humans During Hypoxia.Front Physiol. 2022 Jan 14;12:763933. doi: 10.3389/fphys.2021.763933. eCollection 2021. Front Physiol. 2022. PMID: 35095551 Free PMC article. Review.
-
Neural network correlates of high-altitude adaptive genetic variants in Tibetans: A pilot, exploratory study.Hum Brain Mapp. 2020 Jun 15;41(9):2406-2430. doi: 10.1002/hbm.24954. Epub 2020 Mar 4. Hum Brain Mapp. 2020. PMID: 32128935 Free PMC article.
-
Molecular basis of hemoglobin adaptation in the high-flying bar-headed goose.PLoS Genet. 2018 Apr 2;14(4):e1007331. doi: 10.1371/journal.pgen.1007331. eCollection 2018 Apr. PLoS Genet. 2018. PMID: 29608560 Free PMC article.
-
Blood substitutes: Basic science, translational studies and clinical trials.Front Med Technol. 2022 Aug 18;4:989829. doi: 10.3389/fmedt.2022.989829. eCollection 2022. Front Med Technol. 2022. PMID: 36062262 Free PMC article. No abstract available.
References
-
- Adair G. S. (1925). The hemoglobin system. VI. The oxygen dissociation curve of hemoglobin. J. Biol. Chem. 63, 529-545.
-
- Aste-Salazar H. and Hurtado A. (1944). The affinity of hemoglobin for oxygen at sea level and at high altitudes. Am. J. Physiol. 142, 733-743.
Publication types
MeSH terms
Substances
Grants and funding
LinkOut - more resources
Full Text Sources
Other Literature Sources
