. 2016 Nov 15;129(22):4238-4251.
doi: 10.1242/jcs.191684. Epub 2016 Oct 6.

Acid sphingomyelinase is required for cell surface presentation of Met receptor tyrosine kinase in cancer cells

Affiliations

Acid sphingomyelinase is required for cell surface presentation of Met receptor tyrosine kinase in cancer cells

Linyu Zhu et al. J Cell Sci. .

Abstract

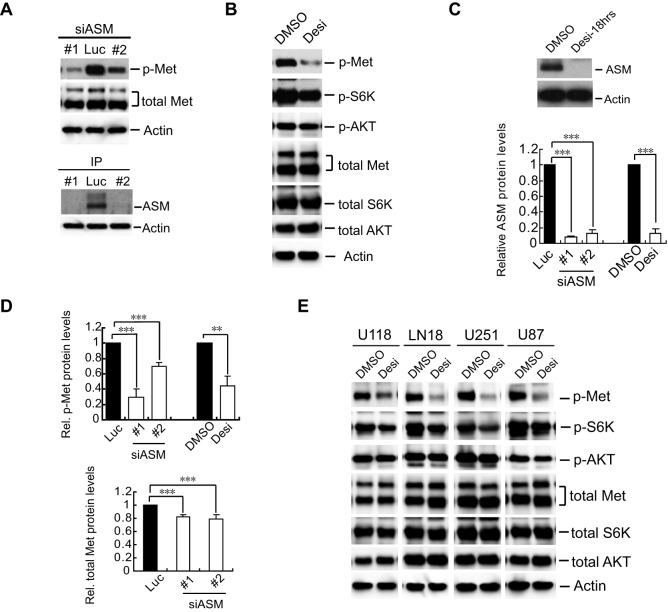
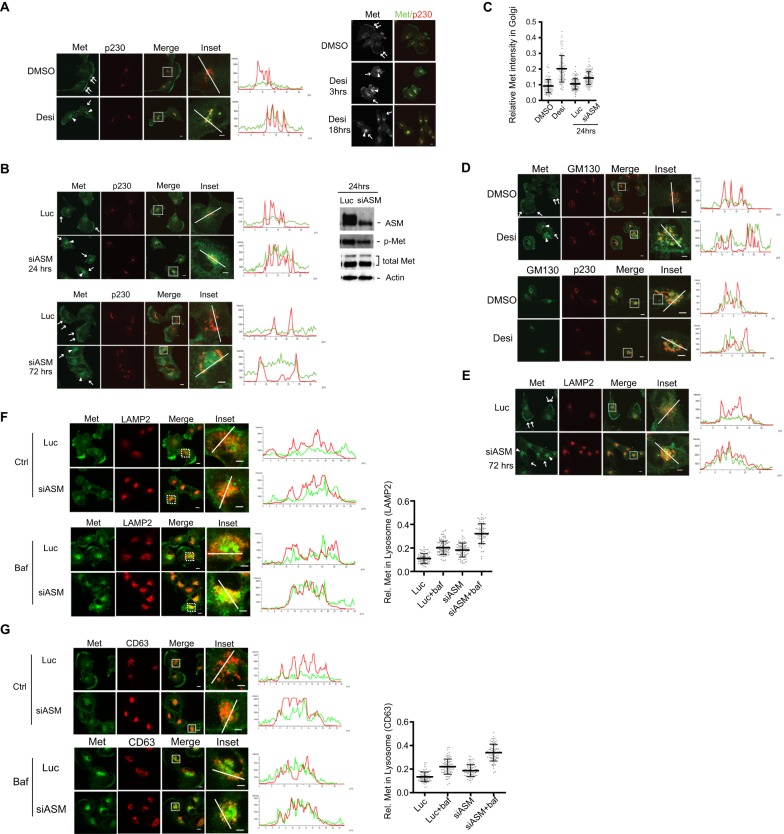
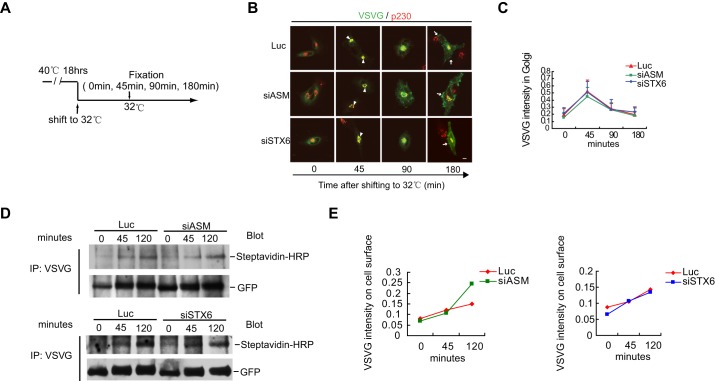
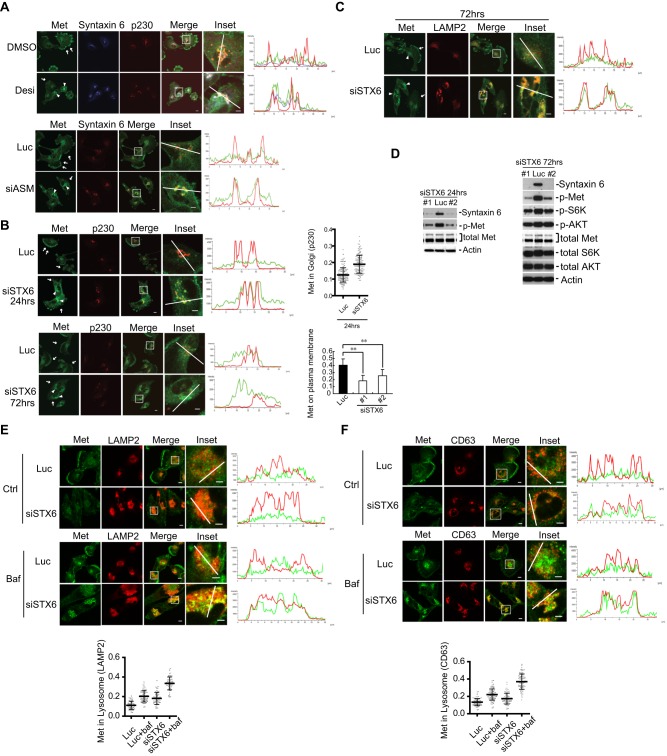
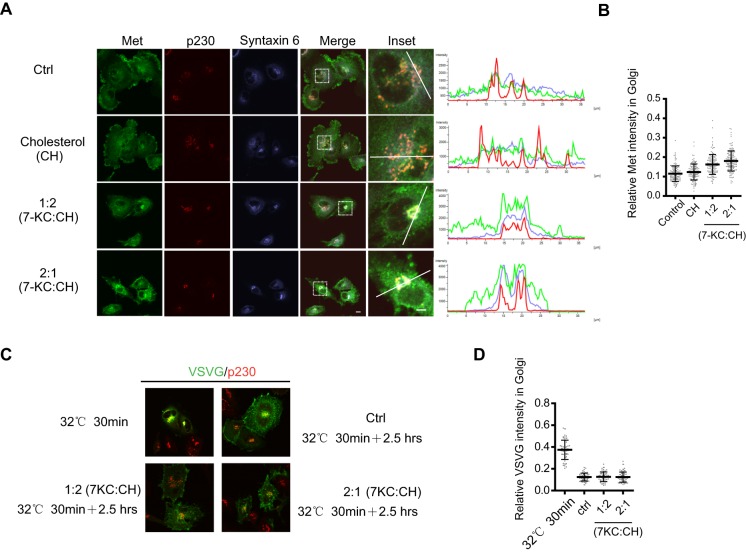
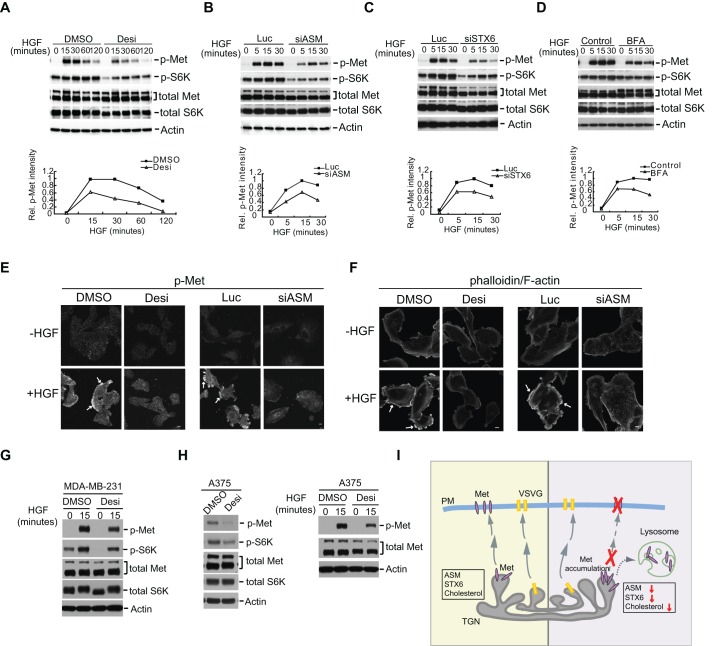
Receptor tyrosine kinases (RTKs) are embedded in the lipid bilayer of the plasma membrane, but the specific roles of various lipids in cell signaling remain largely uncharacterized. We have previously found that acid sphingomyelinase (ASM; also known as SMPD1) regulates the conserved DAF-2 (the ortholog IGF-1R in mammals) RTK signaling pathway in Caenorhabditis elegans How ASM and its catalytic products, ceramides, control RTK signaling pathways remain unclear. Here, we report that ASM regulates the homeostasis of Met, an RTK that is frequently overexpressed in various cancers. Inactivation of ASM led to a rapid loss of Met from the plasma membrane, reduced Met phosphorylation and activation, and induced Met accumulation in the trans-Golgi network (TGN). However, trafficking of integrin β3 and vesicular stomatitis virus glycoprotein (VSVG) was largely unaffected. Knockdown of syntaxin 6 (STX6) also blocked the Golgi exit of Met. Depletion of either ASM or STX6 led to aberrant trafficking of Met to lysosomes, promoting its degradation. Our studies reveal that ASM and ceramides, together with STX6 and cholesterol, constitute a new regulatory mechanism for the exit of Met from the Golgi during its biosynthetic route, which is used to rapidly replenish and regulate the plasma membrane levels of Met in various cancer cells.

Keywords: ASM; Acid Sphingomyelinase; Ceramide; Golgi; Met; RTK; Receptor tyrosine kinase; SMPD1; STX6; Syntaxin 6.


Conflict of interest statement

The authors declare no competing or financial interests.

Figures

Fig. 1.
Fig. 1.
Inactivation of ASM reduces the levels of tyrosine-phosphorylated Met. (A) U373-MG cells were transfected with an siRNA against luciferase (Luc, control) or two independent siRNAs against ASM (#1 and #2; siASM). Lysates harvested at 72 h post transfection were analyzed by immunoblotting with antibodies for Y1234- and Y1235-phosphorylated Met (p-Met) and total Met (upper band, p170; lower band, p145) with actin as a loading control. (B) U373-MG cells were treated with DMSO (control) or 30 µM desipramine (Desi) for 18 h. Membranes were immunoblotted for the indicated proteins. p-, phosphorylated. (C) Changes in ASM protein levels were examined by immunoprecipitation and western blotting analyses with anti-ASM antibodies, with equal amounts of lysates, using actin as the control. Bottom, a quantification of ASM proteins in the ASM-inactivated cells from panels A and C, normalized to values from control cells, with the mean and error bars (s.d.) from three independent repeats (statistical significance, ***P<0.001). (D) A quantification of the relative (Rel.) intensities of tyrosine-phosphorylated Met (p-Met) as to the total Met protein (top) and of the changes in the amount of total Met protein normalized to the actin loading control in control and ASM-inactivated cells in panels A and B (***P<0.001 and **P<0.01, Student's t-test). (E) The GBM cell lines U118-MG (U118), LN18, U251-MG (U251) and U87-MG (U87) were each treated with DMSO or 30 µM of desipramine, and membranes were immunoblotted for the indicated proteins as in panel B.
Fig. 2.
Fig. 2.
Inactivation of ASM triggers loss of Met from the plasma membrane and causes its intracellular accumulation. (A) U373-MG cells were treated with DMSO (control) or 30 µM desipramine (Desi) for 18 h. Cells were immunostained and examined by confocal microscopy with antibodies for Met (green), and DAPI (blue) as a nuclei counter-stain. Arrows, Met on plasma membrane; arrowheads, intracellular Met staining. Linescan intensity profiles show the green and blue fluorescence intensities (y-axis, arbitrary units) along the white line drawn across the cell (x-axis, distance in µm). Arrow on linescan indicates position of the plasma membrane. (B) U373-MG cells were treated with control siRNA (Luc) or two independent siRNAs against ASM (#1 and #2; siASM) for 72 h. Cells were immunostained as described in panel A. Arrows, Met on plasma membrane; arrowheads, intracellular Met staining. (C) The means of the cell plasma membrane Met intensities in control and ASM-inactivated cells were compared (error bars indicate s.d.), obtained by quantifying Met staining in the plasma membrane region versus that in the whole cell (about 100 cells from three independent experiments were measured for each condition, statistical significance ***P<0.001 and **P<0.01, Student's t-test). (D) Cells, treated as described in panel A, were immunostained, examined with antibodies for Met (green) and integrin β3 (red), and the relative plasma membrane fluorescence intensities of Met or integrin β3 were quantified as described in panel C (statistical significance: ***P<0.001; NS, not significant; Student's t-test). Arrows, Met on plasma membrane; arrowheads, intracellular Met staining. Arrow on linescan indicates position of the plasma membrane. (E) U373-MG cells were treated with DMSO or desipramine. Live cells were detached using a mild protease and processed for surface staining with an anti-Met antibody, and then analyzed by using FACS on triplicate experiments (statistical significance: ***P<0.001, Student's t-test). Relative plasma membrane Met was determined by measuring the mean fluorescence intensities (MFIs). (F) Cells were treated with DMSO or desipramine as in A, or with control siRNA (Luc) or ASM siRNAs (oligonucleotide #1, siASM) as in B. Subsequently, attached live cells were then briefly labeled with biotin and lysed, and Met proteins were immunoprecipitated (IP) with anti-Met antibodies. The surface-biotinylated Met was detected with streptavidin–HRP, compared and quantified relative to total Met analyzed by using anti-Met antibodies (quantification from three independent experiments, right). (G) U373-MG cells were transfected with control siRNA (Luc) and two independent siRNAs against IGF-1R (#1 and #2; siIGF1R), fixed 72 h later, and analyzed by immunostaining with an anti-Met antibody or by western blotting for the indicated proteins. p-, phosphorylated. Scale bars: 10 µm (A,B,D,G).
Fig. 3.
Fig. 3.
ASM inactivation leads to Met accumulation in the Golgi compartment. (A) U373-MG cells were treated with DMSO or 35 µM desipramine (Desi) for 3 h. Cells were co-immunostained with antibodies for Met (green) and p230 (red) (left images, arrows: plasma-membrane-associated Met; arrowheads: intracellular Met). Merged channel shows colocalization (yellow) of Met and p230. Insets: enlarged images of the boxed regions. Linescan intensity profiles of green and red fluorescence intensities show colocalization of Met (green) and p230 (red) in the desipramine-treated cells along the white lines. Linescan: y-axis, arbitrary units of intensity along the white line drawn across the cell (x-axis, distance in µm). Right panel: time course analysis of Met staining after various periods of desipramine treatment. Met started to accumulate in the intracellular perinuclear regions (arrowheads) within 3 h and then was lost from the plasma membrane (arrows) 18 h after desipramine treatment. (B) Cells were transfected with siRNA against Luciferase (Luc) or siRNA against ASM (siASM, #1), and processed 24 or 72 h later for co-immunostaining, as described in panel A. Cell lysates were prepared and examined by western blot analysis with the indicated antibodies, as described in Fig. 1A. (C) Quantification of relative Met staining in the Golgi region. The intensity of Met staining in the Golgi region (marked by p230 staining) relative to the intensity of total Met in the whole cell was measured in 100 cells under each condition (from three independent experiments) and is shown in a scatter plot (mean and s.d. are indicated by the center and vertical bars, respectively). (D,E) Cells, treated as indicated, were processed for co-immunostaining for the indicated proteins. Arrows, Met on plasma membrane; arrowheads, intracellular Met staining. (F,G) Cells were treated with control (Luc) or siRNA against ASM (siASM, #1) for 52 h and then treated with bafilomycin A1 (Baf, 100 nM) for an additional 7 h. Cells were co-immunostained with antibodies against Met and LAMP2 (F) or Met and CD63 (G). Right panels, quantification results of relative (Rel.) Met staining in the LAMP2- or CD63-marked lysosome regions as compared to the intensity of Met staining across whole cells (from about 70 cells for each condition, from three independent experiments) are shown as scatter plots. Scale bars: 10 µm (all images excluding insets); 5 µm (inset images).
Fig. 4.
Fig. 4.
Biosynthetic Met protein is regulated by ASM. (A) U373-MG cells were transfected with control siRNA and siRNA against ASM (siASM; #1) for 72 h. Cells were pulse-labeled with 35S-labeled methionine for 1 h, washed and chased for various time points as indicated. Met proteins were immunoprecipitated with anti-Met antibodies, resolved in a protein gel and visualized by using fluorography (top panel) and then quantified relative (Rel.) to the Met intensity at 0 hour (bottom left panel). Bottom right, cells were treated with DMSO or 35 μM desipramine (Desi) for 30 min, labeled with 35S-labeled methionine for 3 h in the presence of DMSO or desipramine, and then directly lysed and analyzed. (B) Cells were treated with cycloheximide (100 µg/ml) for 3 or 6 h, and whole cell lysates were immunoblotted with antibodies against Met that recognize both Met precursor (p170, arrow) and the mature β p145 Met protein (lower band). Quantification of p145 Met in response to cycloheximide was plotted (**P<0.01; ***P<0.001; Student's t-test, three independent experiments) with the mean and error bars (s.d.) obtained from three independent repeats. (C) Cells were treated with DMSO or 35 µM desipramine for 90 or 180 min. Cell lysates were split into two portions; one portion was directly examined by immunoblotting analysis for Met and the other indicated proteins (left panel), whereas the other portion was subjected to immunoprecipitation and then western blot analysis for ASM (right panel). Actin was used as control for both panels. p-, phosphorylated protein. (D) Cells were pre-incubated with or without cycloheximide (100 µg/ml) for 3 h. DMSO (control) or 35 µM desipramine (Desi) was then added in the presence or absence of cycloheximide for an additional 3 h. Cells were co-immunostained for Met and p230, and quantified to obtain the means for the relative intensities of Met staining in Golgi regions under various conditions, conducted as described in Fig. 3C. Linescan intensity profiles show the fluorescence intensities (y-axis, arbitrary units) along the white line drawn across the cell (x-axis, distance in µm). Arrowheads, Met staining in the Golgi region. (E) Cells were treated with brefeldin A (BFA, 3 μg/ml) for 3 h and cells were co-stained for Met and p230. Ctrl, control, DMSO. Arrows, Met staining on the plasma membrane. (F) Cells were treated with BFA (3 μg/ml) for 90 or 180 min, and membranes were immunoblotted for the indicated proteins. p-, phosphorylated protein. Arrow: p170 Met precursor (B,C,F).
Fig. 5.
Fig. 5.
ASM and STX6 are not required for the Golgi transport of VSVG. (A) An illustration depicting the time course for analyzing the transport of the VSVG-ts045–GFP reporter from the Golgi to the plasma membrane. (B) U373-MG cells, transfected with the reporter plasmid, were cultured at non-permissive temperature 40°C for 18 h. Cells were subsequently shifted to permissive temperature 32°C (time 0), VSVG was detected later in the TGN at 45 min, and then on the plasma membrane at 90 and 180 min in control siRNA (Luc) or in cells transfected with siRNAs against ASM (siASM) and STX6 (siSTX6). Scale bars: 10 µm. Arrowheads, VSVG staining in the Golgi region; arrows, VSVG staining on the plasma membrane. (C) Quantification of the mean of VSVG intensity in the Golgi region (marked by p230) relative to the whole-cell intensity for cells in panel B was performed as described in Fig. 3C. For each condition, at least 50 cells from three independent experiments were analyzed (error bars indicate s.d.). (D,E) U373-MG cells stably expressing the VSVG-ts045–GFP protein were transfected with siASM or siSTX6 for 48 h. After incubation at 40°C for 18 h, cells were shifted to 32°C for the indicated times. Cell surface proteins were biotinylated, cells were lysed and VSVG-ts045–GFP proteins were immunoprecipitated (IP) with anti-VSVG antibodies and analyzed by using SDS-PAGE. The cell-surface-biotinylated VSVG was detected with streptavidin–HRP, and total VSVG was detected with an anti-GFP antibody (D). The relative cell surface VSVG as a percentage of the total VSVG was calculated (E).
Fig. 6.
Fig. 6.
STX6 regulates Met exit from TGN. (A) U373-MG cells were treated with DMSO or 35 μM desipramine (Desi) for 3 h or transfected with siRNAs against luciferase (Luc) or ASM (#1, siASM) for 24 h, and then co-immunostained for Met (green), STX6 (blue) and p230 (red) as indicated. Insets: enlarged boxed regions. Linescan intensity profiles of Met, STX6 and p230 signals along the white axis lines in insets show strong colocalization and overlap of Met (green), STX6 (blue) and p230 (red) signals in the ASM-inactivated cells, as compared to their weak overlap in the control cells. (B,C) Cells were transfected with siRNAs against luciferase (Luc) or STX6 (#1, siSTX6) for either 24 or 72 h and then co-stained with antibodies against Met and p230 (B) or with antibodies against Met and lysosomal marker LAMP2 (C). In the right-hand panels of B, quantification of the relative Met staining intensity in the Golgi region (marked by p230 staining, top panel) and the plasma-membrane-associated Met (bottom panel) from 100 cells for each indicated condition was conducted as described in Fig. 3C and Fig. 2C, respectively (error bars, s.d.; **P<0.01, Student's t-test). Arrows, Met staining on the plasma membrane; arrowheads, Met staining in the intracellular compartments (p230- or LAMP2-positive compartments). (D) Cells were treated with siRNA against Luciferase (Luc, control) or STX6 (oligonucleotide #1 or #2). Proteins in the cell lysates were analyzed by immunoblotting for the indicated proteins. p-, phosphorylated protein. (E,F) Cells were treated with control siRNA or siRNA against STX6 (oligonucleotide #1) for 52 h and then treated with or without bafilomycin A1 (Baf, 100 nM) for additional 7 h. Cells were fixed and co-stained for Met and LAMP2 (E) or for Met and CD63 (F) with antibodies, and the relative Met staining in the lysosome region (marked by LAMP2 or CD63 staining, respectively) was quantified from 70 cells for each condition, conducted as described in Fig. 3F and G. Scale bars: 10 μm (all images excluding insets); 5 μm (insets).
Fig. 7.
Fig. 7.
Cholesterol depletion blocks Met in the TGN. (A) U373-MG cells were treated for 15 min either with vehicle, cholesterol (30 µM), a mixture of 7-ketocholesterol (7-KC) and cholesterol (CH) at a 1:2 ratio (10 µM 7-KC:20 µM CH) or at 2:1 ratio (20 µM 7-KC:10 µM CH) as indicated. Cells were co-immunostained for Met, STX6 and p230. Insets: enlarged boxed regions. Fluorescence intensity profiles of Met, STX6 and p230 staining signals along the white lines show enhanced colocalization of these proteins in response to 7-ketocholesterol. Scale bar: 10 µm (all images except insets); 5 µm (inset images). (B) Quantification of the relative Met staining intensity in the Golgi region (marked by p230 staining) from 100 cells under each condition; conducted as described in Fig. 3C. (C) U373-MG cells stably expressing the VSVG-ts045–GFP protein were incubated at 40°C for 18 h and shifted to 32°C for 30 min, which served as the starting point (top left). Cells were treated with or without 7-KC and incubated at 32°C for another 2.5 h, fixed and stained for p230 (red) with antibodies, and VSVG-ts045–GFP was detected by GFP green fluorescence. (D) Quantification of the mean of VSVG intensities in the Golgi region (marked by p230) relative to the whole-cell intensity for 50 cells under each indicated condition was performed as described in Fig. 5C, and data are plotted as a scatter plot.
Fig. 8.
Fig. 8.
Inactivation of ASM or STX6 blocks the ligand-induced Met activation and downstream signaling. (A) U373-MG cells were treated with DMSO or 30 µM desipramine (Desi) for 18 h. The cells were further serum-starved with or without 30 µM desipramine for 3 h and then stimulated with HGF (50 ng/ml) for the indicated times. (B,C) Similar to A, except that cells were transfected with control siRNA (Luc) or siRNAs against ASM (B, siASM) or STX6 (C, siSTX6) and then then starved and re-stimulated with HGF. (D) Similar to A, except cells were treated with 3 µg/ml BFA during serum starvation for 3 h before HGF re-stimulation. In A–D, proteins were detected using the indicated antibodies and the relative (Rel.) band intensities of phosphorylated Met (p-Met) to that of the total Met proteins were quantified using actin as a loading control. Control, without drug addition. (E,F) U373-MG cells were treated with desipramine or siRNAs against ASM as in A and B. The cells were serum-starved and then stimulated with HGF for 15 min. Cells were immunostained with an antibody detecting Y1234- and Y1235-phosphorylated Met (p-Met) (E) or with phalloidin for F-actin (F). Arrows in E, p-Met staining on the plasma membrane; arrows in F, F-actin staining. Scale bars: 10 μm. (G,H) Breast cancer MDA-MB-231 cells (G) or melanoma A375 cells (H, right panels) were treated with DMSO or 30 µM desipramine for 18 h. The cells were serum-starved with or without 30 µM desipramine for 3 h and then stimulated with HGF (50 ng/ml) for 15 min as indicated. A375 cells were also treated with DMSO or 30 µM desipramine for 18 h in regular growth medium without starvation and HGF treatment (H, left panels). The levels of phosphorylated Met (p-Met) and phosphorylated S6K (p-S6K), as well as the total levels of Met and S6K were analyzed. For total Met, the upper band represents the p170 form, and the lower band represents the p145 form. (I) A model for ASM or STX6 function on the regulation of Met protein traffic. ASM, STX6 and cholesterol regulate a unique subdomain on the TGN that is required for Met protein transport, whereas a different subdomain on the TGN is used for VSVG protein transport. Prolonged trapping of Met in the TGN after loss of ASM or STX6 subsequently induces aberrant trafficking of Met to lysosomes and then degradation of Met. PM, plasma membrane.

References

    1. Akasaki K., Michihara A., Fujiwara Y., Mibuka K. and Tsuji H. (1996). Biosynthetic transport of a major lysosome-associated membrane glycoprotein 2, lamp-2: a significant fraction of newly synthesized lamp-2 is delivered to lysosomes by way of early endosomes. J. Biochem. 120, 1088-1094. 10.1093/oxfordjournals.jbchem.a021526 - DOI - PubMed
    1. Cao H.-H., Cheng C.-Y., Su T., Fu X.-Q., Guo H., Li T., Tse A. K.-W., Kwan H.-Y., Yu H. and Yu Z.-L. (2015). Quercetin inhibits HGF/c-Met signaling and HGF-stimulated melanoma cell migration and invasion. Mol. Cancer 14, 103 10.1186/s12943-015-0367-4 - DOI - PMC - PubMed
    1. Choudhury A., Marks D. L., Proctor K. M., Gould G. W. and Pagano R. E. (2006). Regulation of caveolar endocytosis by syntaxin 6-dependent delivery of membrane components to the cell surface. Nat. Cell Biol. 8, 317-328. 10.1038/ncb1380 - DOI - PubMed
    1. Clague M. J. (2011). Met receptor: a moving target. Sci. Signal. 4, pe40 10.1126/scisignal.2002422 - DOI - PubMed
    1. Cremesti A., Paris F., Grassme H., Holler N., Tschopp J., Fuks Z., Gulbins E. and Kolesnick R. (2001). Ceramide enables fas to cap and kill. J. Biol. Chem. 276, 23954-23961. 10.1074/jbc.M101866200 - DOI - PubMed

Publication types

MeSH terms