. 2016 Dec 1;129(23):4388-4398.
doi: 10.1242/jcs.196873. Epub 2016 Oct 21.

Junctophilin-2 in the nanoscale organisation and functional signalling of ryanodine receptor clusters in cardiomyocytes

Affiliations

Junctophilin-2 in the nanoscale organisation and functional signalling of ryanodine receptor clusters in cardiomyocytes

Michelle L Munro et al. J Cell Sci. .

Abstract

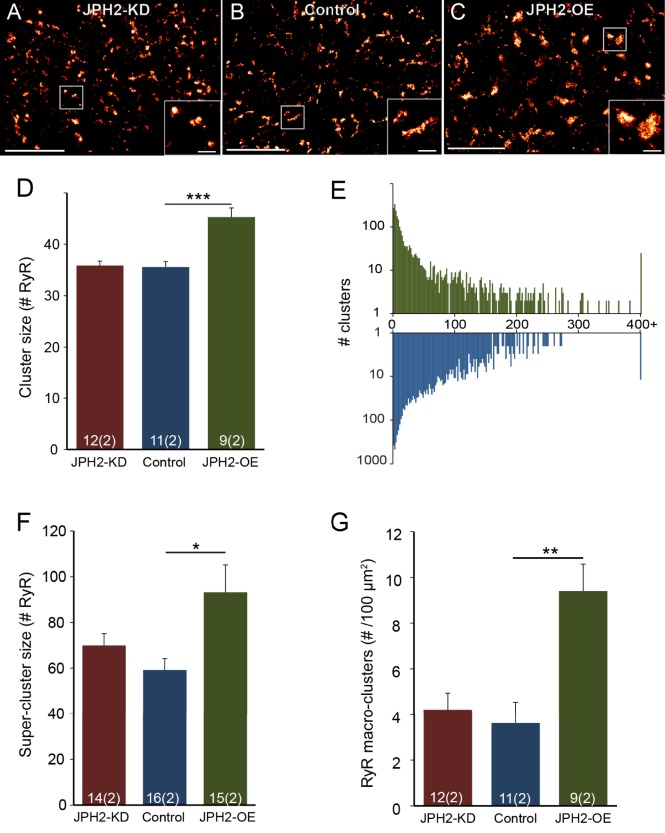
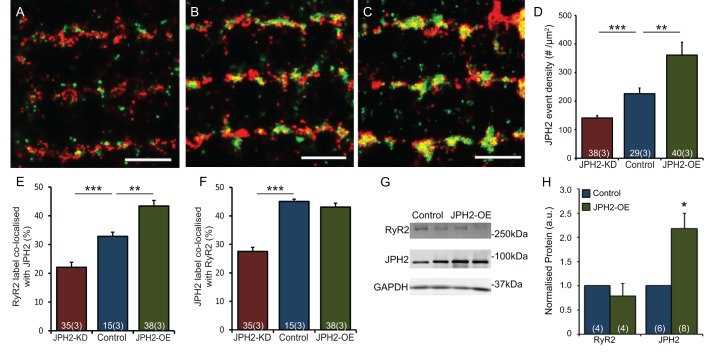
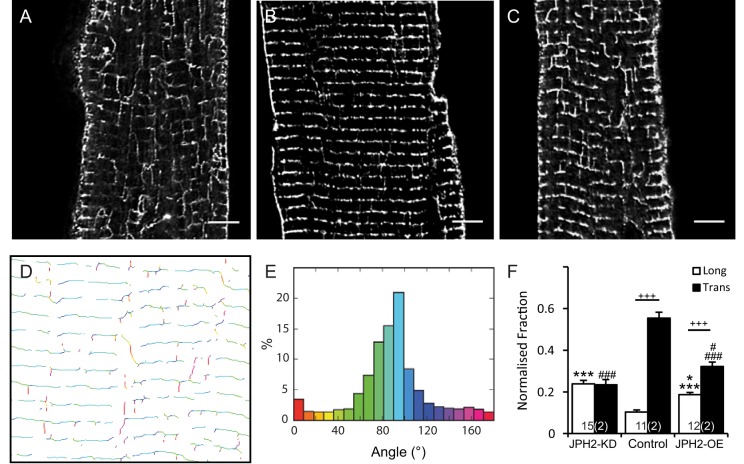
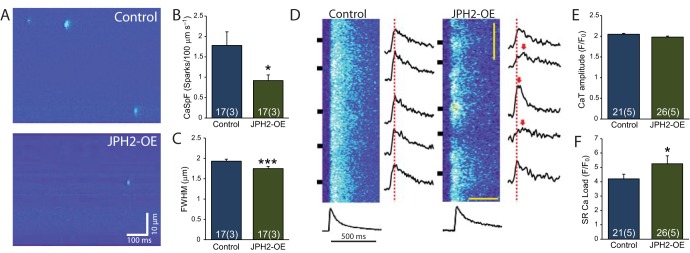
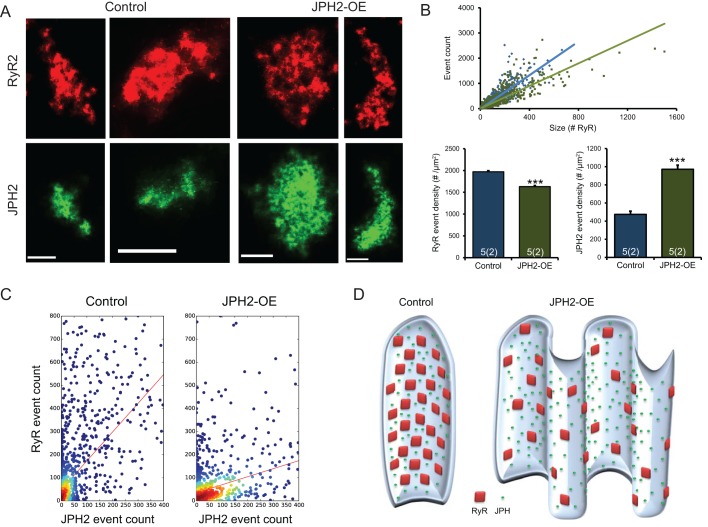
Signalling nanodomains requiring close contact between the plasma membrane and internal compartments, known as 'junctions', are fast communication hubs within excitable cells such as neurones and muscle. Here, we have examined two transgenic murine models probing the role of junctophilin-2, a membrane-tethering protein crucial for the formation and molecular organisation of sub-microscopic junctions in ventricular muscle cells of the heart. Quantitative single-molecule localisation microscopy showed that junctions in animals producing above-normal levels of junctophilin-2 were enlarged, allowing the re-organisation of the primary functional protein within it, the ryanodine receptor (RyR; in this paper, we use RyR to refer to the myocardial isoform RyR2). Although this change was associated with much enlarged RyR clusters that, due to their size, should be more excitable, functionally it caused a mild inhibition in the Ca2+ signalling output of the junctions (Ca2+ sparks). Analysis of the single-molecule densities of both RyR and junctophilin-2 revealed an ∼3-fold increase in the junctophilin-2 to RyR ratio. This molecular rearrangement is compatible with direct inhibition of RyR opening by junctophilin-2 to intrinsically stabilise the Ca2+ signalling properties of the junction and thus the contractile function of the cell.

Keywords: Ca2+ signalling; Excitation-contraction coupling; Junctophilin-2; Ryanodine receptor; Super-resolution imaging; dSTORM.


Conflict of interest statement

X.H.T.W. is a founder and equity holder in Elex Biotech Llc.

Figures

Fig. 1.
Fig. 1.
JPH2 expression influences the nanoscale organisation of RyR clusters. Super resolution images of RyR labelling in myocardium with transverse orientation from (A) JPH2-KD, (B) control and (C) JPH2-OE mice; magnified view of clusters are shown in the insets. Scale bars: 4 µm (main panels); 0.5 µm (insets). Analysis of RyR clusters imaged in transverse orientation showing: (D) the RyR cluster size and (E) the distribution of the number of RyR clusters across increasing cluster size on a logarithmic scale (colour-coded as in D). (F) The mean size of the RyR super-clusters, and (G) the prevalence of RyR macro-clusters as number observed per 100 µm2. Control, n=11 cells, 2 animals; JPH2-KD, n=12 cells, 2 animals; JPH2-OE, n=9 cells, 2 animals. Data are displayed as mean±s.e.m. *P<0.05, **P<0.01, ***P<0.001 (Kruskal–Wallis two-sided test).
Fig. 2.
Fig. 2.
JPH2 expression influences colocalisation with RyR. Super resolution images showing dual immunolabelling of RyR (red) with JPH2 (green) in cardiomyocytes isolated from (A) JPH2-KD, (B) control and (C) JPH2-OE mice. Scale bars: 1.5 µm. (D) Global mean density per cell cross-sectional area of JPH2 localisation events in the three genotypes. JPH2-KD, n=38 cells, 3 animals; control, n=29 cells, 3 animals; JPH2-OE, n=40 cells, 3 animals. (E,F) Colocalisation analysis in JPH2-KD (red), control (blue) and JPH2-OE (green) mice showing the fraction of (E) RyR label colocalised with JPH2 and (F) JPH2 label colocalised with RyR; JPH2-KD: n=35 cells, 3 animals, control: n=15 cells, 3 animals, JPH2-OE: n=38 cells, 3 animals. (G) Western blot analysis of RyR, JPH2 and GAPDH expression levels in control and JPH2-OE mice with (H) GAPDH-normalised expression levels of RyR and JPH2 in control (blue) and JPH2-OE (green) mouse hearts; RyR, n=5 animals each; JPH2, n=5 control animals, n=6 JPH2-OE animals. Data are displayed as mean±s.e.m. *P<0.05, **P<0.01, ***P<0.001 (Kruskal–Wallis two-sided test in D; two-sided Student's t-test in E,F,H).
Fig. 3.
Fig. 3.
The t-tubule membrane system changes in cells with altered JPH2 expression. Deconvolved confocal micrographs showing t-tubule immunolabelling in cardiomyocytes isolated from (A) JPH2-KD, (B) control and (C) JPH2-OE mice. Scale bars: 5 µm. The local angles of t-tubules were analysed on skeletonised confocal images such as in A–C. The shown example image illustrates (D) a two-dimensional map of the locally determined angle, colour-coded and statistically analysed as (E) a frequency distribution of all t-tubule angles measured in relation to the longitudinal axis of the cell. (F) Fraction of longitudinally (0–18°; white) and transversely (72–90°; black) orientated t-tubules in JPH2-KD (n=15 cells, 2 animals), control (n=11 cells, 2 animals) and JPH2-OE (n=12 cells, 2 animals) cardiomyocytes. Data are displayed as mean±s.e.m. +++P<0.001 (transverse versus longitudinal within genotype); *P<0.05 (JPH2-KD versus JPH2-OE), ***P<0.001 (control versus JPH2-KD and JPH2-OE) longitudinal angles; #P<0.05 (JPH2-KD versus JPH2-OE), ###P<0.001 transverse angles (control versus JPH2-KD and JPH2-OE) (Kruskal–Wallis two-sided test).
Fig. 4.
Fig. 4.
Normal Ca2+ transients and reduced Ca2+ spark frequency in JPH2-OE mice. (A) Representative confocal line-scan images showing Ca2+ sparks in ventricular myocytes from control and JPH2-OE mice. (B) Quantification showing reduced Ca2+ spark frequency in JPH2-OE compared to control mice. (C) Quantification showing decreased Ca2+ spark size in JPH2-OE mice (FWHM; n=17 cells, 3 animals both genotypes). (D) Confocal linescan images showing similar Ca2+ transients in ventricular myocytes from control and JPH2-OE mice. (E) Bar graph showing quantification of Ca2+ transient amplitude (CaT). (F) Bar graph quantifying increased SR Ca2+ load in JPH2-OE cardiomyocytes (control n=21, cells, 5 animals; JPH2-OE, n=26 cells, 5 animals). Data are displayed as mean±s.e.m. *P<0.05, ***P<0.001 (two-sided Student's t-test).
Fig. 5.
Fig. 5.
RyR and JPH2 density in co-clusters with JPH2 overexpression. (A) Examples of corresponding RyR and JPH2 clusters in control and JPH2-OE cardiomyocytes, showing an overall similar junctional shape of the two proteins. Scale bars: 0.25 µm. (B) Super resolution event counts for junctional RyR according to cluster size in both genotypes, with a significantly reduced mean event density in JPH2-OE cells; the corresponding mean junctional JPH2 event density is significantly increased in JPH2-OE mice (control, n=5 cells, 2 animals; JPH2-OE, n=5 cells, 2 animals). Data are displayed as mean±s.e.m. ***P<0.001 (Mann–Whitney two-sided test). (C) The distribution ratio of RyR events to JPH2 events within the junction is altered between control and JPH2-OE mice, suggesting fewer RyR per JPH2 present in JPH2-OE [1.25±0.03 versus 0.35±0.01 RyR-events per JPH2-event; mean±s.e.m.; P<0.001, Z-statistic determined from slopes based on the Paternoster et al. (1998) equation]. (D) A schematic representing the organisation of the junction in control and JPH2-OE mice based on the nanoscale RyR and JPH2 cluster properties that were measured and the dyad membrane topology resolved by Guo et al. (2014).

References

    1. Asghari P., Scriven D. R. L., Sanatani S., Gandhi S. K., Campbell A. I. M. and Moore E. D. W. (2014). Nonuniform and variable arrangements of ryanodine receptors within mammalian ventricular couplons. Circ. Res. 115, 252-262. 10.1161/CIRCRESAHA.115.303897 - DOI - PubMed
    1. Baddeley D., Jayasinghe I. D., Lam L., Rossberger S., Cannell M. B. and Soeller C. (2009). Optical single-channel resolution imaging of the ryanodine receptor distribution in rat cardiac myocytes. Proc. Natl. Acad. Sci. USA 106, 22275-22280. 10.1073/pnas.0908971106 - DOI - PMC - PubMed
    1. Baddeley D., Cannell M. B. and Soeller C. (2010). Visualization of localization microscopy data. Microsc. Microanal. 16, 64-72. 10.1017/S143192760999122X - DOI - PubMed
    1. Baddeley D., Crossman D., Rossberger S., Cheyne J. E., Montgomery J. M., Jayasinghe I. D., Cremer C., Cannell M. B. and Soeller C. (2011). 4D super-resolution microscopy with conventional fluorophores and single wavelength excitation in optically thick cells and tissues. PLoS ONE 6, e20645 10.1371/journal.pone.0020645 - DOI - PMC - PubMed
    1. Beavers D. L., Wang W., Ather S., Voigt N., Garbino A., Dixit S. S., Landstrom A. P., Li N., Wang Q., Olivotto I. et al. (2013). Mutation E169K in Junctophilin-2 Causes Atrial Fibrillation Due to Impaired RyR2 Stabilization. J. Am. Coll. Cardiol. 62, 2010-2019. 10.1016/j.jacc.2013.06.052 - DOI - PMC - PubMed

Publication types

Substances