. 2016 Nov 1;11(11):e0165670.
doi: 10.1371/journal.pone.0165670. eCollection 2016.

Tripping Elicits Earlier and Larger Deviations in Linear Head Acceleration Compared to Slipping

Affiliations

Tripping Elicits Earlier and Larger Deviations in Linear Head Acceleration Compared to Slipping

Sara L Arena et al. PLoS One. .

Abstract

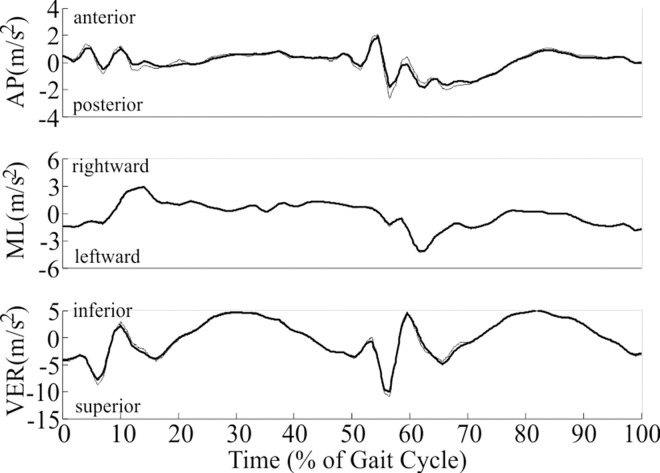
Slipping and tripping contribute to a large number of falls and fall-related injuries. While the vestibular system is known to contribute to balance and fall prevention, it is unclear whether it contributes to detecting slip or trip onset. Therefore, the purpose of this study was to investigate the effects of slipping and tripping on head acceleration during walking. This information would help determine whether individuals with vestibular dysfunction are likely to be at a greater risk of falls due to slipping or tripping, and would inform the potential development of assistive devices providing augmented sensory feedback for vestibular dysfunction. Twelve young men were exposed to an unexpected slip or trip. Head acceleration was measured and transformed to an approximate location of the vestibular system. Peak linear acceleration in anterior, posterior, rightward, leftward, superior, and inferior directions were compared between slipping, tripping, and walking. Compared to walking, peak accelerations were up to 4.68 m/s2 higher after slipping, and up to 10.64 m/s2 higher after tripping. Head acceleration first deviated from walking 100-150ms after slip onset and 0-50ms after trip onset. The temporal characteristics of head acceleration support a possible contribution of the vestibular system to detecting trip onset, but not slip onset. Head acceleration after slipping and tripping also appeared to be sufficiently large to contribute to the balance recovery response.


Conflict of interest statement

The authors have declared that no competing interests exist.

Figures

Fig 1
Fig 1. Acceleration (m/s2) of the right vestibular organ during walking for a representative participant.
0% and 100% of gait cycle both represent heel contact of the left foot, while 50% of gait cycle represents the approximate time of heel contact of the right foot. Six complete gait cycles are displayed.
Fig 2
Fig 2. Accelerations (m/s2) of the right (thick solid line) and left (thin line) vestibular organs during a selected walking stride for a representative participant.
This figure illustrates the subtle differences in accelerations measured between right and left vestibular organs.
Fig 3
Fig 3
Head acceleration when (a) slipping (black line) and walking (gray line), and (b) tripping (black line) and walking (gray line) for a representative participant. The instant of slip and trip onset is denoted by an arrow. Head acceleration during walking is shown from left heel contact to left heel contact, and head acceleration during slipping and tripping are shown from heel contact of non-perturbed foot before perturbation (left for all participants) to subsequent heel contact of non-perturbed foot (left for all participants).
Fig 4
Fig 4. Peak head acceleration after slip onset (light grey) and heel contact during walking (white).
The top of each column and the positive error bar indicates the median value and 75% percentile, respectively, in the positive direction (anterior, right, and inferior). The bottom of each column and the negative error bar indicates the median value and 75% percentile, respectively, in the negative direction (posterior, left, and superior). * denotes significant difference between slipping and walking within the time interval (p<0.05).
Fig 5
Fig 5. Peak head acceleration after trip onset (dark grey) and mid-swing during walking (white).
The top of each column and positive error bar indicates the median value and 75% percentile, respectively, in the positive direction (anterior, right, and inferior). The bottom of each column and negative error bar indicates the median value and 75% percentile, respectively, in the negative direction (posterior, left, and superior). * denotes significant difference between tripping and walking within the time interval (p<0.05). # denotes a significant main effect of condition across all time intervals (p<0.001).

References

    1. Safety LMRIf. 2014 Liberty Mutual Workplace Safety Index. Hopkinton, MA: Liberty Mutual Research Institute for Safety, 2014.
    1. Courtney TK, Sorock GS, Manning DP, Collins JW, Holbein-Jenny MA. Occupational slip, trip, and fall-related injuries—can the contribution of slipperiness be isolated? Ergonomics. 2001;44(13):1118–37. Epub 2002/01/17. 10.1080/00140130110085538 - DOI - PubMed
    1. Lipscomb HJ, Glazner JE, Bondy J, Guarini K, Lezotte D. Injuries from slips and trips in construction. Applied ergonomics. 2006;37(3):267–74. 10.1016/j.apergo.2005.07.008 . - DOI - PubMed
    1. Amandus H, Bell J, Tiesman H, Biddle E. The epidemiology of slips, trips, and falls in a helicopter manufacturing plant. Hum Factors. 2012;54(3):387–95. . - PubMed
    1. Bell J, Collins JW, Dalsey E, Sublet V. Slip, trip, and fall prevention for healthcare workers2010.