. 2016 Nov 1;11(11):e0165781.
doi: 10.1371/journal.pone.0165781. eCollection 2016.

A New Weighted Degree Centrality Measure: The Application in an Animal Disease Epidemic

Affiliations

A New Weighted Degree Centrality Measure: The Application in an Animal Disease Epidemic

Luca Candeloro et al. PLoS One. .

Abstract

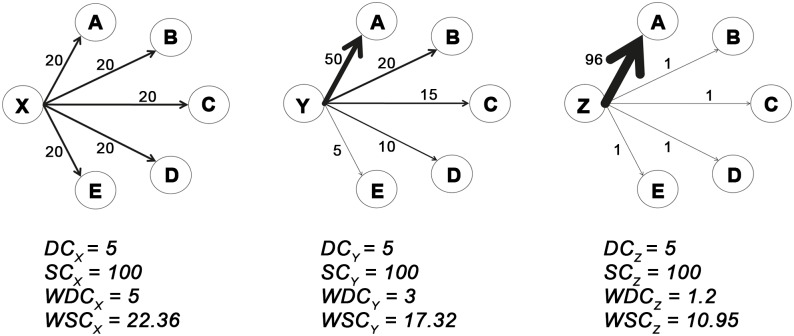
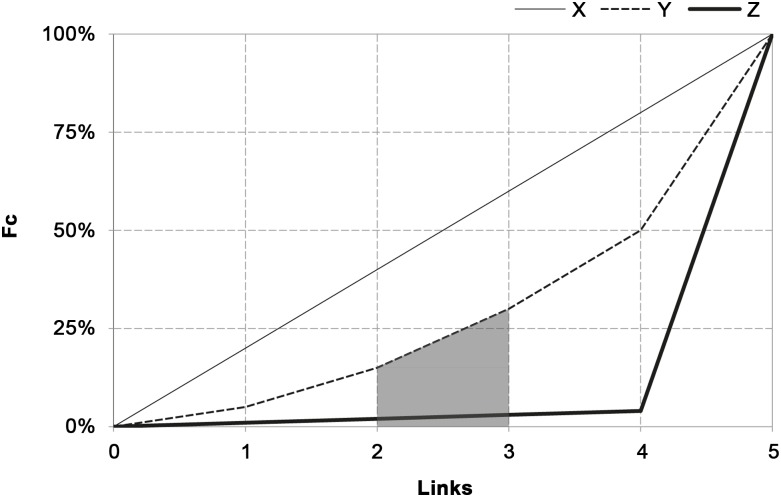
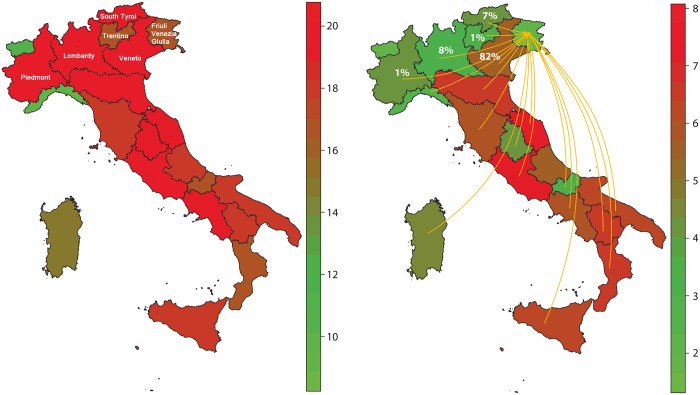
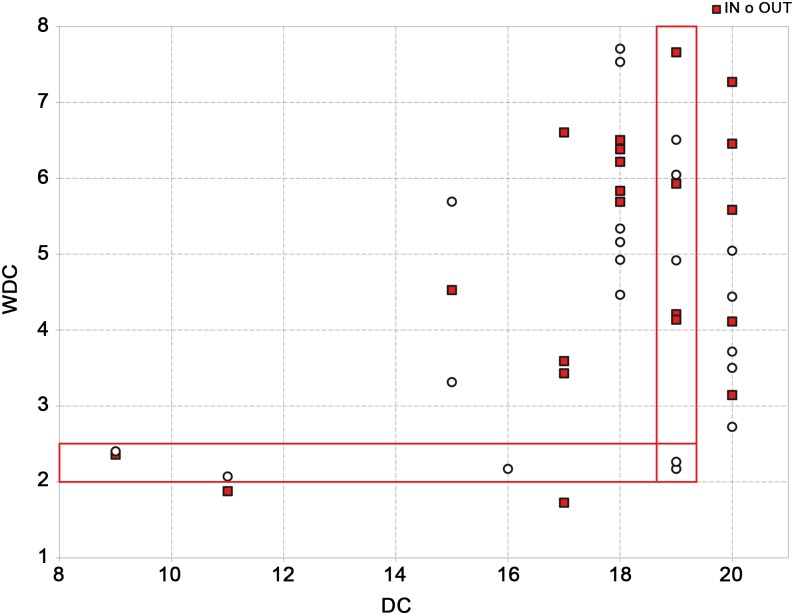
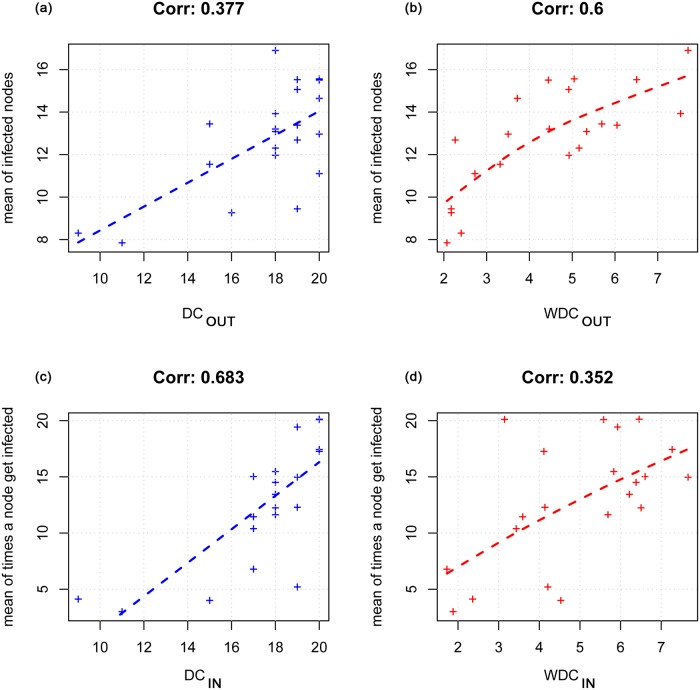
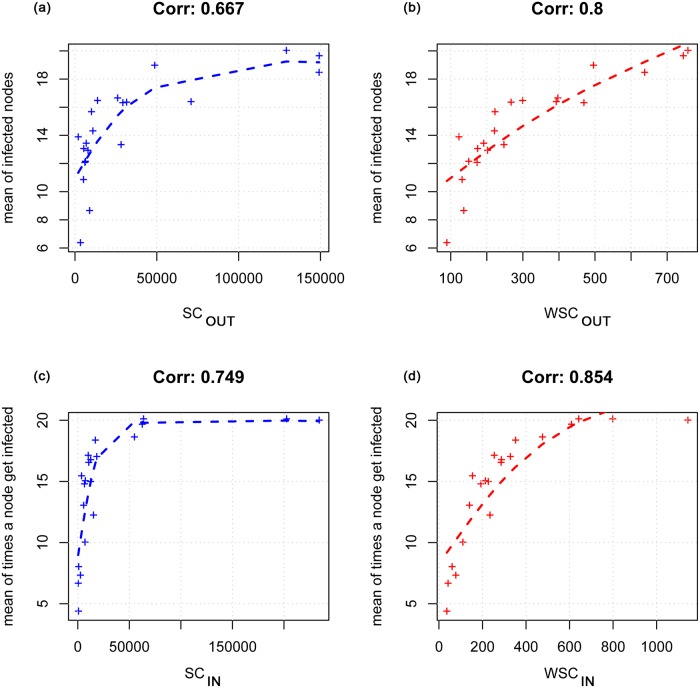
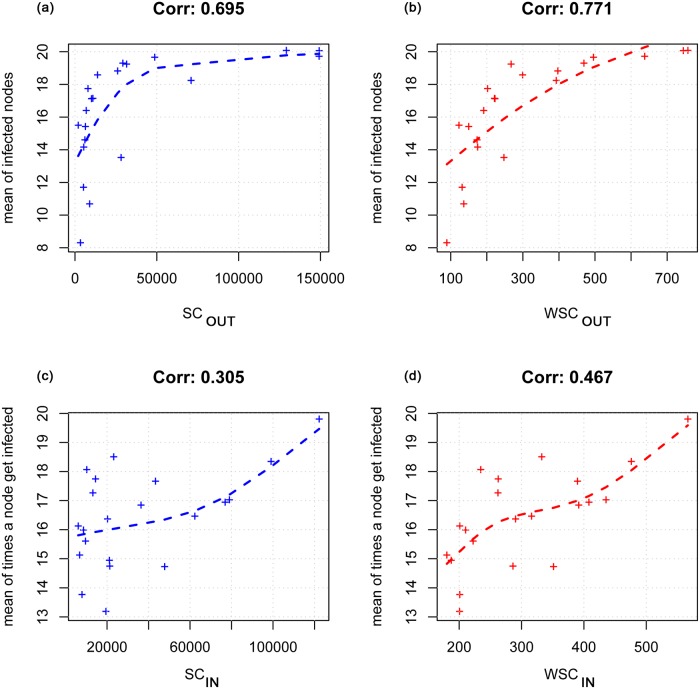
In recent years researchers have investigated a growing number of weighted heterogeneous networks, where connections are not merely binary entities, but are proportional to the intensity or capacity of the connections among the various elements. Different degree centrality measures have been proposed for this kind of networks. In this work we propose weighted degree and strength centrality measures (WDC and WSC). Using a reducing factor we correct classical centrality measures (CD) to account for tie weights distribution. The bigger the departure from equal weights distribution, the greater the reduction. These measures are applied to a real network of Italian livestock movements as an example. A simulation model has been developed to predict disease spread into Italian regions according to animal movements and animal population density. Model's results, expressed as infected regions and number of times a region gets infected, were related to weighted and classical degree centrality measures. WDC and WSC were shown to be more efficient in predicting node's risk and vulnerability. The proposed measures and their application in an animal network could be used to support surveillance and infection control strategy plans.


Conflict of interest statement

The authors have declared that no competing interests exist.

Figures

Fig 1
Fig 1. Three examples of networks where classical measures of degree and strength give same results.
Three different situations with the same DC and SC are illustrated: three focal nodes (X, Y, Z) are connected to the same number of nodes (DC = 5) with the same nodes’ strength (SC = 100). The strength of each focal node is distributed among linked nodes in different ways: uniformly (X node) or to a fewer number of nodes (case Y and Z nodes).
Fig 2
Fig 2. Empirical cumulative weights’ distribution (Fc) for nodes X, Y, Z.
Graphical representation of the Area Under the Curve AUCFc of weights relative to nodes X, Y and Z of Fig 1. The AUCFc(3), the area related to the first 3 links of Y node is highlighted in grey.
Fig 3
Fig 3. An example of weighted network and the related weighted adjacency matrix and transition matrix.
The transition matrix shows how the number of animals that come out from a node is distributed to the nodes with which it is connected.
Fig 4
Fig 4. DCIN and WDCIN values for IT2009 data.
The WDCIN (on the right) shows a more evident variability among regions than DCIN (on the left). The scale bars report the DCIN and WDCIN values for each region. In case of Friuli-Venezia-Giulia region, in the north-east part of Italy, the two measures are particularly different (DCIN = 17 and WDCIN = 1.73). Arrows representing in-going links are reported (17 regions), but only 5 regions already cover the 99% of the weights (fi values are reported on the corresponding region).
Fig 5
Fig 5. Correlation between the two measures DC and WDC of the IT2009 network.
The correlation shows a moderate agreement between DC and WDC (0.55 ‘in’ and 0.31 ‘out’). For example, in 5 regions the same value of 19 for out-degree, is associated to a weighted out degree range of 2–7 and vice-versa 5 regions with values of weighted out-degree between 2 and 2.5, have values of out-degree ranging from 9 to 19.
Fig 6
Fig 6. Correlation between simulation model results and degree centrality measures in the assumption that all nodes have the same population size.
In the upper side of the figure the correlation between the node’s risk (the mean number of infected nodes) and DCOUT (a) and WDCOUT (b) is showed; the last two graphs report the correlation between node’s vulnerability (the mean number of times a node gets infected) and the DCIN (c) and WDCIN (d).
Fig 7
Fig 7. Correlation between model results and the strength centrality measures in the assumption that real values of population and number of moved animals are adopted.
In the upper side of the figure the correlation between the node’s risk (the mean number of infected nodes) and SCOUT (a) and WSCOUT (b) is showed; the last two graphs report the correlation between node’s vulnerability (the mean number of times a node gets infected) and the SCIN (c) and WSCIN(d).
Fig 8
Fig 8. Correlation between model results and the strength centrality measures for the randomized network.
In the upper side of the figure the correlation between the node’s risk (the mean number of infected nodes) and SCOUT (a) and WSCOUT (b) is showed; the last two graphs report the correlation between node’s vulnerability (the mean number of times a node gets infected) and the SCIN (c) and WSCIN(d).

References

    1. Leinhardt S. SOCIAL NETWORKS: A DEVELOPING PARADIGM A2—Leinhardt, Samuel Social Networks. Academic Press; 1977. pp. xiii–xxxiv. Available: http://www.sciencedirect.com/science/article/pii/B9780124424500500067
    1. Karlberg M. Testing transitivity in graphs. Social Networks. 1997;19: 325–343. 10.1016/S0378-8733(97)00001-4 - DOI
    1. Wasserman S, Faust K. Social Network Analaysis, Methods and Application. Cambridge University Press; [Internet]. 1994. [cited 21 Jan 2016]. Available: http://www.cambridge.org/it/academic/subjects/sociology/series/structura...
    1. Scott J. Social Network Analysis: A Handbook. 2nd edition SAGE Publications Ltd; 2000.
    1. Barrat A, Barthelemy M, Pastor-Satorras R, Vespignani A. The architecture of complex weighted networks. Proceedings of the National Academy of Sciences of the United States of America. 2004;101: 3747–3752. 10.1073/pnas.0400087101 - DOI - PMC - PubMed

LinkOut - more resources