. 2016 Nov 1;12(11):e1005909.
doi: 10.1371/journal.ppat.1005909. eCollection 2016 Nov.

Acute Malaria Induces PD1+CTLA4+ Effector T Cells with Cell-Extrinsic Suppressor Function

Affiliations

Acute Malaria Induces PD1+CTLA4+ Effector T Cells with Cell-Extrinsic Suppressor Function

Maria Sophia Mackroth et al. PLoS Pathog. .

Abstract

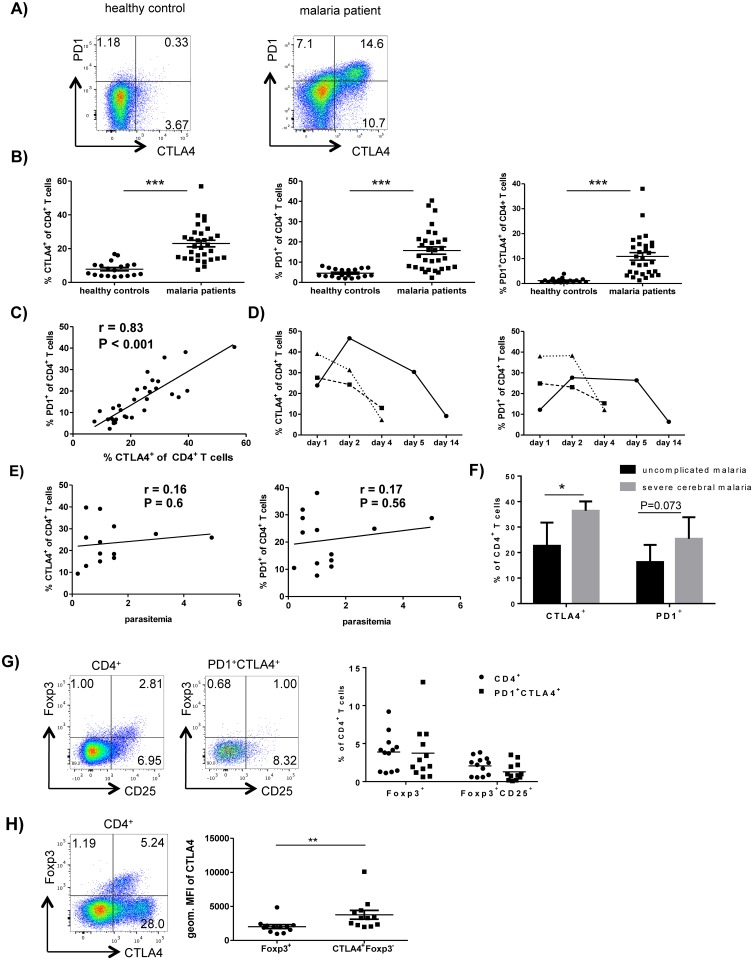
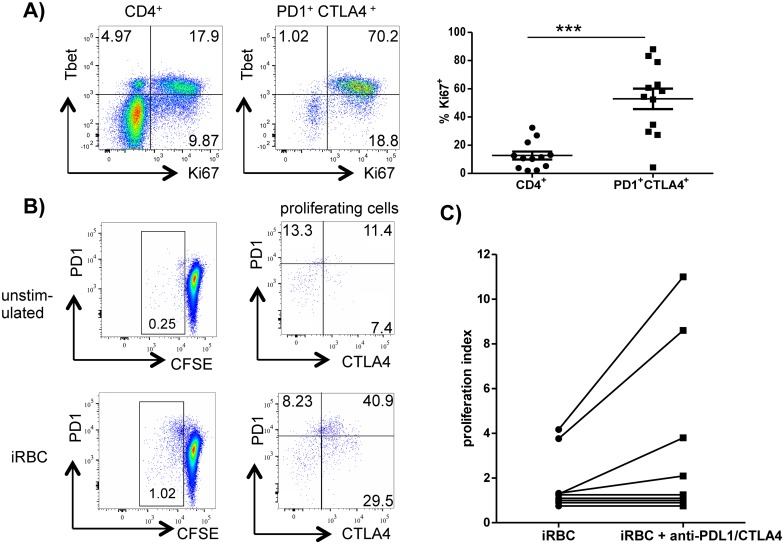
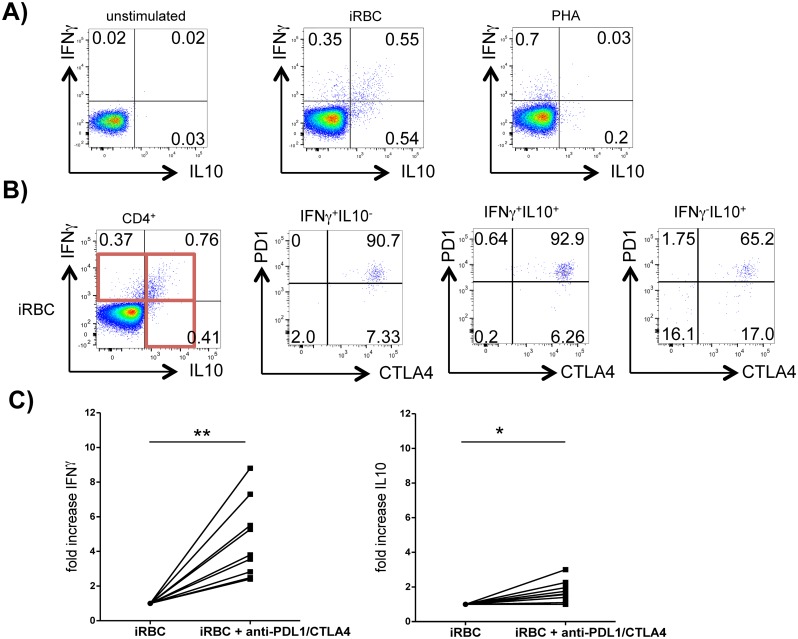
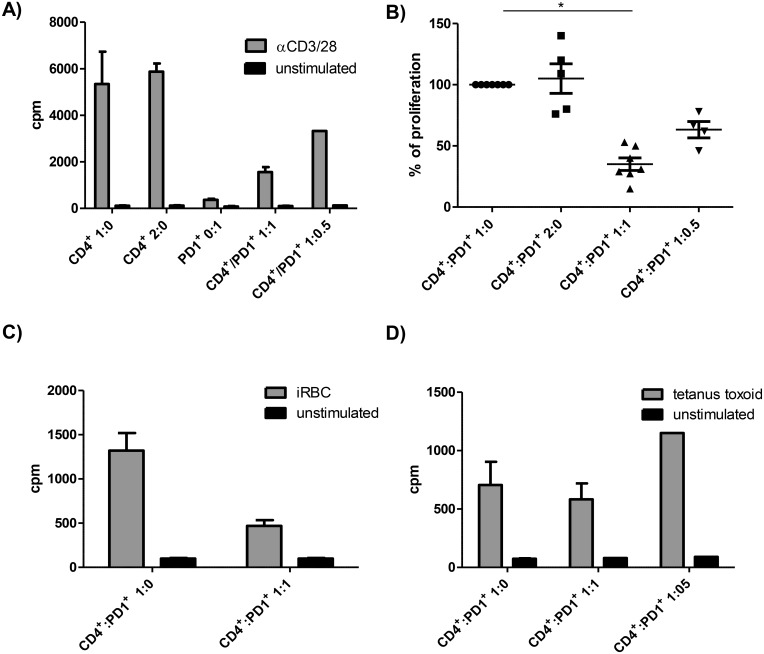
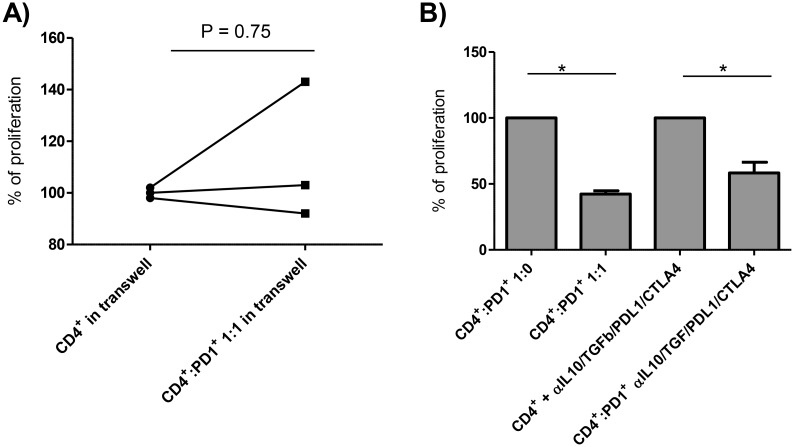
In acute Plasmodium falciparum (P. falciparum) malaria, the pro- and anti-inflammatory immune pathways must be delicately balanced so that the parasitemia is controlled without inducing immunopathology. An important mechanism to fine-tune T cell responses in the periphery is the induction of coinhibitory receptors such as CTLA4 and PD1. However, their role in acute infections such as P. falciparum malaria remains poorly understood. To test whether coinhibitory receptors modulate CD4+ T cell functions in malaria, blood samples were obtained from patients with acute P. falciparum malaria treated in Germany. Flow cytometric analysis showed a more frequent expression of CTLA4 and PD1 on CD4+ T cells of malaria patients than of healthy control subjects. In vitro stimulation with P. falciparum-infected red blood cells revealed a distinct population of PD1+CTLA4+CD4+ T cells that simultaneously produced IFNγ and IL10. This antigen-specific cytokine production was enhanced by blocking PD1/PDL1 and CTLA4. PD1+CTLA4+CD4+ T cells were further isolated based on surface expression of PD1 and their inhibitory function investigated in-vitro. Isolated PD1+CTLA4+CD4+ T cells suppressed the proliferation of the total CD4+ population in response to anti-CD3/28 and plasmodial antigens in a cell-extrinsic manner. The response to other specific antigens was not suppressed. Thus, acute P. falciparum malaria induces P. falciparum-specific PD1+CTLA4+CD4+ Teffector cells that coproduce IFNγ and IL10, and inhibit other CD4+ T cells. Transient induction of regulatory Teffector cells may be an important mechanism that controls T cell responses and might prevent severe inflammation in patients with malaria and potentially other acute infections.


Conflict of interest statement

The authors have declared that no competing interests exist.

Figures

Fig 1
Fig 1. Acute P. falciparum malaria leads to a strong induction of CTLA4 and PD1 on conventional CD4+ T cells.
A) Blood samples from acute malaria patients and healthy controls were analyzed ex-vivo for the expression of PD1 and intracellular CTLA4 on CD4+ T cells by flow cytometry. Dotplots show one representative donor out of 31 (malaria patients) or 19 (healthy controls). B) Scatter plots show the frequency of CTLA4+ (left), PD1+ (middle) and PD1+CTLA4+ cells (right) as percentage of CD4+ T cells for all analyzed donors. Horizontal bars represent means. ***, P < 0,0001 (t-test with Holm-Sidak correction for multiple comparisons). Gating strategies for CD4+ T cells and CTLA4+ and PD1+CD4+ T cells are presented in S3 Fig. C) Correlation analysis between the expression levels of PD1 and intracellular CTLA4 on CD4+ T cells for all malaria patients analyzed (N = 31). The linear regression line is shown. R = 0.83, P < 0,001 (Pearson correlation). D) Kinetics of CTLA4 (left) and PD1 (right) expression in CD4+ T cells at the time of diagnosis (day 1) and over the time-course of the malaria treatment and follow-up. Three malaria patients are shown. E) Relationship between P. falciparum parasitemia at time of diagnosis and expression of CTLA4 (left) and PD1 (right) on CD4+ T cells at the same time point. The linear regression lines are shown. R = 0.16 and R = 0.17 (Pearson correlation). F) The bar graphs shows the frequency of CTLA4+ and PD1+ cells as percentage of CD4+ T cells for donors with known uncomplicated malaria (n = 13) and severe, cerebral malaria (n = 3). *, P = 0.024 and NS, P = 0.073 (unpaired t-test). G) CD4+ T cells and PD1+CTLA4+CD4+ T cells in malaria patients were analyzed ex vivo for the expression of Foxp3 and CD25. Dotplots are shown for one representative patient. The scatter plot shows the frequency of Foxp3+ and of Foxp3+CD25+ cells as percentage of the assessed CD4+ and PD1+CTLA4+ CD4+ T cells of all patients included in this analysis (n = 12). H) The mean fluorescence intensity of CTLA4 expression was compared between Foxp3+ and Foxp3- CTLA4+ CD4+ T cells of malaria patients. The dotplot shows the expression of CTLA4 and Foxp3 on CD4+ T cells of one representative malaria patient. The scatter plot shows the geometric mean fluorescence intensity of CTLA4 of Foxp3+ and of Foxp3-CTLA4+ CD4+ T cells of all patients included in the analysis (n = 12). Horizontal bars represent means. **, P = 0.002 (paired t-test).
Fig 2
Fig 2. PD1+CTLA4+ CD4+ T cells are malaria-specific.
A) Whole blood samples of malaria patients were analyzed for ex-vivo expression of intracellular Ki67 and Tbet on CD4+ and PD1+CTLA4+CD4+ T cells. Dotplots show one representative donor out of 5. Scatter plots show the frequency of Ki67 expression on the assessed CD4+ T cells (left) and PD1+CTLA4+CD4+ T cells (right) for all malaria patients included in the analysis (N = 12). *** P < 0.001. B) PBMC of malaria patients were labeled with CFSE and stimulated with/without iRBC. Cells were first gated for CD4+ T cells. Proliferating cells were further analyzed for expression of CTLA4 and PD1. The assay is shown here for one representative malaria patient out of three. The other two patients are presented in S6 Fig. C) PBMC were stimulated with iRBC with/without the addition of 10μg/ml anti-PDL1 and anti-CTLA4 and 3H uptakes measured after 120hrs of culture. Proliferation indices were calculated by dividing 3H counts of stimulated cells by 3H counts of unstimulated cells. A proliferation index > 2 was considered to be a positive response. (n = 11).
Fig 3
Fig 3. PD1+CTLA4+CD4+ T cells coproduce IFNγ and IL10.
PBMC from patients with acute malaria were stimulated with iRBC and addition of Brefeldin A/Monensin for 18h. Stimulation without antigen (medium only) and with uninfected red blood cells (uRBC) served as negative controls. PHA was used as positive control. A) Dotplots show intracellular staining for IFNγ and IL10 in response to medium only (left), iRBC (middle) and PHA (right) after gating for CD4+ T cells. One representative donor with acute malaria out of 11 is shown. Gating strategies for cytokine production are shown in S7 Fig. B) IFNγ+ and IL10+ CD4+ T cells were further analyzed for expression of CTLA4 and PD1. One representative patient out of 11 is shown. C) PBMC were stimulated for 120hrs with iRBC and with/without addition of blocking antibodies against CTLA4 and PDL1. IL10 and IFNγ were measured in culture supernatants by ELISA. Fold-increase of cytokine production was calculated by dividing the net iRBC-specific cytokine production with blockade of CTLA4/PDL1 by net-cytokine production without antibody blockade. P = 0.004 (IFNγ) and P = 0.016 (IL10), using the Wilcoxon matched pairs test on net-cytokine concentration results.
Fig 4
Fig 4. Malaria-induced PD1+CTLA4+CD4+ T cells suppress CD4+ T cell proliferation.
Cell cultures were set up by stimulating CD4+ T cells with anti-CD3/28 (A and B), iRBCs (C) or tetanus toxoid (D) with/without addition of FACS sorted PD1+CTLA4+CD4+ T cells (ratio 1:0, 1:1, 1:0.5). 3H-Thymidine uptake was measured after 120 hrs of culture to assess cell proliferation. Cultures were performed in triplicates unless there were insufficient cells, and values represent mean + SE. A) shows the absolute proliferation counts per minute for 2.5 x 10⁴ anti-CD3/28 stimulated CD4+ T cells (ratio 1:0), 5x 10⁴ CD4+ T cells (ratio 2:0), 2.5 x 10⁴ PD1+CTLA4+CD4+ T cells (0:1) and 2.5 x 10⁴ CD4+ T cells with equal (ratio 1:1) or half the numbers (ratio 1:0.5) of PD1+CTLA4+CD4+ T cells for one representative malaria patient out of 7. Adding twice the number of CD4+ T cells, 5 x 10⁴ cells, (2:0), was included as a control condition to exclude higher cell numbers as a cause for suppressed cell proliferation. B) summarizes the results for all malaria patients included in this experiment (n = 7 for condition 1:0 and 1:1). The net (stimulated minus spontaneous) proliferation counts for 2.5 x 10⁴ CD4+ T cells (1:0), stimulated with anti-CD3/28, were set as 100%. Proliferation results for other cell culture conditions are expressed as percentage of net proliferation counts of CD4+ T cells (ratio 1:0). Statistical analysis was conducted using the Wilcoxon matched pairs test on net counts per minutes (*, P = 0.016). C and D) For antigen-specific stimulation, 105 CD4+ T cells were stimulated with equal numbers of irradiated feeder cells and with/without equal numbers of PD1+CTLA4+CD4+ T cells. The diagrams show one representative suppression assay of 2, using iRBC (C) or tetanus toxoid as specific antigen (D).
Fig 5
Fig 5. PD1+CTLA4+CD4+ T cell-mediated suppression requires cell contact.
To determine mechanisms involved in the suppression mediated by PD1+CTLA4+CD4+ T cells, we conducted suppression assays in transwell systems and in the presence of blocking antibodies for IL10R, TGFβ, CTLA4 and PDL1. The net (stimulated minus spontaneous) proliferation counts for CD4+ T cells (ratio 1:0), stimulated with anti-CD3/28, were set as 100%. Proliferation results for other cell culture conditions are expressed as percentage of net proliferation counts of CD4+ T cells (ratio 1:0). A) 5 x10⁴ CD4+ T cells were stimulated with anti-CD3/28 and cultured with/without an equal number of PD1+CTLA4+CD4+ T cells, separated by a 0.2μm transwell membrane. P = 0.75, using a Wilcoxon matched pairs test (n = 3). B) 2.5 x10⁴ CD4+ T cells were stimulated with anti-CD3/28 and cultured with/without an equal number of PD1+CTLA4+CD4+ T cells (abbreviated with PD1+) and with/without addition of 10μg/ml blocking antibodies for IL10R, TGFβ, CTLA4 and PDL1 (n = 4). *, overall P = 0.01. Statistical significance was determined using a Friedman test with Dunn´s multiple comparisons test.

References

    1. World Malaria Report. http://www.who.int/malaria/publications/world_malaria_report_2014/report...: World Health Organization, 2014.
    1. Luty AJ, Lell B, Schmidt-Ott R, Lehman LG, Luckner D, Greve B, et al. Interferon-gamma responses are associated with resistance to reinfection with Plasmodium falciparum in young African children. The Journal of infectious diseases. 1999;179(4):980–8. Epub 1999/03/09. 10.1086/314689 - DOI - PubMed
    1. Mordmuller BG, Metzger WG, Juillard P, Brinkman BM, Verweij CL, Grau GE, et al. Tumor necrosis factor in Plasmodium falciparum malaria: high plasma level is associated with fever, but high production capacity is associated with rapid fever clearance. European cytokine network. 1997;8(1):29–35. Epub 1997/03/01. - PubMed
    1. El-Assaad F, Combes V, Grau GE. Experimental Models of Microvascular Immunopathology: The Example of Cerebral Malaria. Journal of neuroinfectious diseases. 2014;5(1). Epub 2014/02/01. - PMC - PubMed
    1. Wassmer SC, Moxon CA, Taylor T, Grau GE, Molyneux ME, Craig AG. Vascular endothelial cells cultured from patients with cerebral or uncomplicated malaria exhibit differential reactivity to TNF. Cellular microbiology. 2011;13(2):198–209. Epub 2010/10/30. 10.1111/j.1462-5822.2010.01528.x - DOI - PMC - PubMed

MeSH terms

Supplementary concepts