. 2017 Dec;66(12):2069-2079.
doi: 10.1136/gutjnl-2016-312609. Epub 2016 Nov 1.

Alterations in the epithelial stem cell compartment could contribute to permanent changes in the mucosa of patients with ulcerative colitis

Affiliations

Alterations in the epithelial stem cell compartment could contribute to permanent changes in the mucosa of patients with ulcerative colitis

Isabella Dotti et al. Gut. 2017 Dec.

Abstract

Objective: UC is a chronic inflammatory disease of the colonic mucosa. Growing evidence supports a role for epithelial cell defects in driving pathology. Moreover, long-lasting changes in the epithelial barrier have been reported in quiescent UC. Our aim was to investigate whether epithelial cell defects could originate from changes in the epithelial compartment imprinted by the disease.

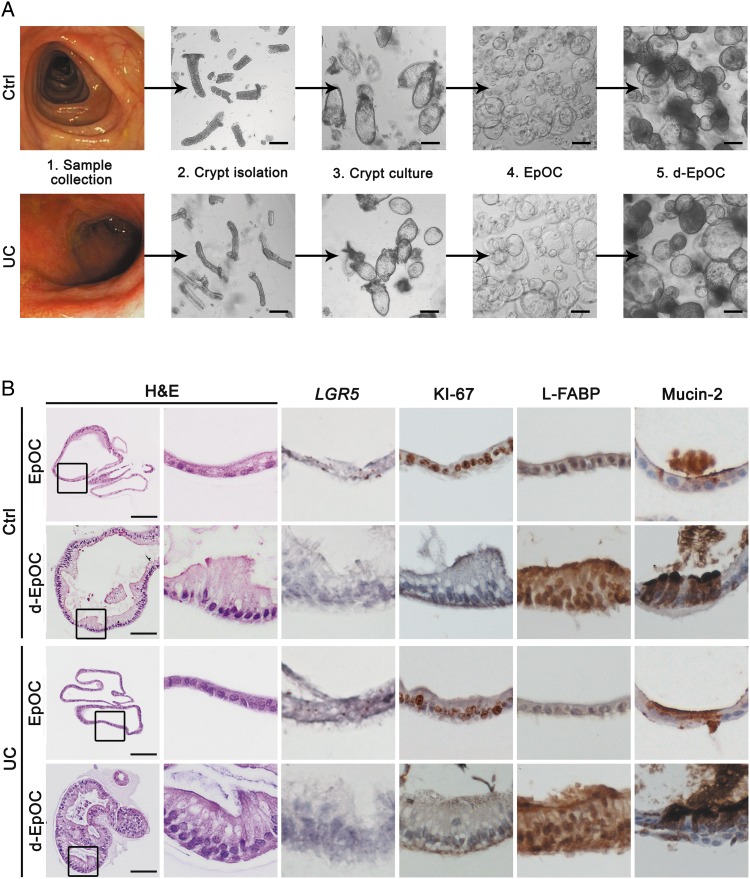
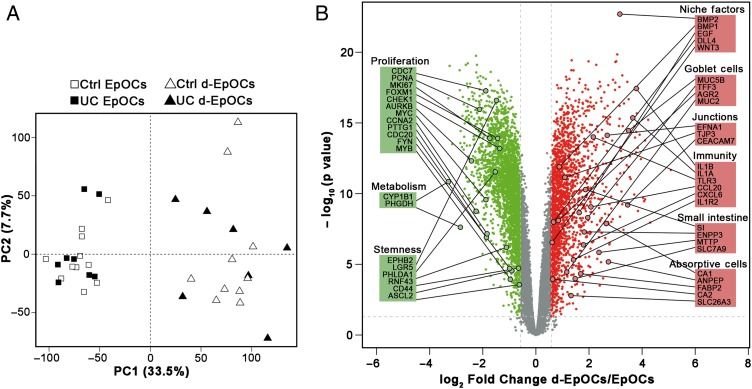
Design: Epithelial organoid cultures (EpOCs) were expanded ex vivo from the intestinal crypts of non-IBD controls and patients with UC. EpOCs were induced to differentiate (d-EpOCs), and the total RNA was extracted for microarray and quantitative real-time PCR (qPCR) analyses. Whole intestinal samples were used to determine mRNA expression by qPCR, or protein localisation by immunostaining.

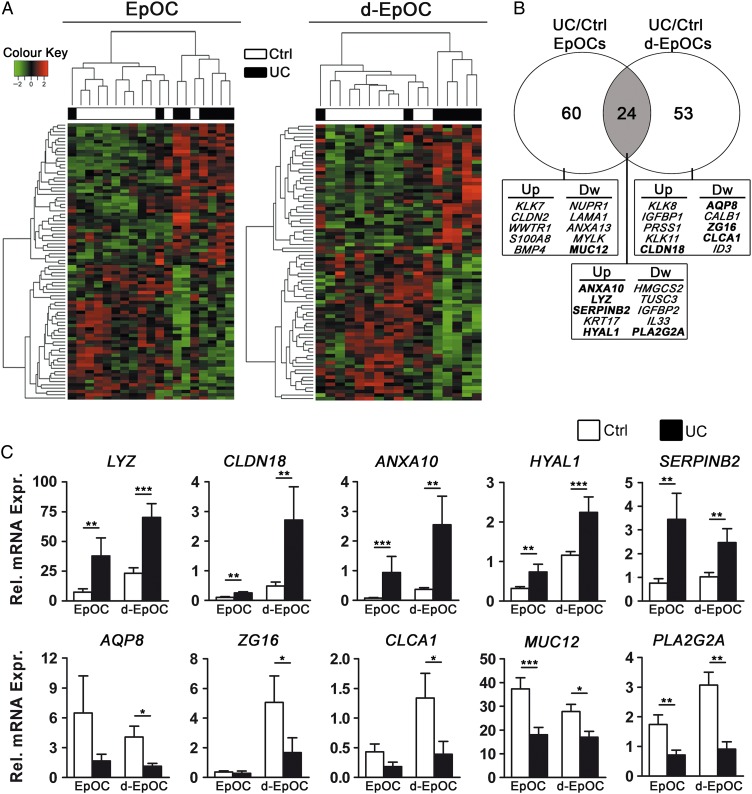
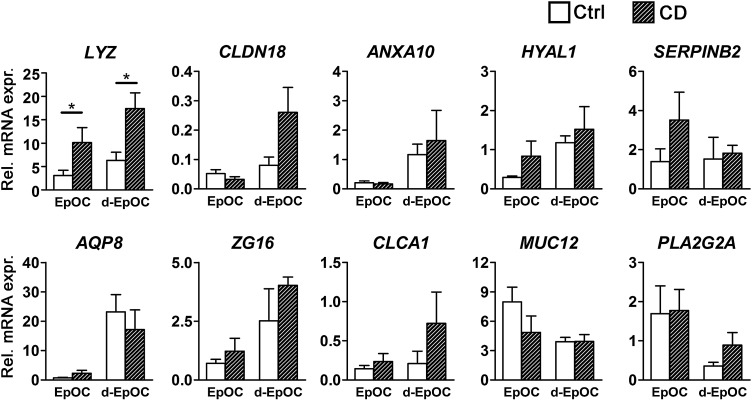
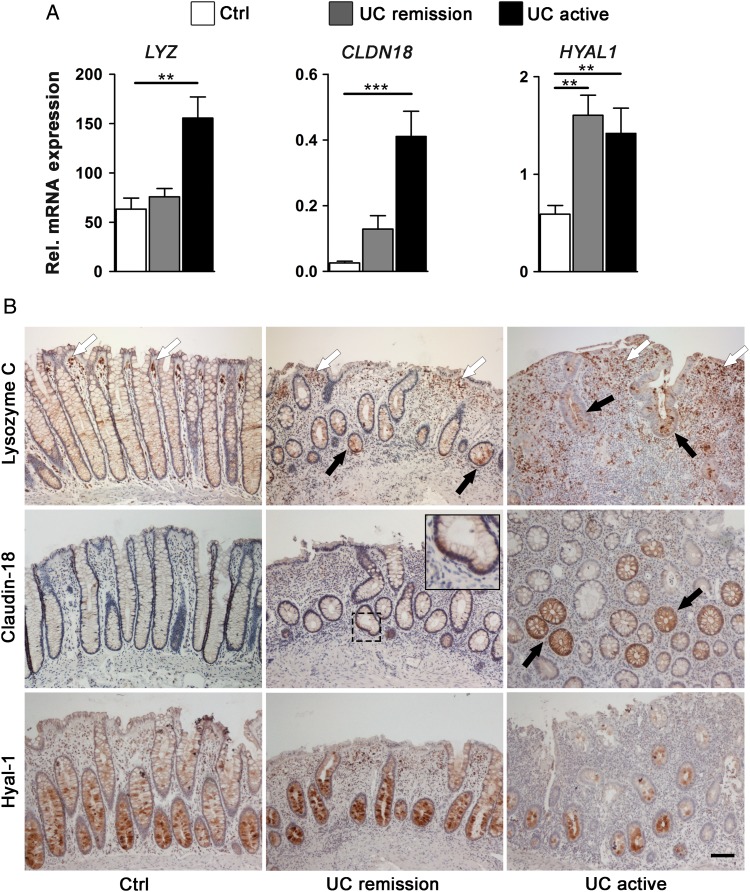
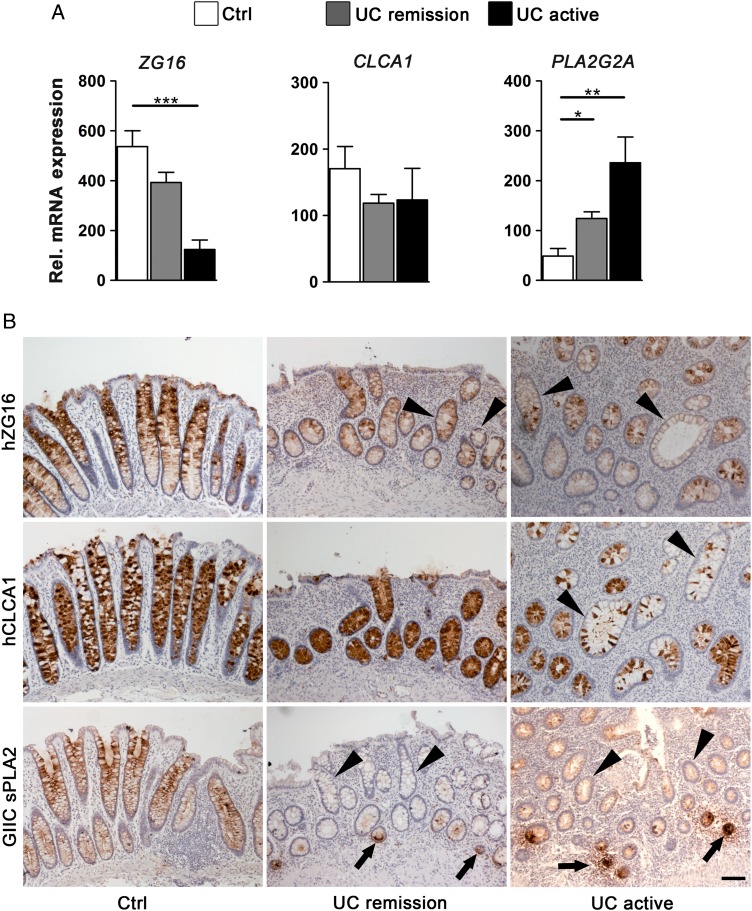
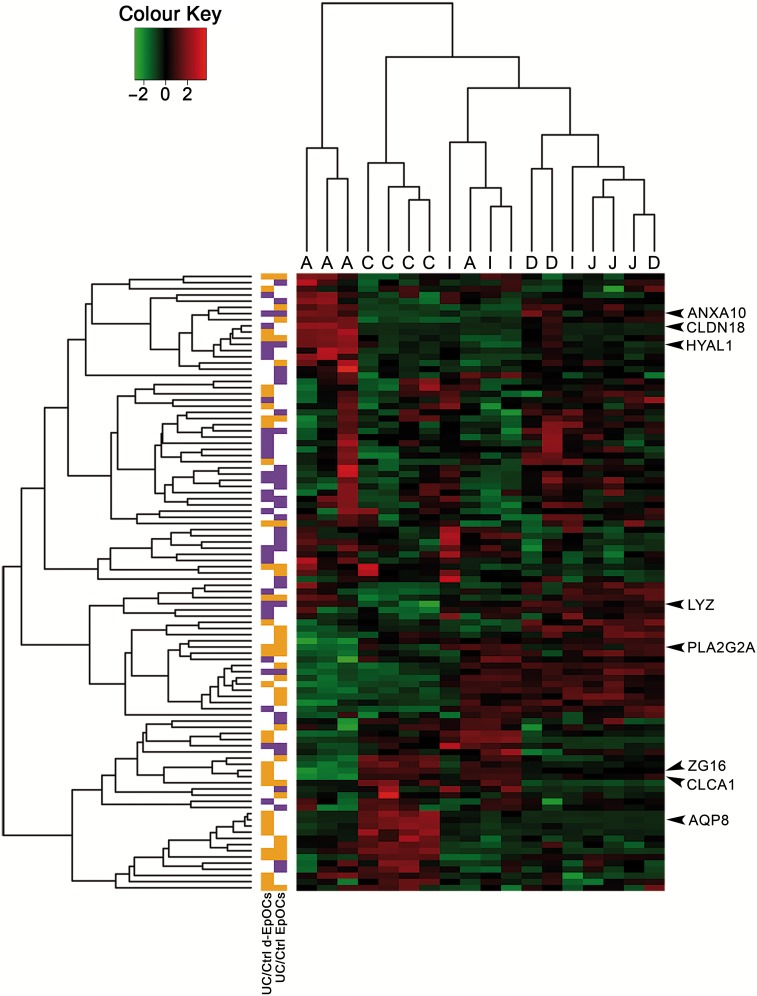
Results: EpOCs from patients with UC maintained self-renewal potential and the capability to give rise to differentiated epithelial cell lineages comparable with control EpOCs. Nonetheless, a group of genes was differentially regulated in the EpOCs and d-EpOCs of patients with UC, including genes associated with antimicrobial defence (ie, LYZ, PLA2G2A), with secretory (ie, ZG16, CLCA1) and absorptive (ie, AQP8, MUC12) functions, and with a gastric phenotype (ie, ANXA10, CLDN18 and LYZ). A high rate of concordance was found in the expression profiles of the organoid cultures and whole colonic tissues from patients with UC.

Conclusions: Permanent changes in the colonic epithelium of patients with UC could be promoted by alterations imprinted in the stem cell compartment. These changes may contribute to perpetuation of the disease.

Keywords: GENE EXPRESSION; INTESTINAL EPITHELIUM; STEM CELLS; ULCERATIVE COLITIS.


Conflict of interest statement

Competing interests: None declared.

Figures

Figure 1
Figure 1
Colonic crypts from non-IBD controls and patients with UC give rise to epithelial organoid cultures (EpOCs) in vitro. (A) Schematic representation of colonic crypt culture and expansion of EpOCs from non-IBD controls and patients with UC. Upon differentiation, EpOCs terminally differentiated into d-EpOCs within 5 days. Scale bar: 200 μm. (B) Morphological characterisation of EpOCs and differentiated EpOCs (d-EpOCs) from non-IBD controls and patients with UC. Representative H&E staining, immunochemical staining of antigen KI-67, L-FABP and mucin-2 proteins, and in situ hybridisation to detect LGR5 mRNA are shown. Scale bars: 100 μm.
Figure 2
Figure 2
Epithelial organoid cultures (EpOCs) generated from non-IBD controls and patients with UC follow comparable differentiation programmes. (A) Principal component analysis (PCA) of microarray-based genome-wide gene expression data derived from EpOCs and differentiated EpOCs (d-EpOCs) generated from non-IBD controls and patients with UC. A two-principal component plot is shown with the first component along the X-axis and the second along the Y-axis. The proportion of explained variance is shown for each component. (B) Volcano plot showing the changes in expression between d-EpOCs and EpOCs regardless of patient origin (ie, non-IBD controls or patients with UC). The log-base2 fold-change from d-EpOCs versus EpOCs is shown on the X-axis and the –log-base10 of adjusted p value on the Y-axis. Dots in green and red represent genes that are significantly downregulated or upregulated (|FC| ≥ 1.5 (log2 fold-change ≥0.58) and adjusted p value ≤0.05) in d-EpOCs compared with EpOCs, respectively. The genes with no significant expression differences are represented in grey. Several differentially expressed genes have been highlighted and grouped according to their involvement in relevant epithelial cell functions.
Figure 3
Figure 3
Differential gene expression profiles in epithelial organoid cultures (EpOCs) and differentiated EpOCs (d-EpOCs) generated from non-IBD controls compared with patients with UC. (A) Heat map representations of differentially expressed genes (p value ≤0.05 and |FC| ≥1.5) in patients with UC compared with non-IBD controls. Differentially expressed genes in EpOCs and d-EpOCs are shown separately. Each row depicts one individual probe and each column an experimental sample. High expression levels are shown in red and low expression levels in green. An unsupervised hierarchical cluster method, using a Pearson distance and average linkage method, was applied for both gene and sample classification. Samples from non-IBD controls (white, n=11 EpOCs and n=10 d-EpOCs) and patients with UC (black, n=8 EpOCs and n=7 d-EpOCs) are shown. (B) Venn diagram showing the number of genes differentially expressed between UC and non-IBD EpOCs under stem-enriched and differentiated conditions. The overlap, in grey, shows differentially expressed genes shared between the two data sets. A selection of upregulated and downregulated genes is shown (genes validated by quantitative real-time PCR (qPCR) are depicted in bold) (C) Relative mRNA levels by qPCR of selected genes found differentially expressed in the microarray analysis (samples included in the microarray analysis have been used). Messenger RNA levels are relative to ACTB expression. Mean±SEMs. *p<0.05, **p<0.01, ***p<0.001 by one-tailed Wilcoxon test.
Figure 4
Figure 4
mRNA expression analysis in Crohn's disease (CD)-derived epithelial organoid cultures (EpOCs) of genes differentially expressed in UC-derived EpOCs. The mRNA expression analysis of the selected panel of genes described in figure 3C was performed in an independent cohort of EpOCs and differentiated EpOCs (d-EpOCs) generated from sigmoid biopsies of non-IBD controls (n=6) and patients with CD (n=8). The organoid cultures were generated and analysed using the procedures described in the Methods section. Gene expression is relative to ACTB gene. Mean±SEMs. *p<0.05, **p<0.01, ***p<0.001 by one-tailed Wilcoxon test.
Figure 5
Figure 5
Epithelial cells from involved colonic UC tissue share a panel of upregulated genes with UC epithelial organoid cultures (EpOCs) and differentiated EpOCs. (A) Relative mRNA expression by quantitative real-time PCR of selected genes previously found to be overexpressed in UC compared with control EpOCs. Sigmoid mucosa biopsies from non-IBD controls (n=13) were compared with biopsies from patients with UC in remission (n=24) and with active UC (n=11). Messenger RNA levels are relative to ACTB expression. Mean±SEMs. *p<0.05, **p<0.01, ***p<0.001 by pairwise Wilcoxon test with Bonferroni–Holm correction for multiple testing. (B) Tissue immunohistochemical staining of selected genes differentially expressed in UC compared with control EpOCs. Sigmoid mucosa samples from non-IBD controls were compared with samples from patients with inactive and active UC. Black arrows indicate protein upregulation in UC epithelium compared with the control samples. White arrowheads show the expression of lysozyme C in additional cells in the lamina propria. Scale bar: 100 μm.
Figure 6
Figure 6
Epithelial cells from involved colonic UC tissue share a panel of downregulated genes with UC epithelial organoid cultures (EpOCs) and differentiated EpOCs. (A) Relative mRNA expression by quantitative real-time PCR of selected genes previously found to be downregulated in UC compared with control EpOCs. Sigmoid mucosa biopsies from non-IBD controls (n=13) were compared with biopsies from patients with UC in remission (n=24) and with active UC (n=11). Messenger RNA levels are relative to ACTB expression. Mean±SEMs. *p<0.05, **p<0.01, ***p<0.001 by pairwise Wilcoxon test with Bonferroni–Holm correction for multiple testing. (B) Tissue immunohistochemical staining of selected genes differentially expressed in UC compared with control EpOCs. Sigmoid mucosa samples from non-IBD controls were compared with samples from patients with inactive and active UC. Black arrows and black arrowheads indicate protein upregulation and downregulation in UC epithelium compared with non-IBD controls, respectively. Scale bar: 100 μm.
Figure 7
Figure 7
Epithelial organoid cultures (EpOCs) and differentiated EpOCs (d-EpOCs) from patients with UC adopt expression characteristics of the upper GI tract. Heat map representation of the expression of genes identified in the UC-derived EpOCs shown in figure 3A and B in a set of biopsy samples originating from different segments of the GI tract (C: colon; I: ileum; J: jejunum; D: duodenum; A: antrum). Each row shows one individual probe and each column an experimental sample. High expression levels are shown in red and low expression levels in green. An unsupervised hierarchical cluster method, using a Pearson distance and average linkage method, was applied for both gene and sample classification. In the left columns, genes upregulated or downregulated in UC versus non-IBD control organoid cultures are shown in purple or orange, respectively.

Comment in

References

    1. Ordás I, Eckmann L, Talamini M, et al. . Ulcerative colitis. Lancet 2012;380:1606–19. 10.1016/S0140-6736(12)60150-0 - DOI - PubMed
    1. Johansson ME, Gustafsson JK, Holmén-Larsson J, et al. . Bacteria penetrate the normally impenetrable inner colon mucus layer in both murine colitis models and patients with ulcerative colitis. Gut 2014;63:281–91. 10.1136/gutjnl-2012-303207 - DOI - PMC - PubMed
    1. Mowat AM, Agace WW. Regional specialization within the intestinal immune system. Nat Rev Immunol 2014;14:667–85. 10.1038/nri3738 - DOI - PubMed
    1. Vermeulen L, Snippert HJ. Stem cell dynamics in homeostasis and cancer of the intestine. Nat Rev Cancer 2014;14:468–80. 10.1038/nrc3744 - DOI - PubMed
    1. Vereecke L, Beyaert R, van Loo G. Enterocyte death and intestinal barrier maintenance in homeostasis and disease. Trends Mol Med 2011;17:584–93. 10.1016/j.molmed.2011.05.011 - DOI - PubMed

Publication types