. 2016 Nov;26(11):1612-1625.
doi: 10.1101/gr.201863.115. Epub 2016 Oct 18.

An integrated metagenomics pipeline for strain profiling reveals novel patterns of bacterial transmission and biogeography

Affiliations

An integrated metagenomics pipeline for strain profiling reveals novel patterns of bacterial transmission and biogeography

Stephen Nayfach et al. Genome Res. 2016 Nov.

Abstract

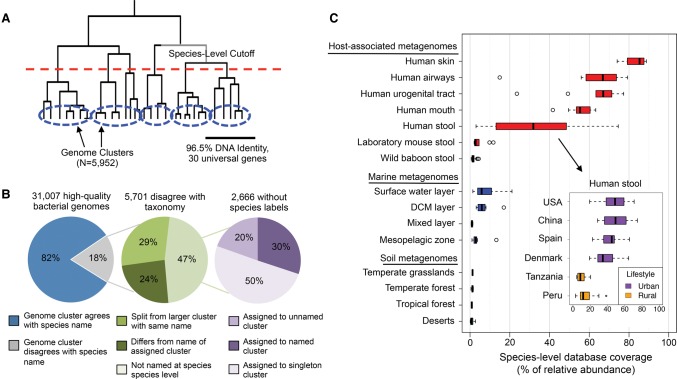
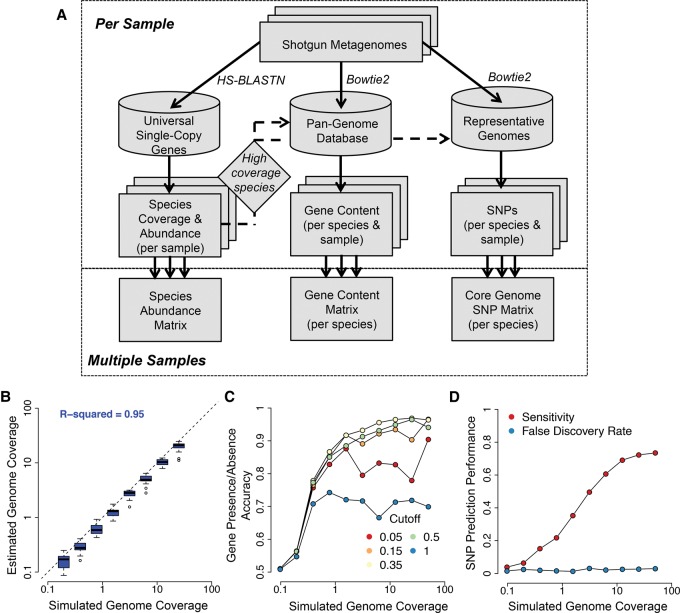
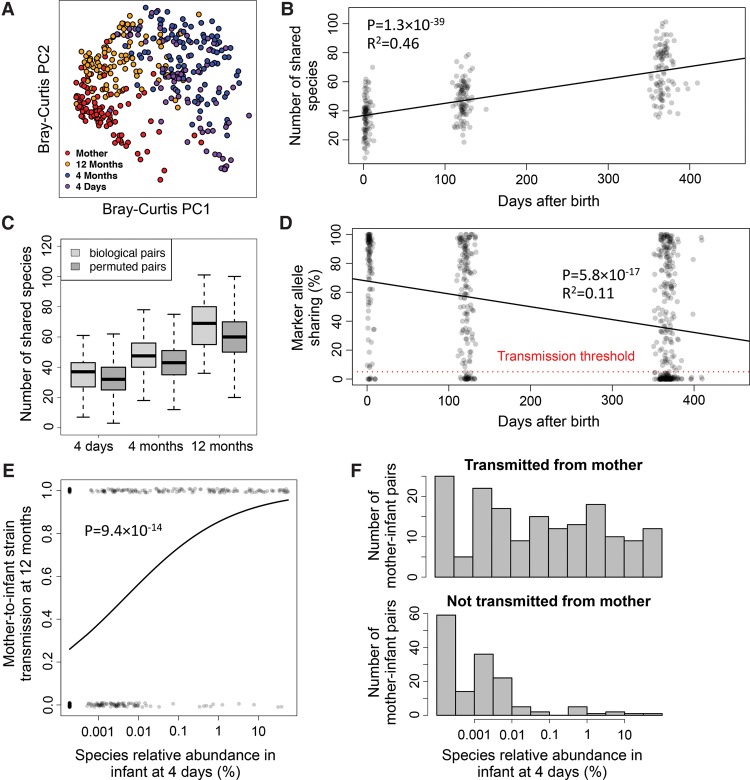
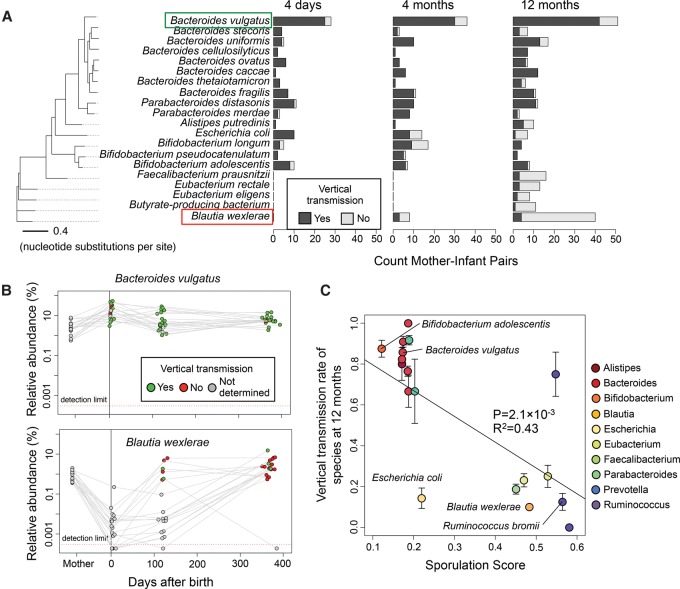
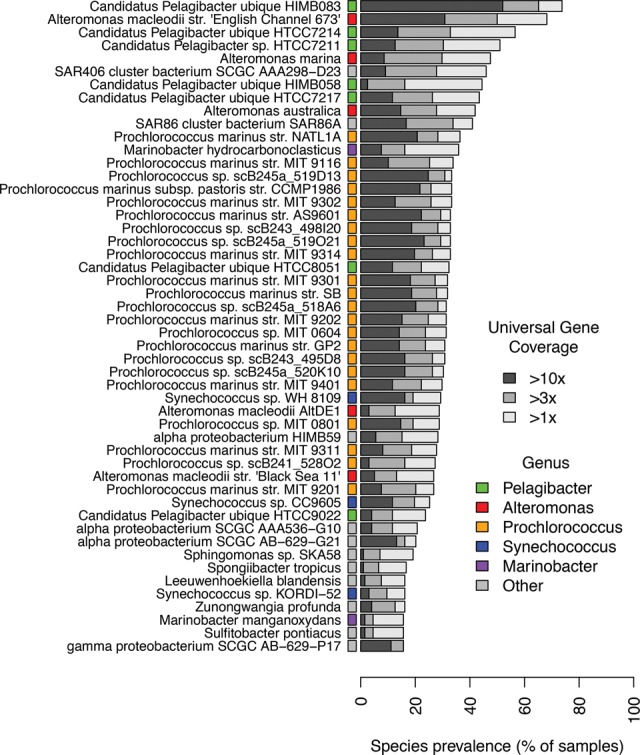
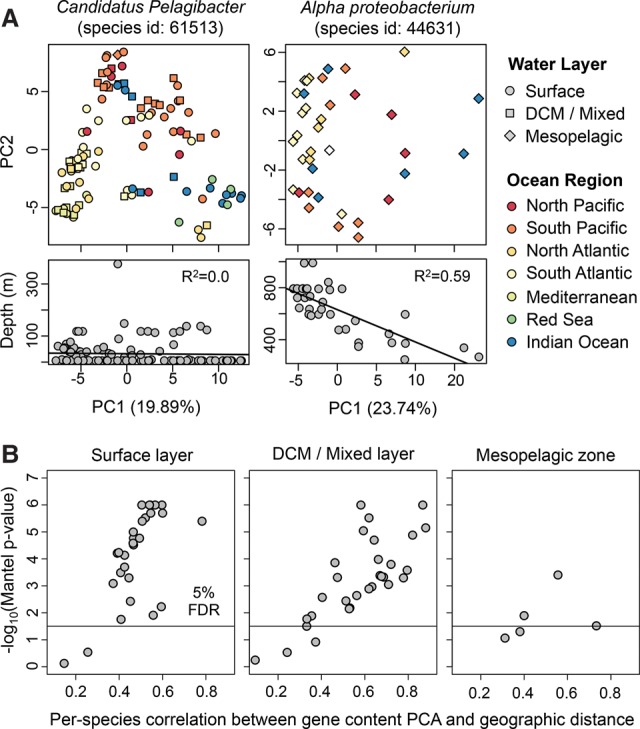
We present the Metagenomic Intra-species Diversity Analysis System (MIDAS), which is an integrated computational pipeline for quantifying bacterial species abundance and strain-level genomic variation, including gene content and single-nucleotide polymorphisms (SNPs), from shotgun metagenomes. Our method leverages a database of more than 30,000 bacterial reference genomes that we clustered into species groups. These cover the majority of abundant species in the human microbiome but only a small proportion of microbes in other environments, including soil and seawater. We applied MIDAS to stool metagenomes from 98 Swedish mothers and their infants over one year and used rare SNPs to track strains between hosts. Using this approach, we found that although species compositions of mothers and infants converged over time, strain-level similarity diverged. Specifically, early colonizing bacteria were often transmitted from an infant's mother, while late colonizing bacteria were often transmitted from other sources in the environment and were enriched for spore-formation genes. We also applied MIDAS to 198 globally distributed marine metagenomes and used gene content to show that many prevalent bacterial species have population structure that correlates with geographic location. Strain-level genetic variants present in metagenomes clearly reveal extensive structure and dynamics that are obscured when data are analyzed at a coarser taxonomic resolution.


Figures

Figure 1.
Figure 1.
Construction of bacterial species database and its coverage of microbial communities across different environments. (A) In total, 31,007 genomes were hierarchically clustered based on the pairwise identity across a panel of 30 universal gene families. We identified 5952 species groups by applying a 96.5% nucleotide identity cutoff across universal genes, which is equivalent to 95% identity genome-wide. (B) Concordance of genome-cluster names and annotated species names. Of the 31,007 genomes assigned to a genome cluster, 5701 (18%) disagreed with the consensus PATRIC taxonomic label of the genome cluster. Most disagreements are due to genomes lacking annotation at the species level (47%). Other disagreements are because a genome was split from a larger cluster with the same name (29%) or assigned to a genome cluster with a different name (24%). (C) Coverage of the species database across metagenomes from host-associated, marine, and terrestrial environments. Coverage is defined as the percentage (0%–100%) of genomes from cellular organisms in a community that have a sequenced representative at the species level in the reference database. The inset shows the distribution of database coverage across human stool metagenomes from six countries and two host lifestyles.
Figure 2.
Figure 2.
An integrated pipeline for profiling species abundance and strain-level genomic variation from metagenomes. (A) The MIDAS analysis pipeline. Reads are first aligned to a database of universal-single-copy genes to estimate species coverage and relative abundance per sample. For species with sufficient coverage, reads are next aligned to a pan-genome database of genes to estimate gene coverage, copy number, and presence–absence. Finally, reads are aligned to a representative genome database to detect SNPs in the core genome. The core genome is defined directly from the data by identifying high-coverage regions across multiple metagenomic samples. (B–D) To evaluate performance for each component of MIDAS, we analyzed 20 mock metagenomes composed of 100-bp Illumina reads from microbial genome-sequencing projects. Each community contained 20 organisms with exponentially decreasing relative abundance. We tested the ability of MIDAS to estimate species coverage and to predict genes and SNPs present in the strains of the mock communities compared to the reference gene and genome databases. (B) Species coverage is accurately estimated. Each boxplot indicates the distribution of estimated genome coverages across 20 mock communities for the top eight most abundant species out of 20 analyzed. (C) Gene presence–absence is accurately predicted when genome coverage is above 1×, and a gene copy number cutoff of 0.35 is used. Accuracy = (Sensitivity + Specificity)/2; Sensitivity = (number of genes correctly predicted as present)/(number of total genes present); Specificity = (number of genes correctly predicted as absent)/(number of total genes absent). (D) SNPs are detected with a low false-discovery rate and good sensitivity when genome coverage is above 10×. Sensitivity = (number of correctly called SNPs)/(number of total SNPs); False Discovery Rate = (number of incorrectly called SNPs)/(number of called SNPs).
Figure 3.
Figure 3.
An increase in shared species but a decrease in shared strains over time between stool metagenomes from mothers and their infants. (A) Principal coordinate analysis of Bray-Curtis dissimilarity between species relative abundance profiles of stool samples from mothers and infants at 4 d, 4 mo, and 12 mo following birth. Species composition of infant microbiomes is most similar to mothers at 12 mo. (B) The number of shared species increases over time between mothers and their own infants. (C) This pattern for biological mother–infant pairs is similar to that of unrelated mothers and infants (permuted pairs). (D) In contrast, marker allele sharing decreases over time between mothers and their infants for shared species with greater than 10× sequencing coverage, indicating highest strain similarity at 4 d. Allele sharing is defined as the percentage of marker alleles in the mother that are found in the infant. The horizontal red dotted line indicates the 5% marker allele threshold used for defining vertical transmission events. (E) Early colonizing species are transmitted vertically, whereas late colonizing species are not. The horizontal axis indicates the relative abundance of bacterial species at 4 d. The vertical axis indicates whether a strain of the species was transmitted from the mother (y = 1) or not (y = 0) at 12 mo. The curve is a logistic regression fitted to data points. (F) Histograms indicate the distribution of relative abundance at 4 d for strains that were transmitted and not transmitted from an infant's mother.
Figure 4.
Figure 4.
Distinct timing and vertical transmission patterns for microbiome species. (A) Vertical transmissions for bacterial species across mother–infant pairs at three time points. The 20 species with the greatest number of high-coverage mother–infant pairs are shown. A vertical transmission is defined as >5% marker allele sharing between mother and infant. The phylogenetic tree is constructed based on a concatenated DNA alignment of 30 universal genes (Supplemental Fig. S3) and shows that phylogenetically related species have similar transmission patterns. (B) Bacteroides vulgatus is an early colonizing species that is frequently transmitted vertically, whereas Blautia wexlerae is a late colonizing species that is rarely transmitted vertically. Gray points indicate there was insufficient sequencing coverage to quantify SNPs and determine transmission. (C) Species with low vertical transmission rates are predicted to be spore-formers with the ability to survive in the environment. Sporulation scores are genomic signatures of sporulation based on 66 genes (Browne et al. 2016). Error bars indicate one standard error in each direction. Only species with sporulation scores computed by Browne et al. (2016) and with three or more mother–infant pairs at 12 mo are shown.
Figure 5.
Figure 5.
Prevalent bacterial species surveyed by the Tara Oceans expedition. Prevalence of 50 bacterial species across 198 ocean metagenomes. Latin names of species are indicated on the vertical axis. In cases in which multiple species had the same Latin name, the full name of the representative genome is shown. Many marine species have sufficient sequencing depth and prevalence for population-genetic analyses.
Figure 6.
Figure 6.
Gene content and geography are correlated for many marine bacteria. (A) Principal component analysis (PCA) of gene content for two bacterial species. Each point indicates a bacterial population from a different seawater sample. Point color and shape indicate the marine region and water layer, respectively. Candidatus Pelagibacter populations tend to cluster together based on ocean region, not ocean depth. In contrast, Alpha proteobacterium populations tend to cluster together based on ocean depth, not ocean region. (B) Gene content PCA and geographic distance are significantly correlated for most prevalent marine species. PCA distance was calculated using the Euclidian distance between PC1 and PC2 of the gene presence–absence matrix. Geographic distance was calculated using the great-circle distance between sampling locations. For each species, the correlation of these two distances (horizontal axis) and associated P-value (vertical axis) were computed using the Mantel test with 1 million permutations. Only one metagenome per location was included in the tests. The population structure of marine bacteria, based on the first two principal components of gene content, is correlated with geography for many species of bacteria.

References

    1. Altschul SF, Gish W, Miller W, Myers EW, Lipman DJ. 1990. Basic local alignment search tool. J Mol Biol 215: 403–410. - PubMed
    1. Ashburner M, Ball CA, Blake JA, Botstein D, Butler H, Cherry JM, Davis AP, Dolinski K, Dwight SS, Eppig JT, et al. 2000. Gene ontology: tool for the unification of biology. Nat Genet 25: 25–29. - PMC - PubMed
    1. Backhed F, Roswall J, Peng Y, Feng Q, Jia H, Kovatcheva-Datchary P, Li Y, Xia Y, Xie H, Zhong H, et al. 2015. Dynamics and stabilization of the human gut microbiome during the first year of life. Cell Host Microbe 17: 690–703. - PubMed
    1. Bokulich NA, Chung J, Battaglia T, Henderson N, Jay M, Li H, Lieber AD, Wu F, Perez-Perez GI, Chen Y, et al. 2016. Antibiotics, birth mode, and diet shape microbiome maturation during early life. Sci Transl Med 8: 343ra382. - PMC - PubMed
    1. Browne HP, Forster SC, Anonye BO, Kumar N, Neville BA, Stares MD, Goulding D, Lawley TD. 2016. Culturing of ‘unculturable’ human microbiota reveals novel taxa and extensive sporulation. Nature 533: 543–546. - PMC - PubMed

Publication types

MeSH terms