. 2016 Nov 15;113(46):13015-13020.
doi: 10.1073/pnas.1611228113. Epub 2016 Nov 1.

Structural basis for DNA recognition by STAT6

Affiliations

Structural basis for DNA recognition by STAT6

Jing Li et al. Proc Natl Acad Sci U S A. .

Abstract

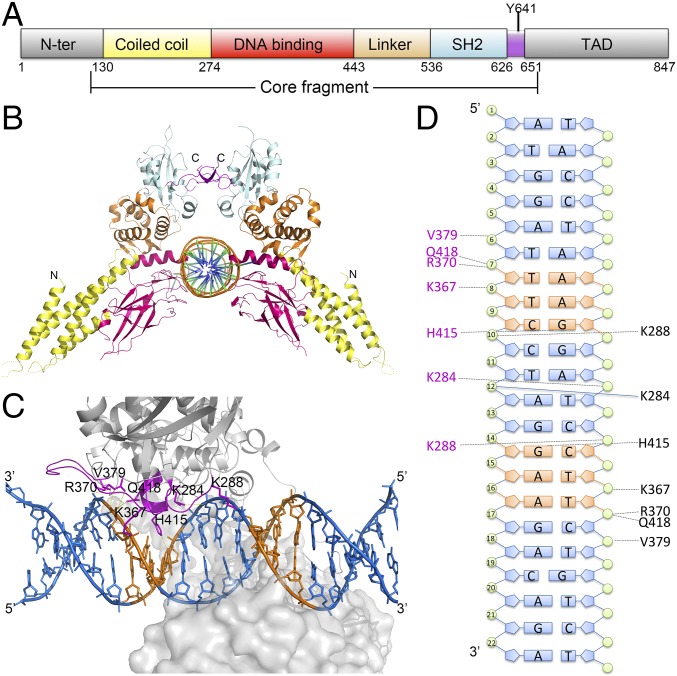
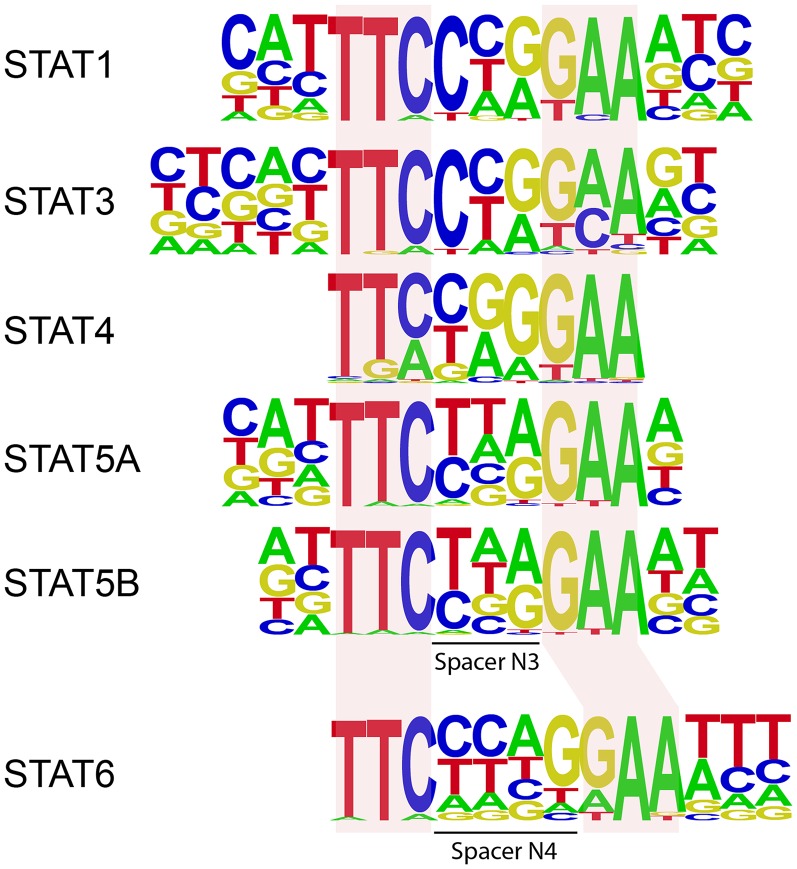
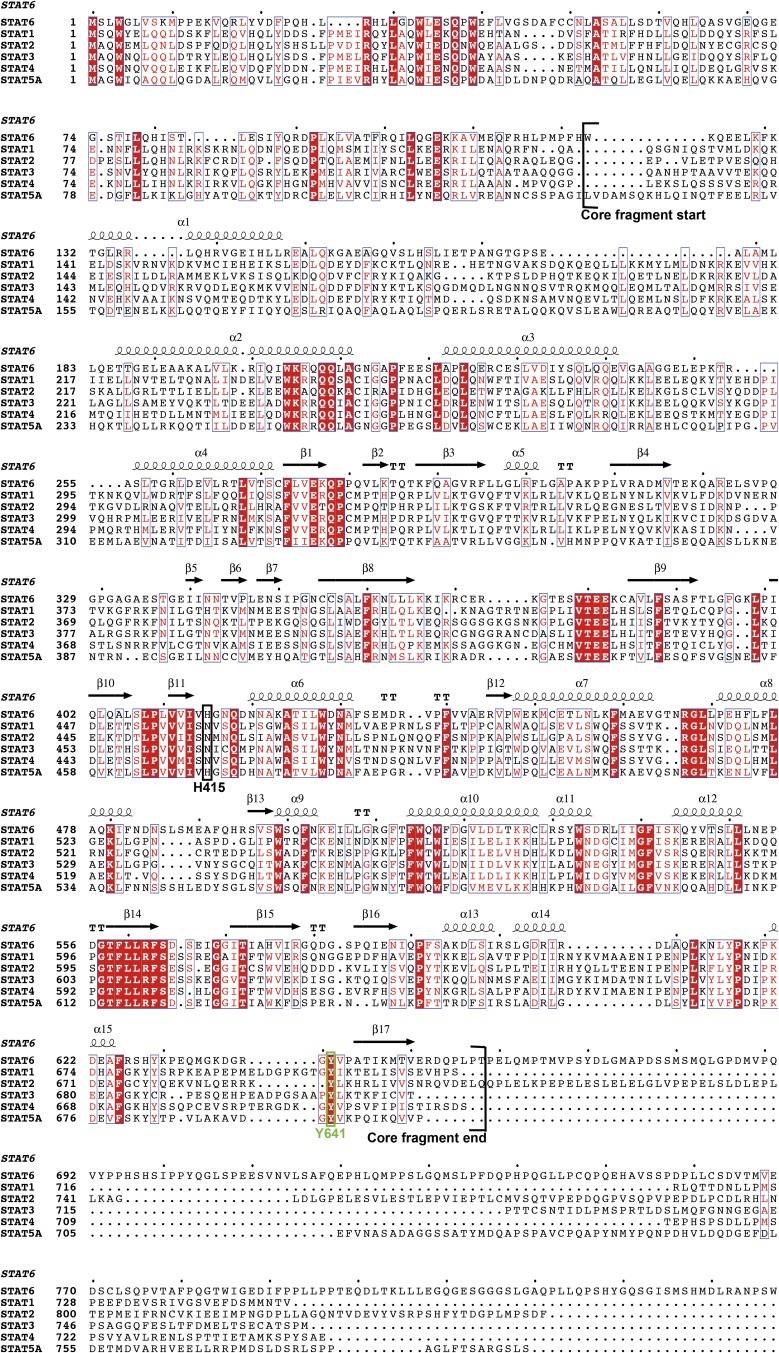
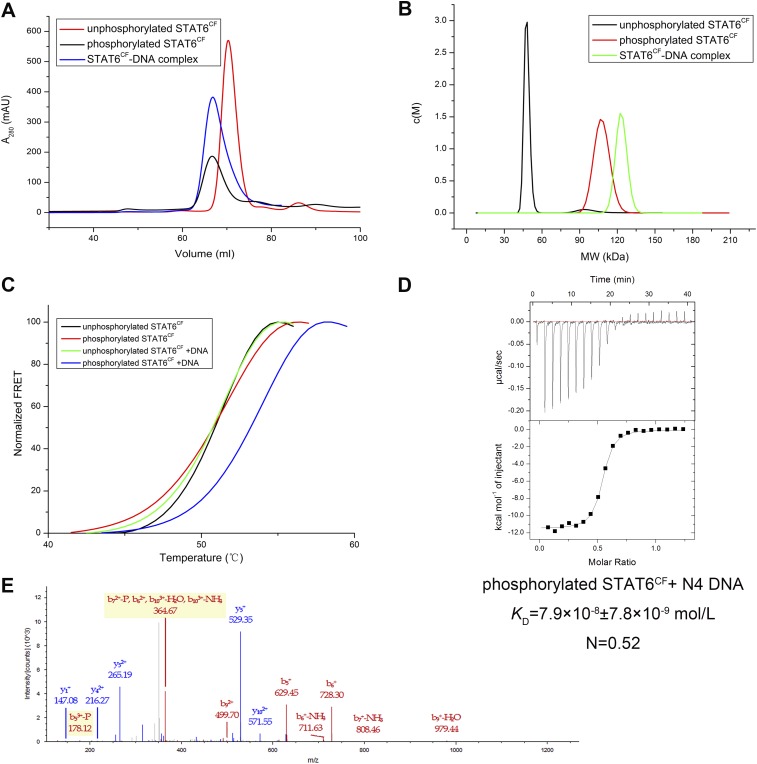
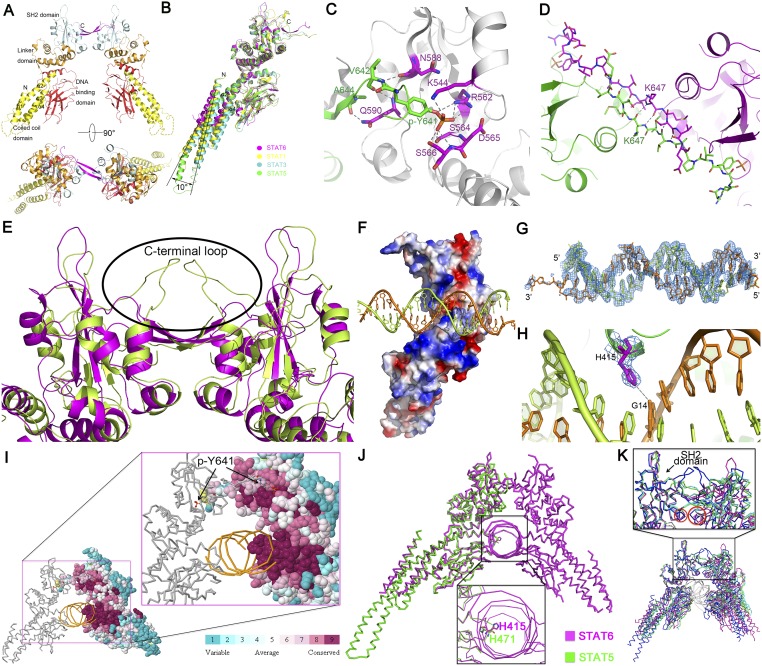
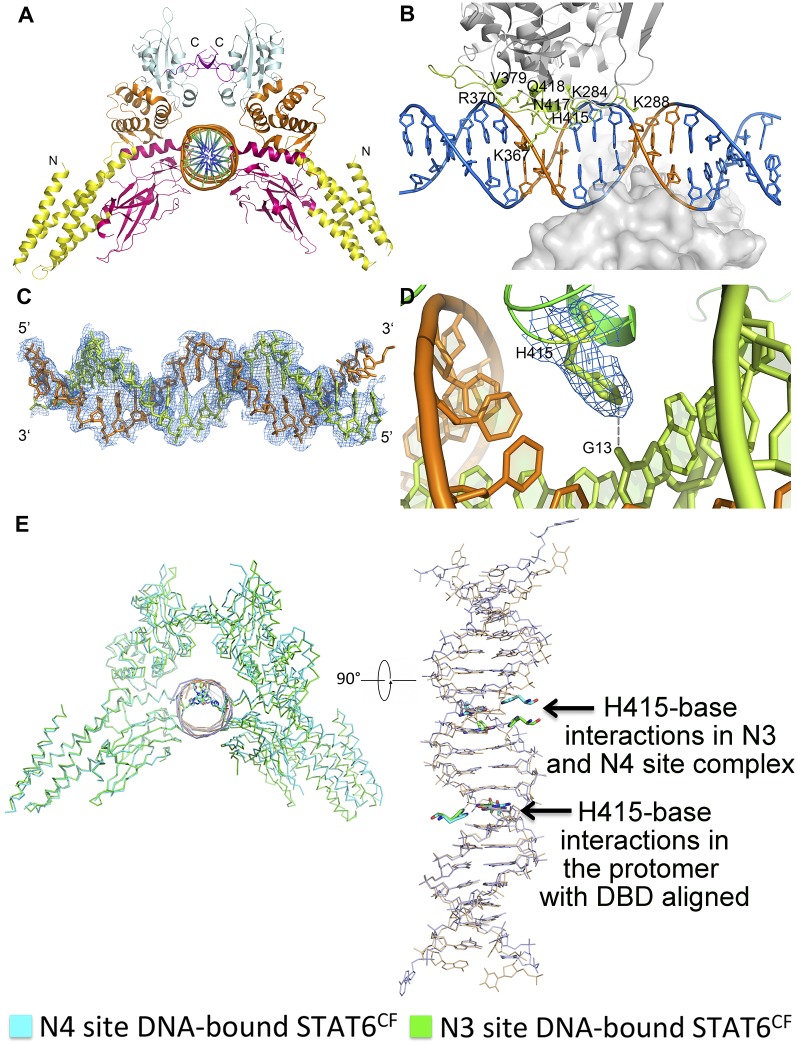
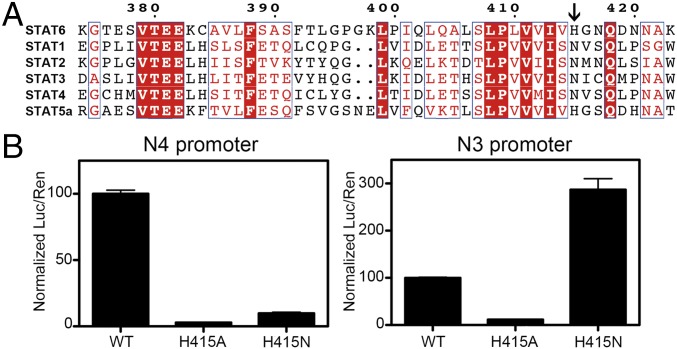
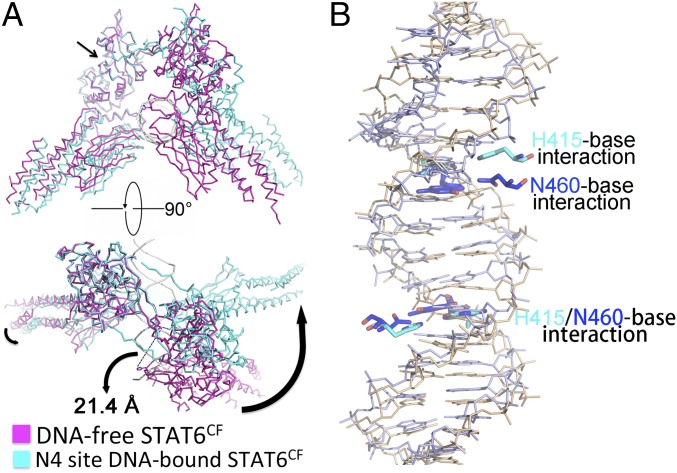
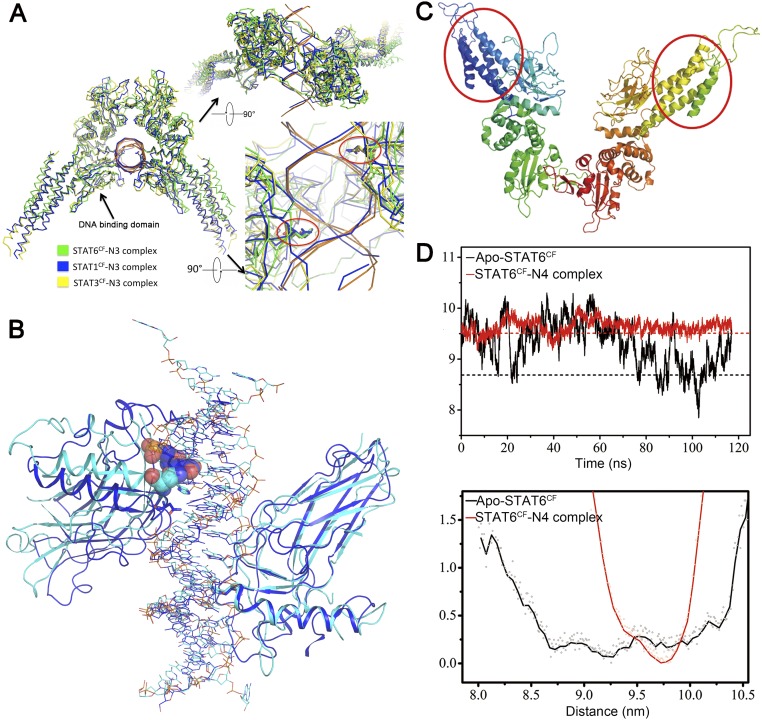
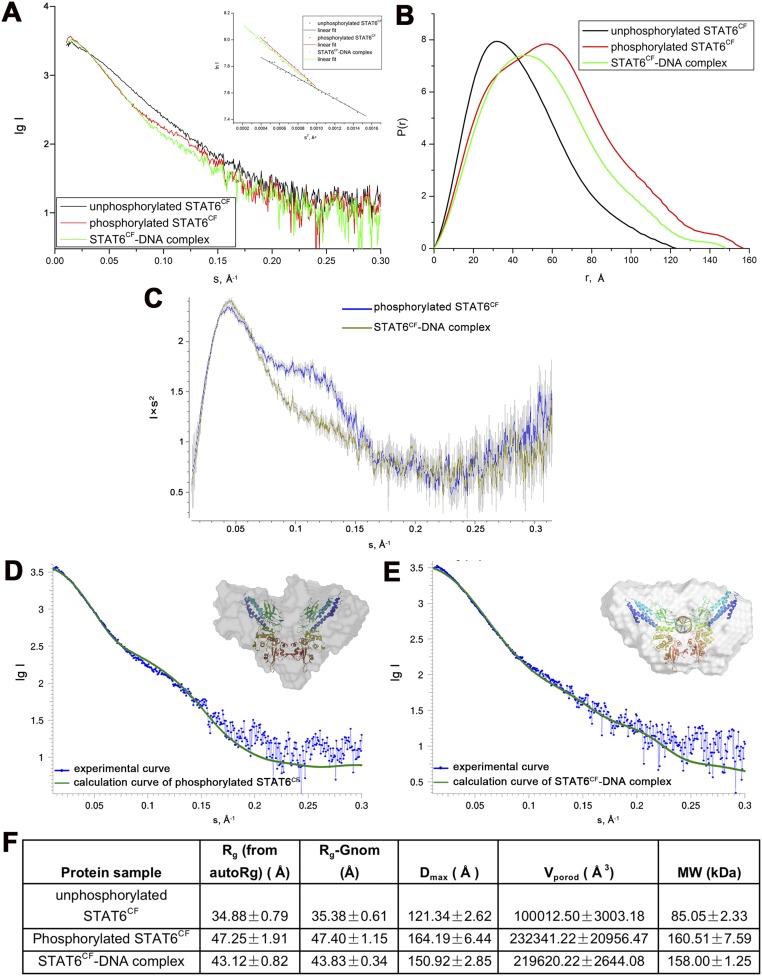
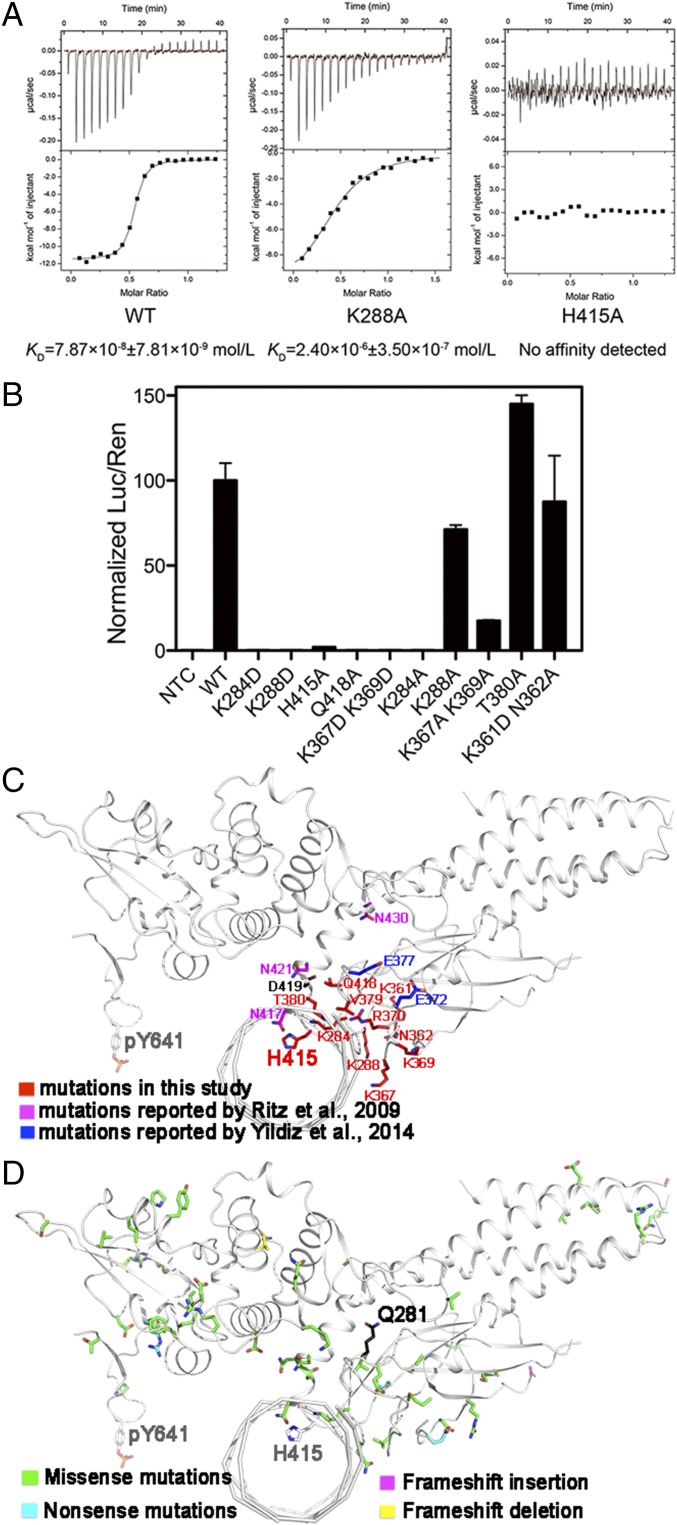
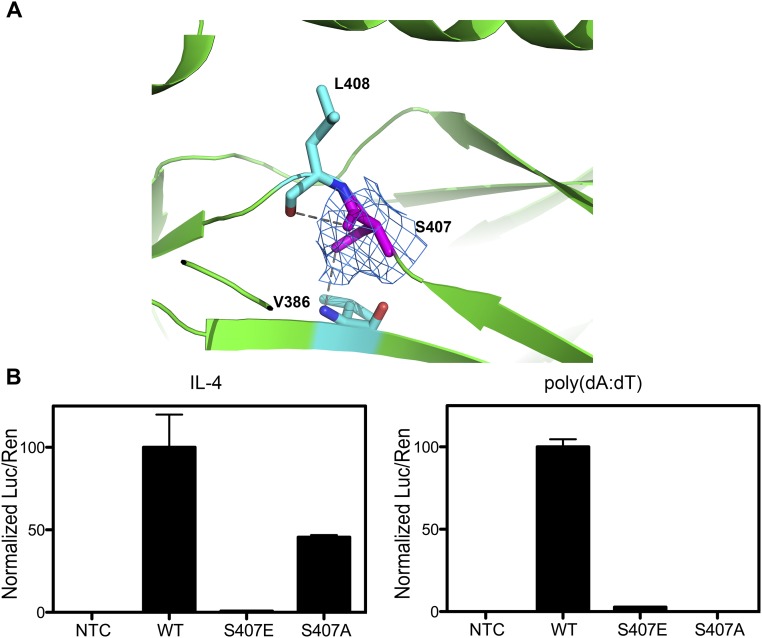
STAT6 participates in classical IL-4/IL-13 signaling and stimulator of interferon genes-mediated antiviral innate immune responses. Aberrations in STAT6-mediated signaling are linked to development of asthma and diseases of the immune system. In addition, STAT6 remains constitutively active in multiple types of cancer. Therefore, targeting STAT6 is an attractive proposition for treating related diseases. Although a lot is known about the role of STAT6 in transcriptional regulation, molecular details on how STAT6 recognizes and binds specific segments of DNA to exert its function are not clearly understood. Here, we report the crystal structures of a homodimer of phosphorylated STAT6 core fragment (STAT6CF) alone and bound with the N3 and N4 DNA binding site. Analysis of the structures reveals that STAT6 undergoes a dramatic conformational change on DNA binding, which was further validated by performing molecular dynamics simulation studies and small angle X-ray scattering analysis. Our data show that a larger angle at the intersection where the two protomers of STAT meet and the presence of a unique residue, H415, in the DNA-binding domain play important roles in discrimination of the N4 site DNA from the N3 site by STAT6. H415N mutation of STAT6CF decreased affinity of the protein for the N4 site DNA, but increased its affinity for N3 site DNA, both in vitro and in vivo. Results of our structure-function studies on STAT6 shed light on mechanism of DNA recognition by STATs in general and explain the reasons underlying STAT6's preference for N4 site DNA over N3.

Keywords: JAK-STAT pathway; N4 site DNA recognition; STAT6; antiviral innate immunity; crystal structure.


Conflict of interest statement

The authors declare no conflict of interest.

Figures

Fig. 1.
Fig. 1.
Structure of STAT6CF and N4 site DNA complex. (A) Schematic diagram showing the domain organization of human STAT6, including N-terminal domain (gray), coiled coil domain (yellow), DNA-binding domain (red), linker domain (orange), SH2 domain (cyan), and TAD domain (gray). The core fragment and phosphorylation site Y641 are indicated. (B) Cartoon diagram of the STAT6CF-N4 complex (in front view). Colors of each domain are the same as in A. (C) Drawing depicting details of the STAT6CF–DNA interface. The side chains of residues (A chain) donating hydrogen bonds are shown as magenta colored sticks, and the hydrogen bonds are shown as yellow dashed lines. The conserved palindromic bases (TTC/GAA) in both sides of the DNA molecule are shown in orange. (D) A schematic drawing highlighting STAT6CF–DNA interactions. Residues forming hydrogen bonds are colored in magenta (D chain) and black (B chain).
Fig. S1.
Fig. S1.
DNA sequences preferred by STAT proteins based on the existing experimental determination of STAT DNA-binding motifs (7, 35).
Fig. S2.
Fig. S2.
Multiple sequence alignment of STAT6 and other STAT proteins produced by ClusterW and ESpript (espript.ibcp.fr/ESPript/ESPript/). Every 10 residues are indicated with a dot (·) shown above the sequences. Strictly conserved residues are boxed in white on a red background, and highly conserved residues are boxed in red on a white background. The key residue (H415 in STAT6) for distinguishing N4 and N3 site DNA and the strictly conserved tyrosine phosphorylation site (Y641 in STAT6) are highlighted by a black box and a green box, respectively. The core fragment of STAT6 (aa 123–658) used in the study is marked.
Fig. S3.
Fig. S3.
Characterization of STAT6CF. (A) Comparison of elution profiles of unphosphorylated STAT6CF (monomer), phosphorylated STAT6CF (dimer), and STAT6CF-N4 complex during gel filtration chromatography. (B) AUC analysis of unphosphorylated STAT6CF, phosphorylated STAT6CF, and STAT6CF-N4 complex shows that unphosphorylated STAT6CF forms a monomer, whereas phosphorylated STAT6CF forms a dimer in solution. (C) TSA results of unphosphorylated STAT6CF and phosphorylated STAT6CF with or without DNA. Both unphosphorylated and phosphorylated STAT6CF had high melting temperature, but only phosphorylated STAT6CF formed a complex with DNA, which resulted in a higher melting temperature than the protein alone. (D) ITC results show that phosphorylated STAT6CF interacts with DNA with a molar ratio of 2:1. (E) Identification of phosphorylation of Y641 by MS. The identified peptide is “DGRGYVPATIK” phosphorylated at Y5, Charge: +3 and monoisotopic m/z: 419.53912 Da.
Fig. S4.
Fig. S4.
STAT6CF dimer formation and its complex with N4 DNA. (A) Cartoon representation of STAT6CF homodimer, shown from the front view (Upper) and the top view (Lower). The coloring scheme for each domain is the same as in Fig. 1B. The N and C termini of one protomer are labeled with N and C, and missing loops are shown by dashed lines. (B) Superimposition of STAT6CF and previously reported unphosphorylated STAT1CF (PDB ID code 1YVL), STAT3CF (PDB ID code 3CWG), and STAT5CF (PDB ID code 1Y1U) protomers is shown. (C) Drawing depicting details of the interactions between the phosphorylated tail of Y641 from one molecule and the SH2 domain of another molecule. The phosphorylated tail is shown in green; the residues directly participating in the hydrogen bonding interactions are colored magenta. (B) Drawing depicting details of the interactions between two phosphorylated tail fragments as an antiparallel β-sheet. The residue K647 was placed at the center of the dimer interface. (C) Superimposition of STAT6 over STAT1 shows that STAT6CF (magenta) has a shorter C-terminal loop than STAT1CF (green). The C-terminal loops of both proteins are highlighted by black ellipse. (D) Surface electrostatic potential representation of STAT6CF bound with 22-bp N4 site DNA. A positively charged area inserts into the major groove of dsDNA. Blue, positively charged; red, negatively charged; white, neutral. (E) A simulated annealing (SA) omit electron density map (2Fo-Fc), contoured at 1.0σ, of N4 site dsDNA bound to phosphorylated STAT6CF. (F) Electron density map (2Fo-Fc), contoured at 1.0σ, of H415 at DNA binding domain of STAT6. (G) DNAs in STAT1/STAT3 complex structures are bent, forming a 140° angle. (H) DNA molecules in STAT6CF complex are straight and connected to each other end to end, depicting an appearance of a long continuous stretch of DNA in the crystal packing. (I) Residues of the DNA binding interface of STAT6 are highly conserved. Amino acid conservation of STAT6CF via 150 homologs was displayed on STAT6CF-N4 structure using ConSurf (consurftest.tau.ac.il/). (J) Superimposition of N4 site DNA bound STAT6 with STAT5 (PDB ID code 1Y1U) showing the position of side chain of H415 in STAT6 (cyan) and H471 in STAT5 (orange). (K) Structures of apo STAT6CF and its complex with N4 and N3 site DNA were aligned with STAT1-N3 DNA structure using SH2 domain as reference (indicated by an arrow). A larger angle at the intersection where monomers meet is observed in STAT6CF structures (Inset). Magenta, DNA-free STAT6CF; green, N3 site DNA-bound STAT6CF; cyan, N4 site DNA-bound STAT6CF; blue, N3 site DNA-bound STAT1CF.
Fig. S5.
Fig. S5.
Crystal structure of STAT6CF-N3 complex and its comparison with STAT6CF-N4 complex structure. (A) Cartoon diagram of the STAT6CF-N3 complex. Colors of each domain are the same as in Fig. 1B. (B) Drawing depicting details of the STAT6CF-N3 interface. The side chains of residues (A chain) donating hydrogen bonds are shown by sticks in lemon and hydrogen bonds are shown in gray dash. The conserved palindromic bases (TTC/GAA) are shown in orange. (C) A simulated annealing (SA) omit electron density map (2Fo-Fc), contoured at 1.0σ, of N3 site DNA in STAT6CF-N3 complex. (D) Electron density map (2Fo-Fc), contoured at 1.0σ, of H415 at DNA binding domain of STAT6. Hydrogen bond formed by H415 and G13 of DNA chain is shown in gray dash. (E) Conformational changes between STAT6CF-N3 and N4 site DNA complexes. The DNA binding domains are aligned together in one protomer of the STAT6CF dimer and the difference in the movement of H415-base interactions in the DNA binding domains in another protomer of the STAT6CF dimer is shown (in bottom view).
Fig. 2.
Fig. 2.
Residue H415 is essential for N4 site DNA recognition by STAT6. (A) Multiple sequence alignment of STAT6 and other STAT proteins produced by ClusterW and ESpript (espript.ibcp.fr/ESPript/ESPript/). The location of residues (histidine in STAT6/STAT5 and asparagine in STAT1-4) used for distinguishing N4 and N3 site DNA are indicated by a black arrow. Strictly conserved residues are boxed in white on a red background, and highly conserved residues are boxed in red on a white background. (B) The plasmids containing STAT6FL-WT, STAT6FL-H415A, or STAT6FL-H415N were transfected into HEK 293T cells together with renilla reporter and N4 site STAT6 luciferase reporter (Left) or N3 site STAT6 luciferase reporter genes (Right). After 24 h, cells were stimulated with IL-4 (10 ng/mL) for 2 h, and the results of dual-luciferase assay are shown for triplicate samples. Numbers are normalized with respect to the STAT6FL-WT data and presented as percentages.
Fig. 3.
Fig. 3.
Conformational change of STAT6CF upon DNA binding. (A) Motion of STAT6CF on DNA binding is shown by using SH2 domain as reference (indicated by an arrow in front view). The movements are indicated by bent black arrows in top view. Dash line indicates the movement of key residue H415 in DNA-free and N4 DNA-bound STAT6CF. (B) Comparison of N4 DNA-bound STAT6CF (residue and base in cyan) and N3 DNA-bound STAT1CF (residue and base in blue) using the DNA-binding domain as the reference. The differences between N4 and N3 site DNA recognition by STAT proteins are shown.
Fig. S6.
Fig. S6.
(A) Our STAT6CF-N3 site DNA complex structure compared with previously reported N3 site DNA bound structures using the DNA binding domain as the reference. The structures show very little divergence and the residues, H415 in STAT6, N460 in STAT1, and N466 in STAT3 (indicated by red circles), are almost at the same place as in the two protomers of the dimer. (B) The comparison of DNA binding domain of STAT6CF-N4 site DNA complex structure (cyan) and STAT1CF-N3 site DNA complex structure (blue) is shown as cartoon representation. The steric hindrance between residue N417 in STAT6 and the DNA base (the fifth T) in the N3 site DNA bound STAT1 (PDB ID code 1BF5) are shown as spheres. (C and D) The conformation of STAT6CF is stabilized by DNA binding. Cartoon display of the region selected for molecular dynamics simulation calculation (red circle) on the model containing missing loops generated by MODELER program based on our STAT6CF-N4 complex (C) and time series of the distance between N-terminal coiled coil domains from molecular dynamics simulation (Upper) and one-dimensional free energy profile as the function of N-terminal coiled coil domain distance for Apo-STAT6CF (black) and STAT6CF-N4 complex (red), respectively (Lower). The dotted lines in the upper panel show the observed distances, derived from crystal structures of phosphorylated STAT6CF (black) and STAT6CF-N4 complex (red).
Fig. S7.
Fig. S7.
SAXS analysis of unphosphorylated STAT6CF, phosphorylated STAT6CF, and STAT6CF-N4 complex. Scattering curves (A) and P(r) distribution (B) of unphosphorylated STAT6CF (black), phosphorylated STAT6CF (red), and STAT6CF-N4 complex (green) are indicated. The Inset in A is Guinier plots. (C) Kratky plots. (D and E) Experiential scattering profiles (in blue) of the 2.5 mg/mL phosphorylated STAT6CF (D) and STAT6CF -N4 complex (E) vs. the ideal scattering profiles (in green) of their corresponding crystal structures (phosphorylated STAT6CF, χ2 = 2.089; STAT6CF-N4 complex, χ2 = 1.060, respectively) calculated using CRYSOL (36). Also shown in these figures are the ribbon models of the X-ray crystal structures superposed onto the molecular envelopes based on SAXS data calculated by program DAMMIF (37). These envelopes were calculated from the average of 16 DAMMIF runs with P1 symmetry. The crystal structures were superimposed onto their corresponding envelopes using ref. . (F) Parameters derived from SAXS curves.
Fig. 4.
Fig. 4.
Identification of key residues for DNA binding by mutagenesis. (A) ITC measurements of affinities of STAT6CF-WT (Left), STAT6CF-K288A (Middle), and STAT6CF-H415A (Right) for N4 site DNA (CS4) are shown. (B) The ability of several mutants of STAT6FL to activate gene transcription was assessed. Mean ratio luciferase/renilla light units activities are shown for triplicate samples. Normalized results are presented as percent activity relative to the activity in cells transfected with STAT6FL-WT. (C) The residues (in red) mentioned above for mutagenesis, mutations reported by Ritz et al. (in magenta) (26) and Yildiz et al. (in blue) (22) were mapped on a protomer of STAT6CF-N4 structure (in front view). The key residue Y641 is also shown. (D) Unique mutations from a large-scale cancer genomics dataset analysis in cBioPortal (www.cbioportal.org) web tool are mapped on a protomer of STAT6CF-N4 structure.
Fig. S8.
Fig. S8.
S407 of STAT6 is not accessible for phosphorylation. (A) Side chain of S407 points toward the interior of STAT6 and forms two hydrogen bonds with the residues V386 and L408, which was confirmed by electron density map (2Fo-Fc), contoured at 1.0 σ, of S407. (B) HEK 293T cells were transfected with a 4 × STAT6 luciferase (Luc) reporter, renilla (Ren) reporter, and pcDNA3.1 empty (NTC), STAT6FL-WT, STAT6FL-S407E, or STAT6FL-S407A. After 24 h, cells were stimulated with IL-4 (10 ng/mL) or transfected with poly(dA:dT) (2 μg/μL) for 2 h. Mean ratio luciferase/renilla light units activity is shown for triplicate samples. Normalized results are presented as percent activity relative to the activity in cells transfected with STAT6FL-WT.

References

    1. Abroun S, et al. STATs: An old story, yet mesmerizing. Cell J. 2015;17(3):395–411. - PMC - PubMed
    1. Lai PS, et al. A STAT inhibitor patent review: Progress since 2011. Expert Opin Ther Pat. 2015;25(12):1397–1421. - PubMed
    1. Miklossy G, Hilliard TS, Turkson J. Therapeutic modulators of STAT signalling for human diseases. Nat Rev Drug Discov. 2013;12(8):611–629. - PMC - PubMed
    1. Takeda K, et al. Essential role of Stat6 in IL-4 signalling. Nature. 1996;380(6575):627–630. - PubMed
    1. Chen H, et al. Activation of STAT6 by STING is critical for antiviral innate immunity. Cell. 2011;147(2):436–446. - PubMed

Publication types