. 2016 Oct 18:10:192.
doi: 10.3389/fnbeh.2016.00192. eCollection 2016.

Probing Intrinsic Resting-State Networks in the Infant Rat Brain

Affiliations

Probing Intrinsic Resting-State Networks in the Infant Rat Brain

Dusica Bajic et al. Front Behav Neurosci. .

Abstract

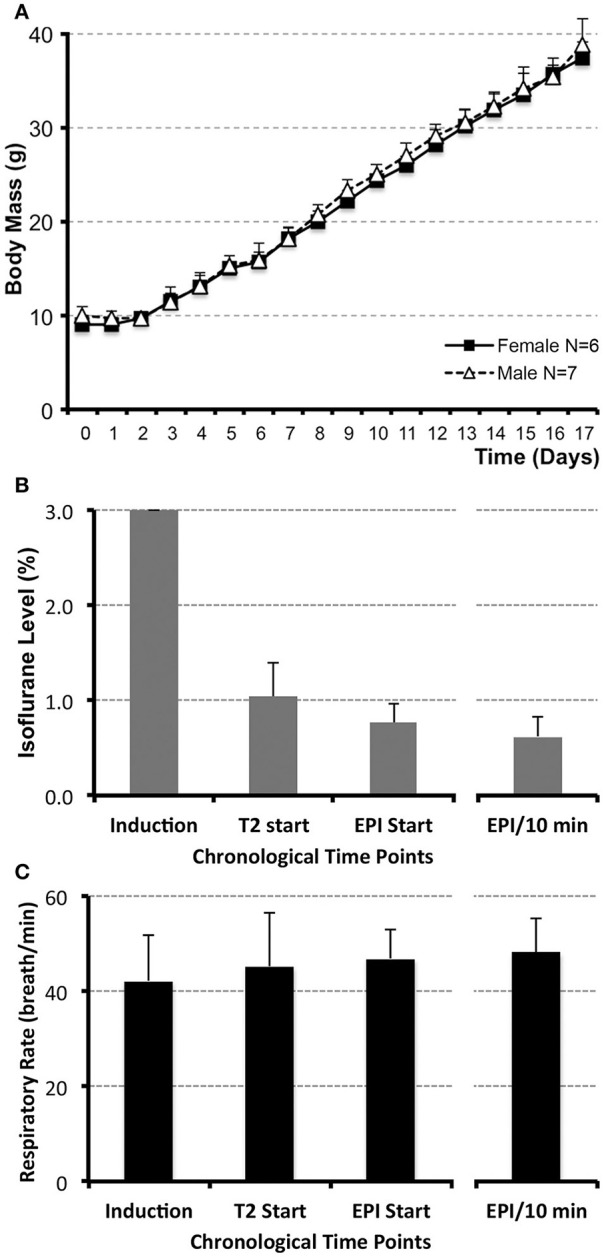
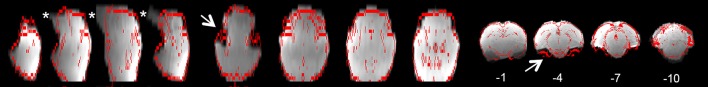
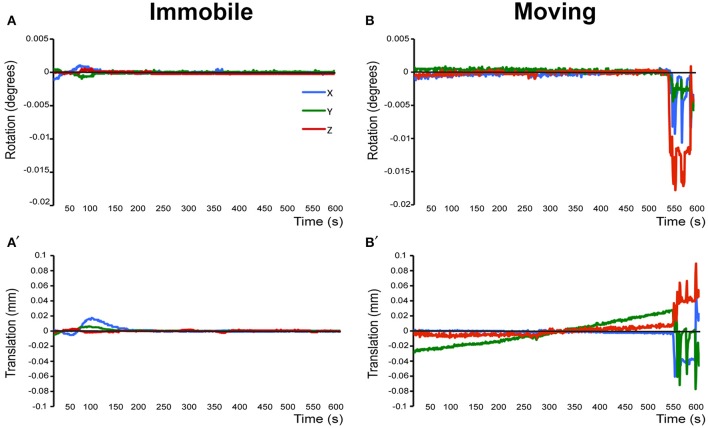
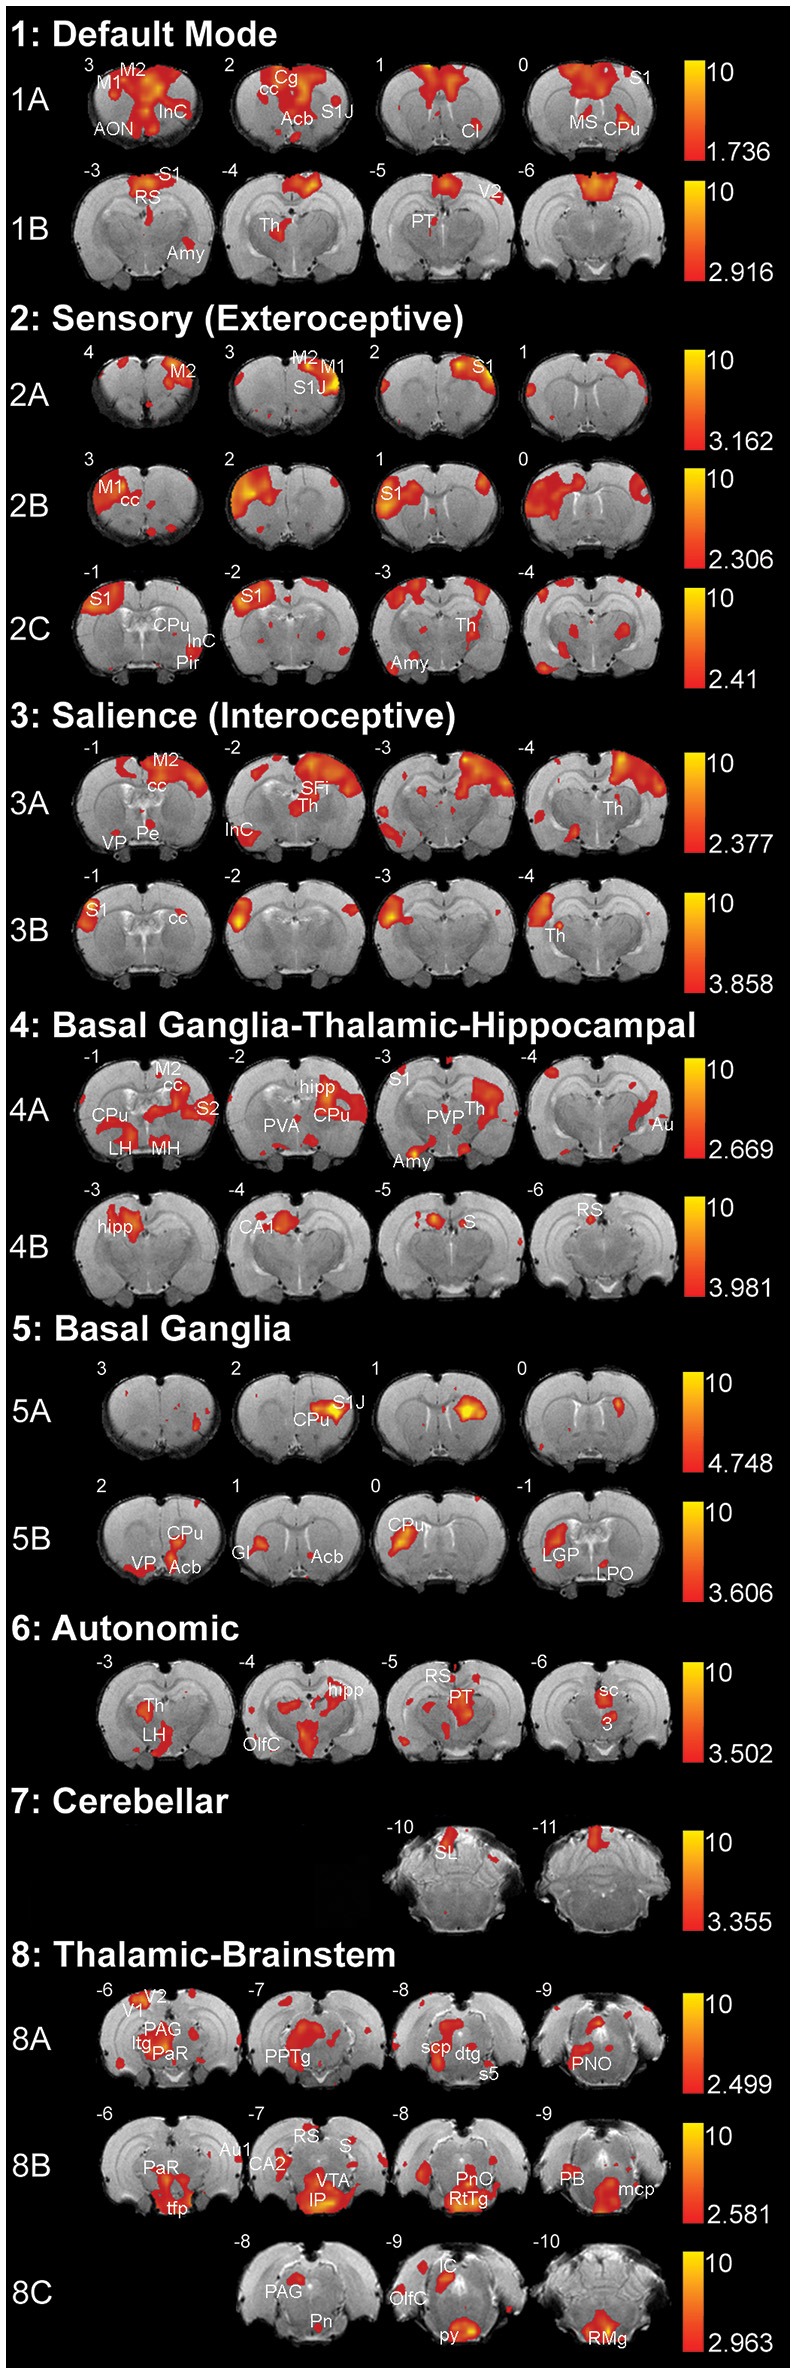
Resting-state functional magnetic resonance imaging (rs-fMRI) measures spontaneous fluctuations in blood oxygenation level-dependent (BOLD) signal in the absence of external stimuli. It has become a powerful tool for mapping large-scale brain networks in humans and animal models. Several rs-fMRI studies have been conducted in anesthetized and awake adult rats, reporting consistent patterns of brain activity at the systems level. However, the evolution to adult patterns of resting-state activity has not yet been evaluated and quantified in the developing rat brain. In this study, we hypothesized that large-scale intrinsic networks would be easily detectable but not fully established as specific patterns of activity in lightly anesthetized 2-week-old rats (N = 11). Independent component analysis (ICA) identified 8 networks in 2-week-old-rats. These included Default mode, Sensory (Exteroceptive), Salience (Interoceptive), Basal Ganglia-Thalamic-Hippocampal, Basal Ganglia, Autonomic, Cerebellar, as well as Thalamic-Brainstem networks. Many of these networks consisted of more than one component, possibly indicative of immature, underdeveloped networks at this early time point. Except for the Autonomic network, infant rat networks showed reduced connectivity with subcortical structures in comparison to previously published adult networks. Reported slow fluctuations in the BOLD signal that correspond to functionally relevant resting-state networks in 2-week-old rats can serve as an important tool for future studies of brain development in the settings of different pharmacological applications or disease.

Keywords: BOLD; MRI; blood oxygen level-dependent; fMRI; neurodevelopment; neuroimaging; rs-fMRI.


Figures

Figure 1
Figure 1
Infant rat growth (A) and anesthesia management during MRI (B,C). (A) illustrates the average weight of infant rats (N = 13; g ± SD) from postnatal day (PD) 0, considered the day of birth, through PD17 for both female (N = 6) and male (N = 7) rats. No significant differences between sexes were observed at any of the time points. (B) illustrates average levels of administered inhalational anesthetic, Isoflurane/O2 at 1 L/min via nose cone (% ± SD; N = 13), at different time points during the scanning. Following uniform induction with 3% Isoflurane/O2 at 1 L/min, anesthetic level was decreased to maintain a consistent respiratory rate in a narrow range between 45 and 50 breaths/min (C). Analysis included the values at the start of the first (anatomical RARE) scan, as well as the start of the second (functional EPI) scan. Average value of Isoflurane level during the length of the functional scan (based on the two 5 min interval measurements/animal) and its average corresponding respiratory rate are shown in the far-right columns (B,C). Respiratory rate was used as an indirect measure of steady and uniform anesthetic depth during functional scan. No differences in respiratory rate (breath/min ± SD) were noted between different time points analyzed [C; induction, T2 start, EPI start, average EPI/10 min; F(3, 47) = 1.11, p = 0.35]. One-way ANOVA with Tukey HSD test.
Figure 2
Figure 2
Representative registration of 2-week-old rat using an adult rat template. Figure illustrates representative individual functional-to-standard registration of all 2-week-old rats included in the ICA analysis. The gray image represents individual rs-fMRI data while the red contour represents the outline of an adult atlas as reported by FSL output. First four columns are in axial view; the next four in sagittal, and the remaining four columns represent coronal view. Common expected artifact is seen in the ventral regions of the rat brain (near ear channels; Schwarz et al., 2006). It is best visualized in the first transverse and the second coronal section (arrows). Distortions noted in ventral parts of the brain were noted in all individual rats only in the caudal region of the brainstem (stars). Numbers below coronal slices represent distance from Bregma (mm). Section with Bregma of 0 mm corresponds to Panel 17 of Rat Brain Atlas (Paxinos and Watson, 1998). Left hemisphere of the brain corresponds to the right side of the image.
Figure 3
Figure 3
Assessment of motion in lightly anesthetized infant rats during imaging. (A,A') display the rotation (in degrees) and translation (in mm) for an immobile 2-week-old rat during MRI, respectively. Rotation is a rigid body movement and refers to the movement of the head around a center point. Translation is every point on the head moving a constant distance in a specific direction. The immobile rat's head did not rotate more than 0.005 degrees or moved more than 0.02 mm. This is an acceptable amount of movement for the group ICA. (B,B') illustrate rotation and translation of an infant rat that moved during the scanning, which lead to a motion-related imaging artifact. As a result, data obtained from this animal was excluded from the group ICA. Blue X line, horizontal axis; Green Y line, vertical axis; Red Z line, longitudinal axis of the scanner.
Figure 4
Figure 4
Resting-state networks in 2-week-old rats. The figure illustrates eight different resting-state networks that were identified in 2-week-old rats (N = 11; 5 female and 6 male from 4 different litters) under light anesthesia. Networks 1–7 showed some spatial similarity to adult networks and included: (1) Default Mode Network, (2) Sensory (Exteroceptive) Network, and (3) Salience (Interoceptive) Network, (4) Basal Ganglia-Thalamic-Hippocampal Network, (5) Basal Ganglia, (6) Autonomic, and (7) Cerebellar Network. The last, (8) Thalamic-Brainstem Network has not been described in adult rats. With the exception of Autonomic and Cerebellar Networks, all others were comprised of multiple components extracted by Melodic. The resting-state networks maps are represented as z-scores. The threshold bars show a maximum threshold of 10 and the minimum z-score necessary for significance for each component. The positive map colors range from dark red to yellow. The numbers in the upper left corner of each coronal section refer to distance from Bregma (mm). Each individual coronal section corresponds to traditional radiographic orientation; the left hemisphere of the brain corresponds to the right side of the image. Anatomical abbreviations were adopted from Rat Brain Atlas (Paxinos and Watson, 1998). 3, oculomotor nucleus; Acb, accumbens nucleus; Amy, amygdala; AON, anterior olfactory nucleus; Au1, primary auditory cortex; Au, auditory cortex; CA1; field CA1 of hippocampus; CA2; field CA2 of hippocampus; Cb6, cerebellar lobule 06; Cb7, cerebellar lobule 07; Cb8, cerebellar lobule 08; cc; corpus callosum; Cg, cingulate cortex; Cl, claustrum; CPu, caudate putamen; dtg, dorsal tegmental bundle; GI, granular insular cortex; hipp, hippocampus; ic, internal capsule; IC, inferior colliculus; IP, interpeduncular nucleus; InC, insular cortex; LGP, lateral globus pallidus; LH, lateral hypothalamus; LPO, lateral preoptic area; M1, primary motor cortex; M2, secondary motor cortex; mcp, medial cerebellar peduncle; MH, medial hypothalamus; MS, medial septal nuclei; OlfC, olfactory cortex; PAG, periaqueductal gray; PaR, pararubral nucleus; PB, parabrachial nucleus; Pe, periventricular hypothalamic nucleus; Pir, piriform cortex; PnO, pontine reticular nucleus, oral part; PPTg, pedunculopontine tegmental nucleus; PT, pretectum; PVA, paraventricular thalamic nucleus—anterior; PVP, paraventricular thalamic nucleus; py, pyramidal tract; RS, retrospenial cortex; RtTg, reticular tegmentum; S, subiculum; S1, primary somatosensory cortex; S1J, primary somatosensory cortex—jaw region; S2, secondary somatosensory cortex; s5, sensory root of trigeminal nucleus; sc, superior colliculus; scp, superior cerebellar peduncle; SFi, septofimbrial nucleus; tfp, transverse fibers of pons; Th, thalamus; V1, primary visual cortex; V2, secondary visual cortex; VP, ventral pallidum; VTA, ventral tegmental area.

References

    1. Asou H., Murakami K., Toda M., Uyemura K. (1995). Development of oligodendrocyte and myelination in the central nervous system. Keio J. Med. 44, 47–52. 10.2302/kjm.44.47 - DOI - PubMed
    1. Attwell D., Buchan A. M., Charpak S., Lauritzen M., Macvicar B. A., Newman E. A. (2010). Glial and neuronal control of brain blood flow. Nature 468, 232–243. 10.1038/nature09613 - DOI - PMC - PubMed
    1. Becerra L., Pendse G., Chang P. C., Bishop J., Borsook D. (2011). Robust reproducible resting state networks in the awake rodent brain. PLoS ONE 6:e25701. 10.1371/journal.pone.0025701 - DOI - PMC - PubMed
    1. Beckmann C. F., DeLuca M., Devlin J. T., Smith S. M. (2005). Investigations into resting-state connectivity using independent component analysis. Philos. Trans. R. Soc. Lond. B. Biol. Sci. 360, 1001–1013. 10.1098/rstb.2005.1634 - DOI - PMC - PubMed
    1. Biswal B., Yetkin F. Z., Haughton V. M., Hyde J. S. (1995). Functional connectivity in the motor cortex of resting human brain using echo-planar MRI. Magn. Reson. Med. 34, 537–541. 10.1002/mrm.1910340409 - DOI - PubMed

LinkOut - more resources