

Identify the Atrophy of Alzheimer's Disease, Mild Cognitive Impairment and Normal Aging Using Morphometric MRI Analysis
- PMID: 27803665
- PMCID: PMC5067377
- DOI: 10.3389/fnagi.2016.00243
Identify the Atrophy of Alzheimer's Disease, Mild Cognitive Impairment and Normal Aging Using Morphometric MRI Analysis
Abstract
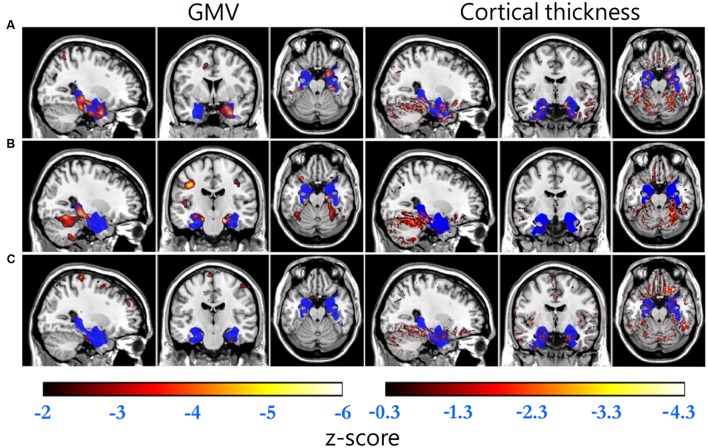
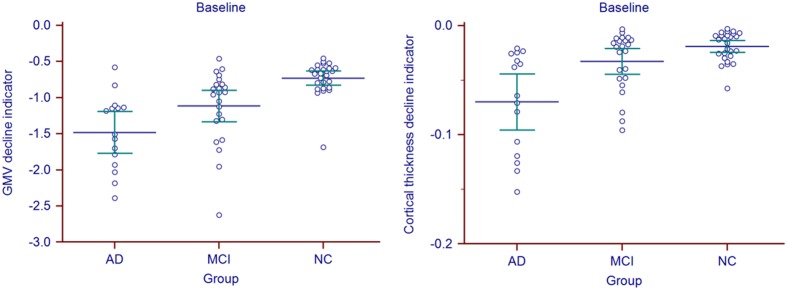
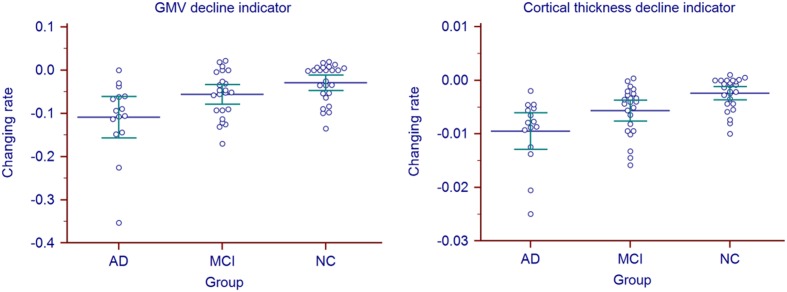
Quantitatively assessing the medial temporal lobe (MTL) structures atrophy is vital for early diagnosis of Alzheimer's disease (AD) and accurately tracking of the disease progression. Morphometry characteristics such as gray matter volume (GMV) and cortical thickness have been proved to be valuable measurements of brain atrophy. In this study, we proposed a morphometric MRI analysis based method to explore the cross-sectional differences and longitudinal changes of GMV and cortical thickness in patients with AD, MCI (mild cognitive impairment) and the normal elderly. High resolution 3D MRI data was obtained from ADNI database. SPM8 plus DARTEL was carried out for data preprocessing. Two kinds of z-score map were calculated to, respectively, reflect the GMV and cortical thickness decline compared with age-matched normal control database. A volume of interest (VOI) covering MTL structures was defined by group comparison. Within this VOI, GMV, and cortical thickness decline indicators were, respectively, defined as the mean of the negative z-scores and the sum of the normalized negative z-scores of the corresponding z-score map. Kruskal-Wallis test was applied to statistically identify group wise differences of the indicators. Support vector machines (SVM) based prediction was performed with a leave-one-out cross-validation design to evaluate the predictive accuracies of the indicators. Linear least squares estimation was utilized to assess the changing rate of the indicators for the three groups. Cross-sectional comparison of the baseline decline indicators revealed that the GMV and cortical thickness decline were more serious from NC, MCI to AD, with statistic significance. Using a multi-region based SVM model with the two indicators, the discrimination accuracy between AD and NC, MCI and NC, AD and MCI was 92.7, 91.7, and 78.4%, respectively. For three-way prediction, the accuracy was 74.6%. Furthermore, the proposed two indicators could also identify the atrophy rate differences among the three groups in longitudinal analysis. The proposed method could serve as an automatic and time-sparing approach for early diagnosis and tracking the progression of AD.
Keywords: Alzheimer’s disease; MRI; atrophy indicator; cortical thickness; gray matter volume; medial temporal lobe; morphometric analysis.
Figures
References
-
- Bosscher L., Scheltens P. (2002). “MRI of the medial temporal lobe for the diagnosis of Alzheimer disease,” in Evidence-Based Dementia Practice, eds Qizilbash N., Schneider L. S., Chui H., Brodaty H., Kaye J.et al. (Oxford: Blackwell Science; ), 154–162.
Grants and funding
LinkOut - more resources
Full Text Sources
Other Literature Sources