

Climate change-induced salinity variation impacts on a stenoecious mangrove species in the Indian Sundarbans
- PMID: 27804094
- PMCID: PMC5385663
- DOI: 10.1007/s13280-016-0839-9
Climate change-induced salinity variation impacts on a stenoecious mangrove species in the Indian Sundarbans
Abstract
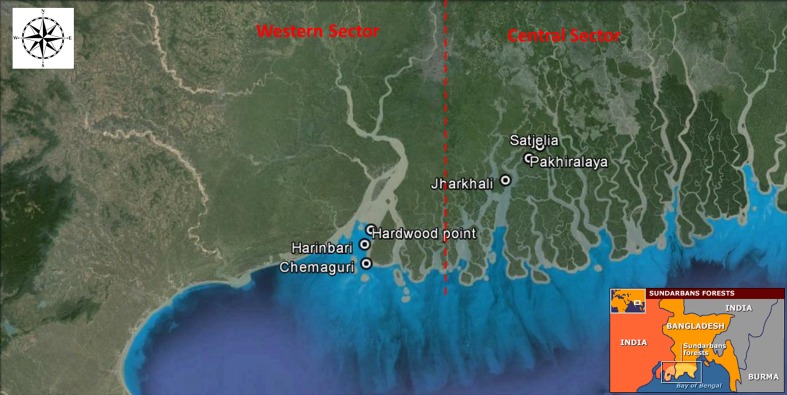
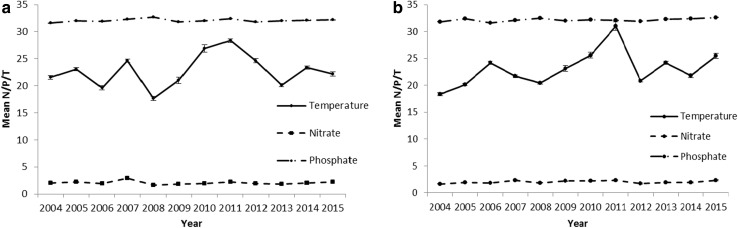
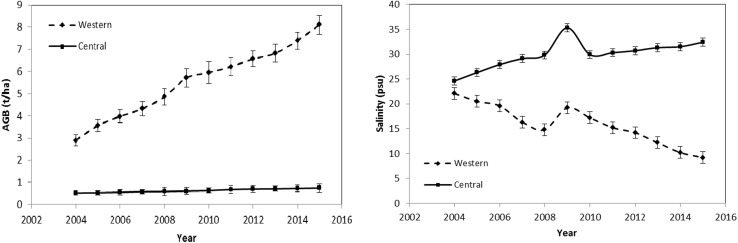
The alterations in the salinity profile are an indirect, but potentially sensitive, indicator for detecting changes in precipitation, evaporation, river run-off, glacier retreat, and ice melt. These changes have a high impact on the growth of coastal plant species, such as mangroves. Here, we present estimates of the variability of salinity and the biomass of a stenoecious mangrove species (Heritiera fomes, commonly referred to as Sundari) in the aquatic subsystem of the lower Gangetic delta based on a dataset from 2004 to 2015. We highlight the impact of salinity alteration on the change in aboveground biomass of this endangered species that, due to different salinity profile in the western and central sectors of the lower Gangetic plain, shows an increase only in the former sector, where the salinity is dropping and low growth in the latter, where the salinity is increasing.
Keywords: Aboveground biomass; Climate change; Gangetic plain; Glacier melting; Heritiera fomes; Salinity.
Figures

References
-
- Antonov JI, Levitus S, Boyer TP. Steric sea level variations during 1957–1994: Importance of salinity. Journal of Geophysical Research. 2002;107:8013. doi: 10.1029/2001JC000964. - DOI
-
- APHA. 2001. Standard methods for the examination of water and waste water, 874 pp. Washington D.C.: American Public Health Association.
-
- Banerjee K. Decadal change in the surface water salinity profile of Indian Sundarbans: A potential indicator of climate change. Journal of Marine Science Research Development. 2013;S11:002.
-
- Battipaglia G, Zalloni E, Castaldi S, Marzaioli F, Cazzolla Gatti R, Lasserre B, Tognetti R, Marchetti M, Valentini R. Long tree-ring chronologies provide evidence of recent tree growth decrease in a central African tropical forest. PLoS ONE. 2015;10:e0120962. doi: 10.1371/journal.pone.0120962. - DOI - PMC - PubMed
MeSH terms
LinkOut - more resources
Full Text Sources
Other Literature Sources
Medical
