

Disrupted resting-state brain network properties in obesity: decreased global and putaminal cortico-striatal network efficiency
- PMID: 27804899
- PMCID: PMC5426347
- DOI: 10.1017/S0033291716002646
Disrupted resting-state brain network properties in obesity: decreased global and putaminal cortico-striatal network efficiency
Abstract
Background: The efficient organization and communication of brain networks underlie cognitive processing and their disruption can lead to pathological behaviours. Few studies have focused on whole-brain networks in obesity and binge eating disorder (BED). Here we used multi-echo resting-state functional magnetic resonance imaging (rsfMRI) along with a data-driven graph theory approach to assess brain network characteristics in obesity and BED.
Method: Multi-echo rsfMRI scans were collected from 40 obese subjects (including 20 BED patients) and 40 healthy controls and denoised using multi-echo independent component analysis (ME-ICA). We constructed a whole-brain functional connectivity matrix with normalized correlation coefficients between regional mean blood oxygenation level-dependent (BOLD) signals from 90 brain regions in the Automated Anatomical Labeling atlas. We computed global and regional network properties in the binarized connectivity matrices with an edge density of 5%-25%. We also verified our findings using a separate parcellation, the Harvard-Oxford atlas parcellated into 470 regions.
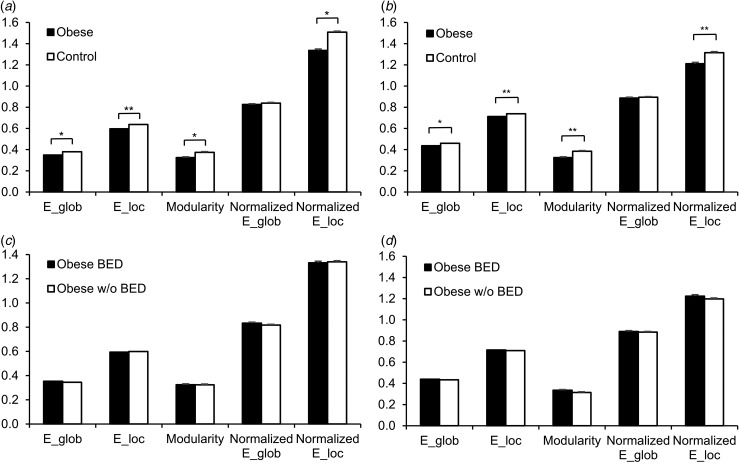
Results: Obese subjects exhibited significantly reduced global and local network efficiency as well as decreased modularity compared with healthy controls, showing disruption in small-world and modular network structures. In regional metrics, the putamen, pallidum and thalamus exhibited significantly decreased nodal degree and efficiency in obese subjects. Obese subjects also showed decreased connectivity of cortico-striatal/cortico-thalamic networks associated with putaminal and cortical motor regions. These findings were significant with ME-ICA with limited group differences observed with conventional denoising or single-echo analysis.
Conclusions: Using this data-driven analysis of multi-echo rsfMRI data, we found disruption in global network properties and motor cortico-striatal networks in obesity consistent with habit formation theories. Our findings highlight the role of network properties in pathological food misuse as possible biomarkers and therapeutic targets.
Keywords: Binge eating; brain networks; graph theory; obesity; resting-state functional magnetic resonance imaging.
Figures


References
-
- American Psychiatric Association (2000). Diagnostic and Statistical Manual of Mental Disorders, Text Revision (DSM-IV-TR). American Psychiatric Association: Washington, DC.
-
- Avena NM, Bocarsly ME, Hoebel BG (2012). Animal models of sugar and fat bingeing: relationship to food addiction and increased body weight. Methods in Molecular Biology 829, 351–365. - PubMed
MeSH terms
Grants and funding
LinkOut - more resources
Full Text Sources
Other Literature Sources
Medical
Miscellaneous
