

Challenges in Predicting Protein-Protein Interactions from Measurements of Molecular Diffusivity
- PMID: 27806265
- PMCID: PMC5103004
- DOI: 10.1016/j.bpj.2016.09.018
Challenges in Predicting Protein-Protein Interactions from Measurements of Molecular Diffusivity
Abstract
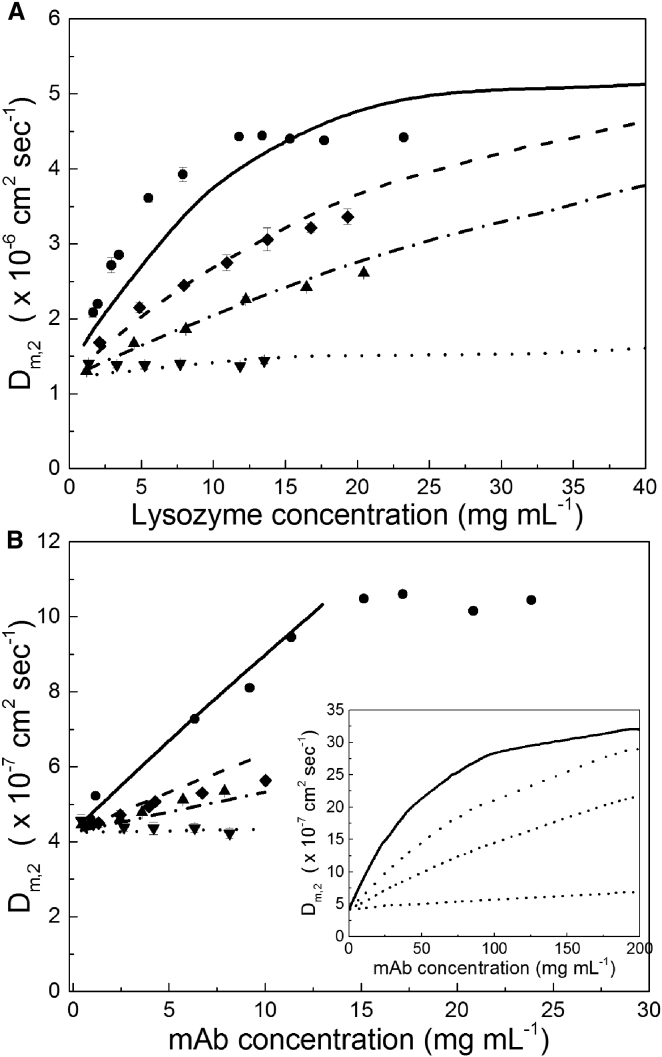
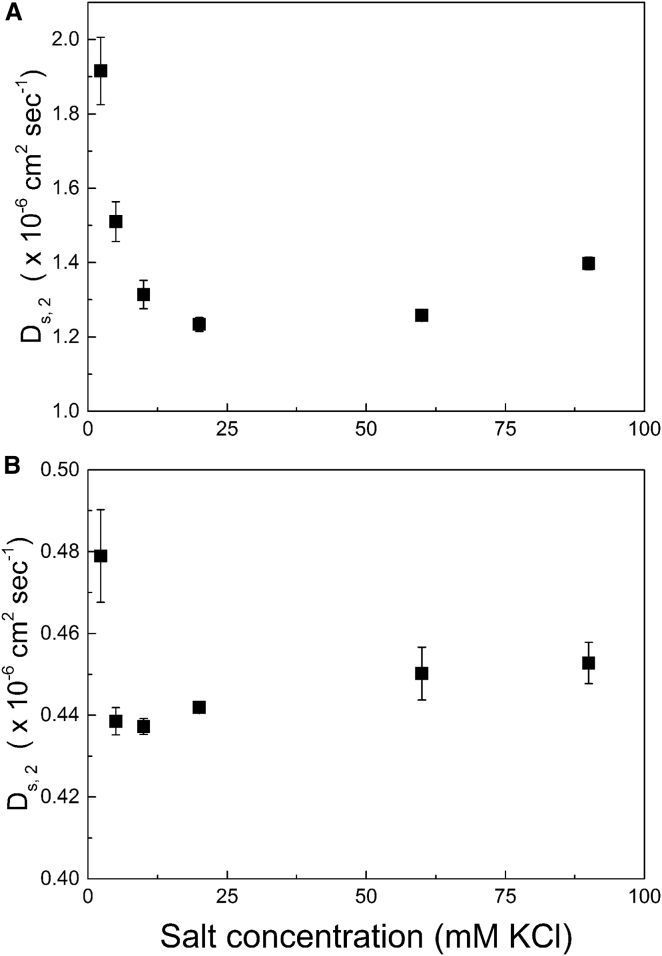
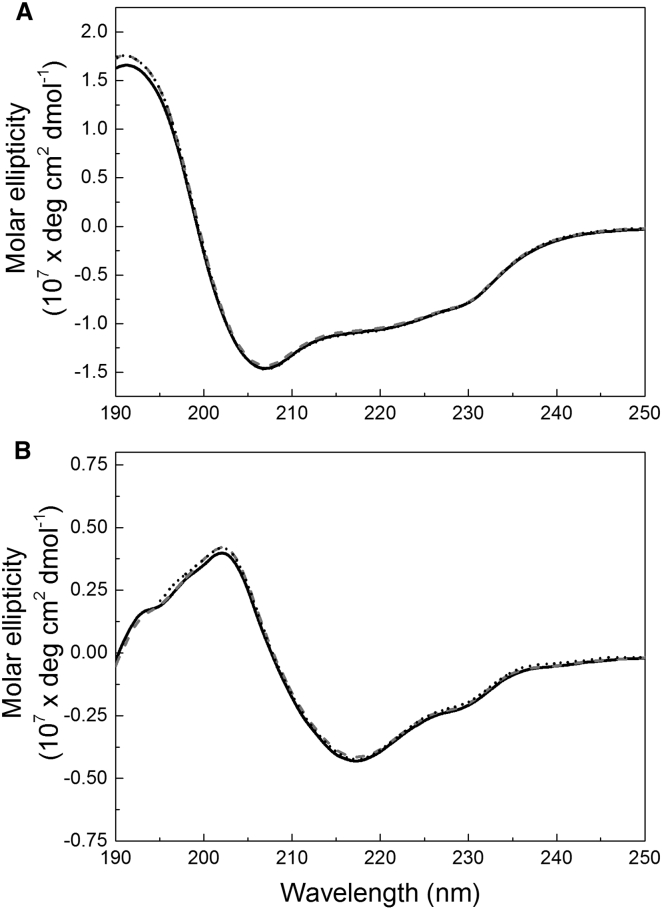
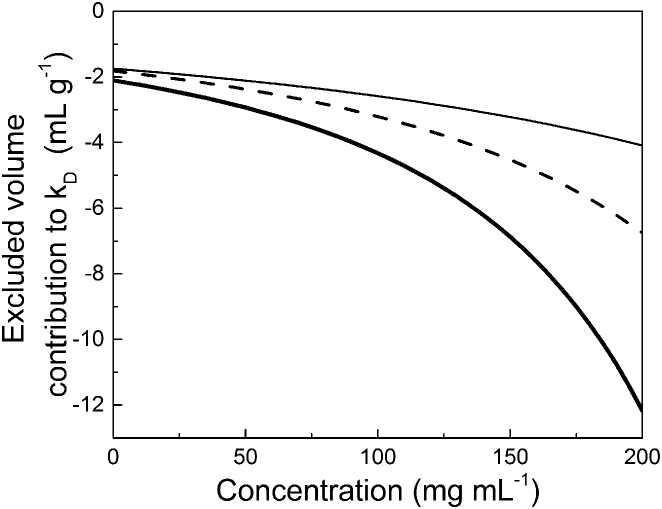
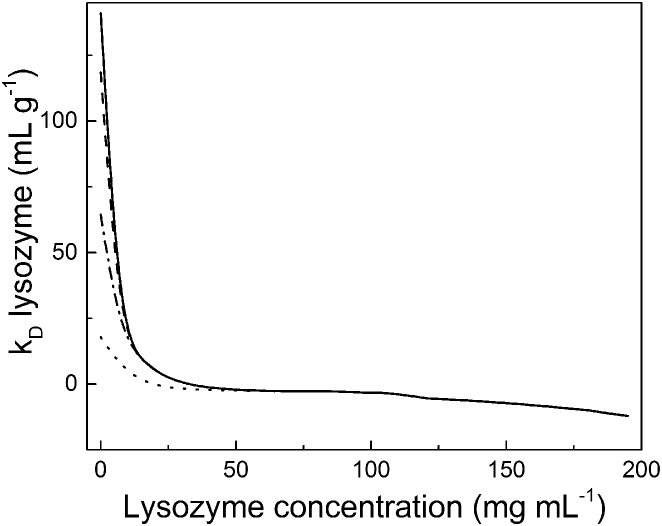
Dynamic light scattering can be used to measure the diffusivity of a protein within a formulation. The dependence of molecular diffusivity on protein concentration (traditionally expressed in terms of the interaction parameter kD) is often used to infer whether protein-protein interactions are repulsive or attractive, resulting in solutions that are colloidally stable or unstable, respectively. However, a number of factors unrelated to intermolecular forces can also impact protein diffusion, complicating this interpretation. Here, we investigate the influence of multicomponent diffusion in a ternary protein-salt-water system on protein diffusion and kD in the context of Nernst-Planck theory. This analysis demonstrates that large changes in protein diffusivity with protein concentration can result even for hard-sphere systems in the absence of protein-protein interactions. In addition, we show that dynamic light scattering measurements of diffusivity made at low ionic strength cannot be reliably used to detect protein conformational changes. We recommend comparing experimentally determined kD values to theoretically predicted excluded-volume contributions, which will allow a more accurate assessment of protein-protein interactions.
Copyright © 2016 Biophysical Society. Published by Elsevier Inc. All rights reserved.
Figures
Comment in
-
Hard Spheres with Purely Repulsive Interactions Have Positive Diffusion Interaction Parameter, kD.Biophys J. 2017 Aug 8;113(3):753-754. doi: 10.1016/j.bpj.2017.03.043. Biophys J. 2017. PMID: 28793228 Free PMC article. No abstract available.
-
Response to Comment to the Editor.Biophys J. 2017 Aug 8;113(3):755-756. doi: 10.1016/j.bpj.2017.06.054. Biophys J. 2017. PMID: 28793229 Free PMC article. No abstract available.
Similar articles
-
Dynamic light scattering application to study protein interactions in electrolyte solutions.J Biol Phys. 2004 Jan;30(4):313-24. doi: 10.1007/s10867-004-0997-z. J Biol Phys. 2004. PMID: 23345875 Free PMC article.
-
Intermolecular interactions of IgG1 monoclonal antibodies at high concentrations characterized by light scattering.J Phys Chem B. 2010 Oct 14;114(40):12948-57. doi: 10.1021/jp1028646. J Phys Chem B. 2010. PMID: 20849134
-
The role of electrostatics in protein-protein interactions of a monoclonal antibody.Mol Pharm. 2014 Jul 7;11(7):2475-89. doi: 10.1021/mp5002334. Epub 2014 Jun 18. Mol Pharm. 2014. PMID: 24892385
-
Interactions of lysozyme in concentrated electrolyte solutions from dynamic light-scattering measurements.Biophys J. 1997 Dec;73(6):3211-24. doi: 10.1016/S0006-3495(97)78346-2. Biophys J. 1997. PMID: 9414232 Free PMC article.
-
Prediction of colloidal stability of high concentration protein formulations.Pharm Dev Technol. 2015 May;20(3):367-74. doi: 10.3109/10837450.2013.871032. Epub 2014 Jan 6. Pharm Dev Technol. 2015. PMID: 24392929
Cited by
-
Quantifying Protein-Protein Interactions by Molecular Counting with Mass Photometry.Angew Chem Int Ed Engl. 2020 Jun 26;59(27):10774-10779. doi: 10.1002/anie.202001578. Epub 2020 Apr 2. Angew Chem Int Ed Engl. 2020. PMID: 32167227 Free PMC article.
-
The effect of mAb and excipient cryoconcentration on long-term frozen storage stability - part 2: Aggregate formation and oxidation.Int J Pharm X. 2021 Dec 25;4:100109. doi: 10.1016/j.ijpx.2021.100109. eCollection 2022 Dec. Int J Pharm X. 2021. PMID: 35024604 Free PMC article.
-
The Investigation of Protein Diffusion via H-Cell Microfluidics.Biophys J. 2019 Feb 19;116(4):595-609. doi: 10.1016/j.bpj.2019.01.014. Epub 2019 Jan 22. Biophys J. 2019. PMID: 30736981 Free PMC article.
-
Hard Spheres with Purely Repulsive Interactions Have Positive Diffusion Interaction Parameter, kD.Biophys J. 2017 Aug 8;113(3):753-754. doi: 10.1016/j.bpj.2017.03.043. Biophys J. 2017. PMID: 28793228 Free PMC article. No abstract available.
-
High Throughput Prediction Approach for Monoclonal Antibody Aggregation at High Concentration.Pharm Res. 2017 Sep;34(9):1831-1839. doi: 10.1007/s11095-017-2191-6. Epub 2017 Jun 7. Pharm Res. 2017. PMID: 28593474
References
MeSH terms
Grants and funding
LinkOut - more resources
Full Text Sources
Other Literature Sources
