. 2016 Nov 1;17(6):1518-1531.
doi: 10.1016/j.celrep.2016.10.021.

SWAP70 Organizes the Actin Cytoskeleton and Is Essential for Phagocytosis

Affiliations

SWAP70 Organizes the Actin Cytoskeleton and Is Essential for Phagocytosis

Maksim V Baranov et al. Cell Rep. .

Abstract

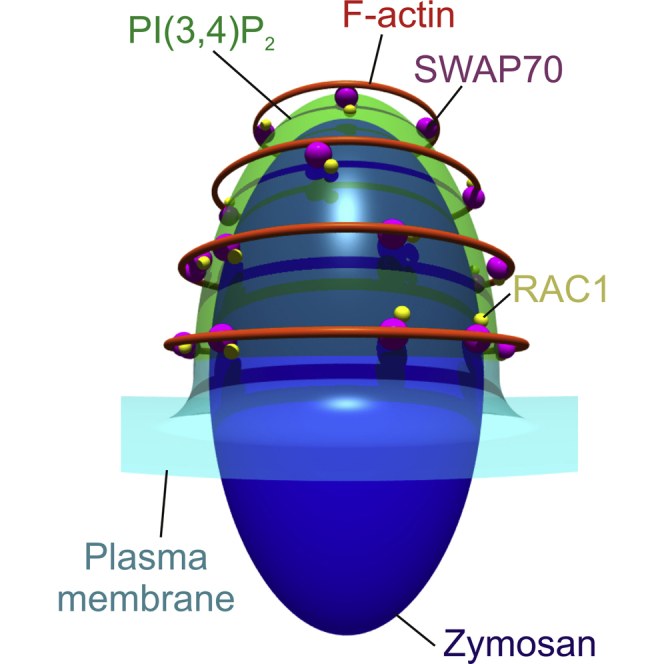
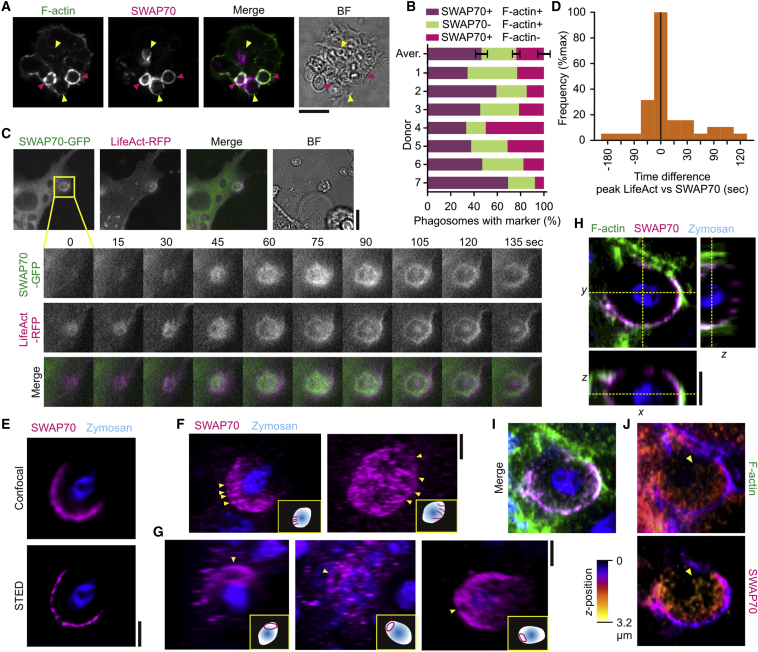
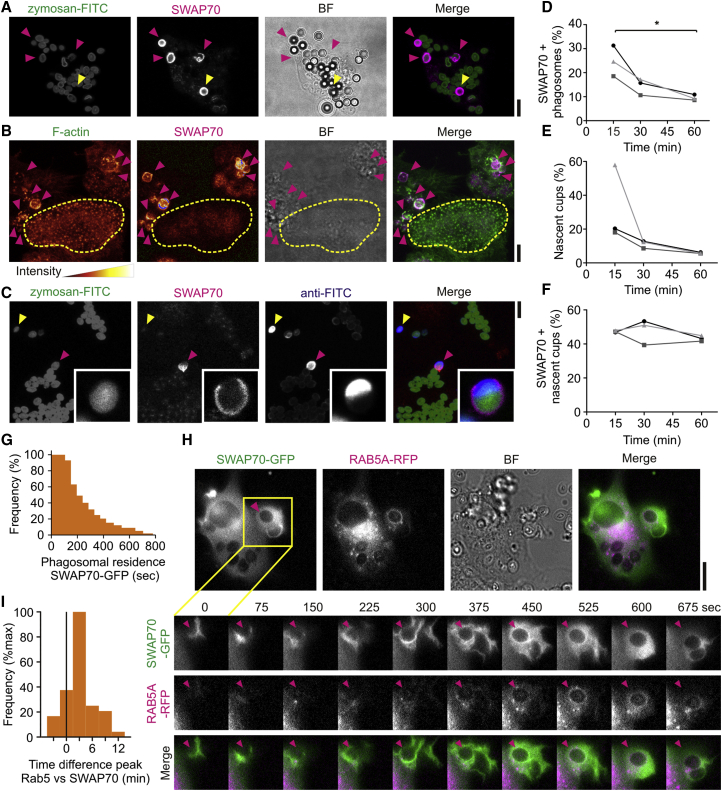
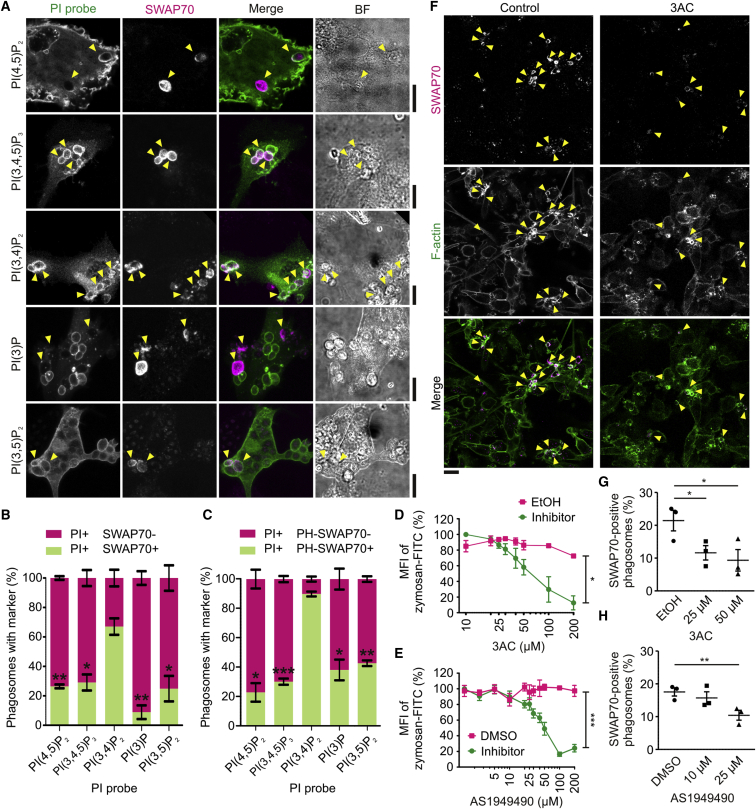
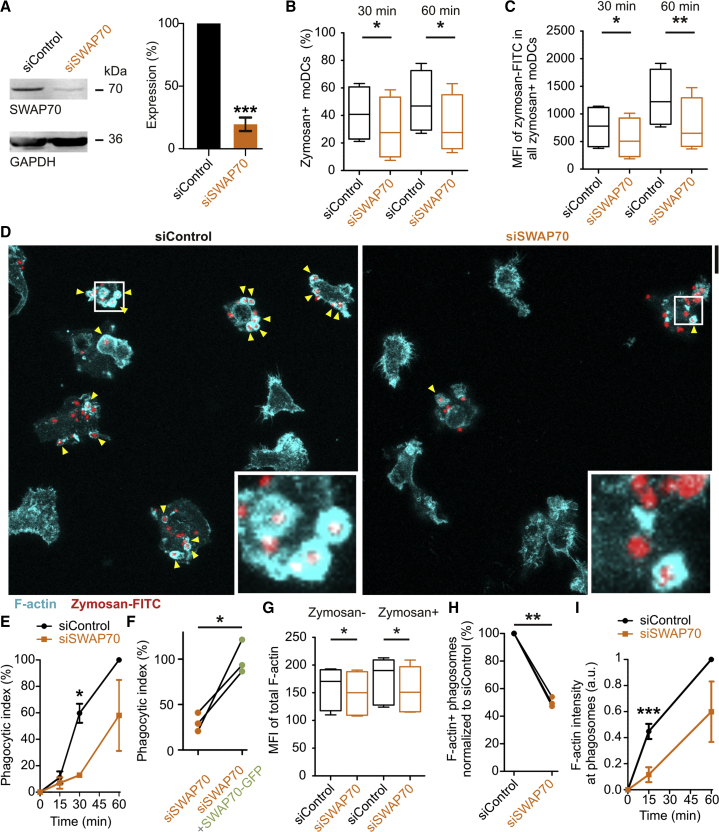
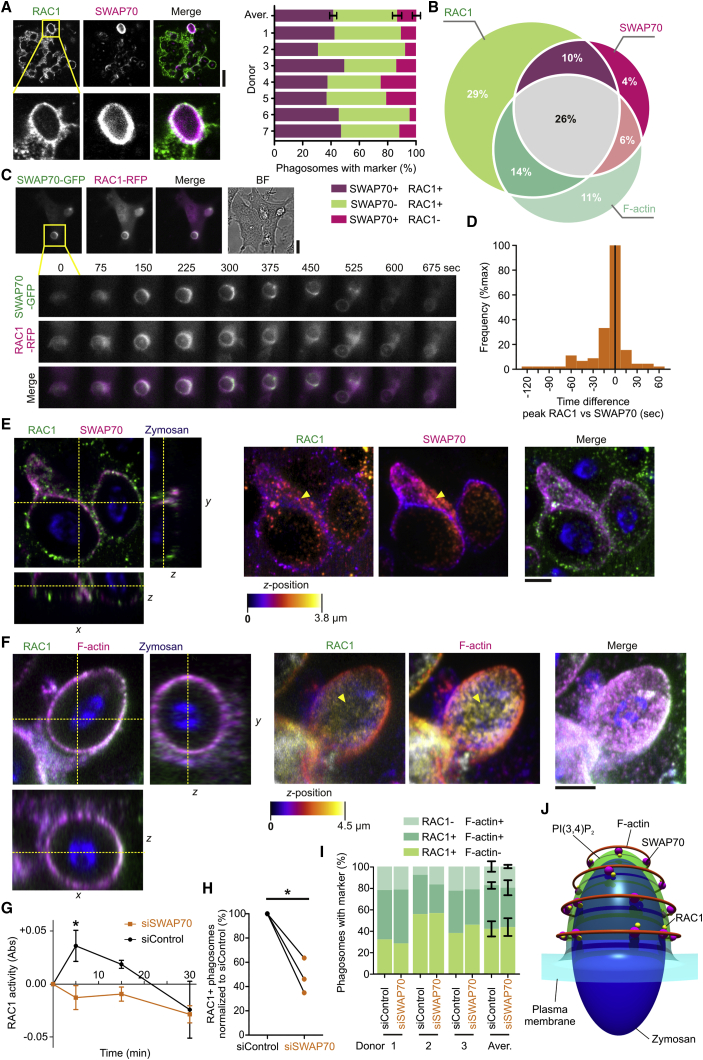
Actin plays a critical role during the early stages of pathogenic microbe internalization by immune cells. In this study, we identified a key mechanism of actin filament tethering and stabilization to the surface of phagosomes in human dendritic cells. We found that the actin-binding protein SWAP70 is specifically recruited to nascent phagosomes by binding to the lipid phosphatidylinositol (3,4)-bisphosphate. Multi-color super-resolution stimulated emission depletion (STED) microscopy revealed that the actin cage surrounding early phagosomes is formed by multiple concentric rings containing SWAP70. SWAP70 colocalized with and stimulated activation of RAC1, a known activator of actin polymerization, on phagosomes. Genetic ablation of SWAP70 impaired actin polymerization around phagosomes and resulted in a phagocytic defect. These data show a key role for SWAP70 as a scaffold for tethering the peripheral actin cage to phagosomes.

Keywords: Rac1; STED microscopy; SWAP70; actin; cytoskeleton; dendritic cell; phagocytosis; phosphatidylionositol 3,4-bisphosphate; phosphoinositides; rho-GTPases.


Figures

None
Graphical abstract
Figure 1
Figure 1
SWAP70 Aligns with Actin Filaments on the Phagosomal Surface (A) Confocal micrograph of zymosan pulsed dendritic cells immunostained for SWAP70 (magenta in merge) and F-actin (green). Pink arrowheads, double-positive phagosomes; yellow arrowheads, phagosomes only positive for SWAP70; BF, bright field. (B) Quantification of (A). Aver., average ± SEM (∼100 cells/donor). (C) Live cell imaging of zymosan-pulsed dendritic cells expressing SWAP70-GFP (green in merge) and LifeAct-RFP (magenta). The inset shows a time series during zymosan uptake. See also Movie S1. (D) Quantification from (C). The histogram shows the time difference of peak recruitment of SWAP70-GFP and LifeAct-RFP based on fluorescence intensities (40 phagosomes). Negative values indicate that LifeAct was recruited prior to SWAP70 and positive values later than SWAP70. (E) Confocal (top) and super-resolution 3D-STED (bottom) microscopy of dendritic cells pulsed with zymosan (blue) and immunostained for SWAP70 (magenta). (F and G) 3D-reconstructions of the STED from (E). Often, parallel arches (F) (yellow arrowheads and depicted in the insets) and rings (G) of SWAP70 were visible. This is more clear in the 3D-rotations (Movies S2, S3, S4, S5, and S6). (H–J) Same as (F) and (G) but now with co-staining for F-actin (green). Shown are cross-section and orthogonal sections (H; indicated by dashed yellow lines), the maximum intensity surface projection (I), and maximum intensity height maps (J). Note the overlap of SWAP70 and F-actin on the surface of the phagosome (yellow arrowhead). Scale bars, 10 μm (A and C); 2 μm (E–H). See also Movie S7.
Figure 2
Figure 2
SWAP70 Is Recruited to Nascent Phagosomes (A) Human dendritic cells were pulsed with a combination of FITC-labeled zymosan (zymosan-FITC; green in merge) and latex beads followed by immunostaining for SWAP70 (magenta). SWAP70 was recruited to both zymosan (pink arrowheads) and latex beads (yellow arrowhead). BF, bright field. See also Figure S1A. (B) Maximum intensity z projection of zymosan-pulsed dendritic cells immunostained for SWAP70 (magenta) and F-actin (green). F-actin and SWAP70 are shown in the fire look-up-table to emphasize the low recruitment of SWAP70 to podosomes (podosome region encircled in yellow) compared to phagosomes (pink arrowheads). (C) Identification of nascent cups by labeling of zymosan-FITC (green) with an antibody (blue; anti-FITC) in absence of permeabilization. Only free zymosan particles (yellow arrowhead) and nascent cups (pink) were accessible to anti-FITC labeling. Inset: magnification of a nascent cup. See also Movie S8. (D–F) Phagosomes in dendritic cells from three different donors over time of uptake (∼70 cells/donor/time point) were analyzed for the fraction of SWAP70-positive phagosomes (D), the fraction of nascent cups to total phagosomes (E), and the fraction of SWAP70-positive nascent cups to all SWAP70-positive phagosomes (F). (G) Residence time of SWAP70-GFP on phagosomes quantified based on live cell imaging (150 phagosomes). (H) Live cell imaging of dendritic cells expressing SWAP70-GFP (green in merge) and RAB5A-RFP (magenta). The inset shows a time series during zymosan uptake (arrowhead). See also Figures S1B–S1E and Movie S9. (I) Quantification from (H). The histogram shows the time difference of peak recruitment of SWAP70-GFP and RAB5A-RFP based on fluorescence intensities (50 phagosomes). Negative values indicate that RAB5A was recruited prior to SWAP70 and positive values later than SWAP70. Scale bars, 10 μm.
Figure 3
Figure 3
Phagosomal SWAP70 Is Mainly Recruited by PI(3,4)P2 (A) Confocal images of zymosan-pulsed dendritic cells expressing GFP-tagged phosphoinositide-probes (PI probe; green in merge) and immunolabeled for SWAP70 (magenta). The following PI probes were used: the PH-domain of PLCδ1 for PI(4,5)P2, the PH-domain of AKT for PI(3,4,5)P3, the PH-domain of TAPP2 for PI(3,4)P2, the PX-domain of NCF4 for PI(3)P, and the N-terminal sequence of MCOLN1 for PI(3,5)P2. Yellow arrowheads, phagosomes positive for SWAP70; BF, bright field. See also Figure S2 and Movies S10, S11, S12, and S13. (B) The percentages of phagosomes positive for the phosphoinositide biomarkers and endogenous SWAP70 (mean ± SEM for three donors; >60 phagosomes/condition). (C) Same as (B) but now with the mCherry-tagged PH-domain of SWAP70 (PH-SWAP70; mean ± SEM for three donors). See also Figures S3A–S3C. (D) Phagocytosis capacity with the SHIP1 inhibitor 3AC by flow cytometry. MFI, mean fluorescence intensity of the zymosan-FITC signal (mean ± SEM for three donors). EtOH, ethanol solvent control. See also Figure S3D. (E) Same as (D) but now for the SHIP2 inhibitor AS1949490. DMSO, solvent control. See also Figure S3E. (F) Confocal micrographs of dendritic cells pulsed with zymosan in the presence or absence of 25 μM 3AC. Yellow arrowheads, phagosomes positive for SWAP70. (G and H) Quantification of SWAP70-positive phagosomes after 30 min internalization for the 3AC (G) and AS1949490 (H) concentrations indicated (mean ± SEM for three donors; >80 phagosomes/donor/condition). Scale bars, 10 μm (A), 20 μm (F). See also Figures S3F–S3K and S4.
Figure 4
Figure 4
SWAP70 Regulates Phagocytosis and Phagosomal F-Actin (A) Knockdown of dendritic cells with control (black, siControl) or SWAP70 siRNA (orange, siSWAP70) quantified by western blot (mean ± SEM). GAPDH, loading control. (B) Dendritic cells with siSWAP70 were pulsed with FITC-labeled zymosan. Zymosan-positive cells were quantified by FACS after 30 and 60 min for at least four donors. See also Figures S5A and S5B. (C) The total zymosan-FITC signal for the zymosan-positive cells from (B). MFI, mean fluorescence intensity. See also Figures S5C and S5D. (D) Confocal micrographs of FITC-labeled zymosan (red) pulsed dendritic cells with siControl (left) or siSWAP70 (right). F-actin was stained with phalloidin (cyan). Yellow arrowheads, F-actin positive phagosomes. Scale bar, 20 μm. (E) Quantification of phagocytosis from (D) (mean ± SEM; >40 cells/donor/condition). (F) Rescue experiment of phagocytosis for dendritic cells with siSWAP70 and SWAP70-GFP (individual donors shown). See also Figures S5E and S5F. (G) The MFI of phalloidin labeling in the zymosan-positive and -negative populations of cells from (B). (H) Percentage of phalloidin-positive phagosomes from (D). (I) Quantification of the phalloidin signals of F-actin-positive phagosomes from (D). See also Figures S5G, S5H, and S6.
Figure 5
Figure 5
SWAP70 Promotes Phagosomal RAC1 Activity (A) Confocal micrographs and quantification of RAC1 (green in merge) and SWAP70 (magenta) positive phagosomes for seven donors (∼100 cells/donor). Aver., average ± SEM. (B) Venn diagram showing phagosomal distribution of RAC1, F-actin, and SWAP70. (C) Live cell imaging of dendritic cells expressing SWAP70-GFP (green in merge) and RAC1-RFP (magenta). The inset shows a time series during zymosan uptake. BF, bright field. See also Movie S14. (D) Quantification from (C). The histogram shows the time difference of peak recruitment of SWAP70-GFP and RAC1-RFP based on fluorescence intensities (88 phagosomes). Negative values indicate that RAC1 was recruited prior to SWAP70 and positive values later than SWAP70. (E and F) Multicolor 3D-STED microscopy of zymosan-pulsed dendritic cells immunostained for RAC1 (green) and SWAP70 (magenta; E) or F-actin (F). Left: cross-section and orthogonal sections (indicated by dashed yellow lines). Middle: maximum intensity height maps. Right: maximum intensity surface projection. Yellow arrowheads, overlap of RAC1 with SWAP70 (E) or F-actin (F) on the surface of the phagosomes. See also Movies S15 and S16. (G) RAC1 activation upon control (siControl) and SWAP70 siRNA (siSWAP70) after zymosan addition by G-LISA assay (Abs, absorbance units at 490 nm; mean ± SEM). The background (t = 0) is from cells without zymosan. (H) RAC1-positive phagosomes upon siControl and siSWAP70 counted by microscopy (>20 cells/donor/condition analyzed; individual donors shown). (I) Phagosomes positive for F-actin and/or RAC1 with siControl or siSWAP70. (J) Model of F-actin cage formation by SWAP70. SWAP70 is recruited to phagosomes by coincidence detection. Scale bars: 10 μm (A and C), 2 μm (E and F).

References

    1. Allen L.A., Aderem A. Mechanisms of phagocytosis. Curr. Opin. Immunol. 1996;8:36–40. - PubMed
    1. Anes E., Kühnel M.P., Bos E., Moniz-Pereira J., Habermann A., Griffiths G. Selected lipids activate phagosome actin assembly and maturation resulting in killing of pathogenic mycobacteria. Nat. Cell Biol. 2003;5:793–802. - PubMed
    1. Bahaie N.S., Hosseinkhani M.R., Ge X.N., Kang B.N., Ha S.G., Blumenthal M.S., Jessberger R., Rao S.P., Sriramarao P. Regulation of eosinophil trafficking by SWAP-70 and its role in allergic airway inflammation. J. Immunol. 2012;188:1479–1490. - PMC - PubMed
    1. Baranov M.V., Ter Beest M., Reinieren-Beeren I., Cambi A., Figdor C.G., van den Bogaart G. Podosomes of dendritic cells facilitate antigen sampling. J. Cell Sci. 2014;127:1052–1064. - PMC - PubMed
    1. Biswas P.S., Gupta S., Stirzaker R.A., Kumar V., Jessberger R., Lu T.T., Bhagat G., Pernis A.B. Dual regulation of IRF4 function in T and B cells is required for the coordination of T-B cell interactions and the prevention of autoimmunity. J. Exp. Med. 2012;209:581–596. - PMC - PubMed

Publication types

MeSH terms