. 2016 Nov 29;7(48):79722-79735.
doi: 10.18632/oncotarget.12944.

Inhibiting glutaminase in acute myeloid leukemia: metabolic dependency of selected AML subtypes

Affiliations

Inhibiting glutaminase in acute myeloid leukemia: metabolic dependency of selected AML subtypes

Polina Matre et al. Oncotarget. .

Abstract

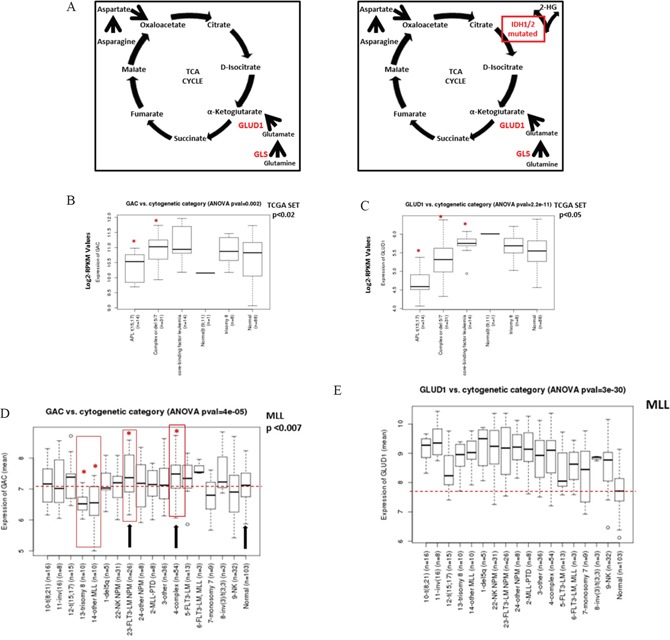
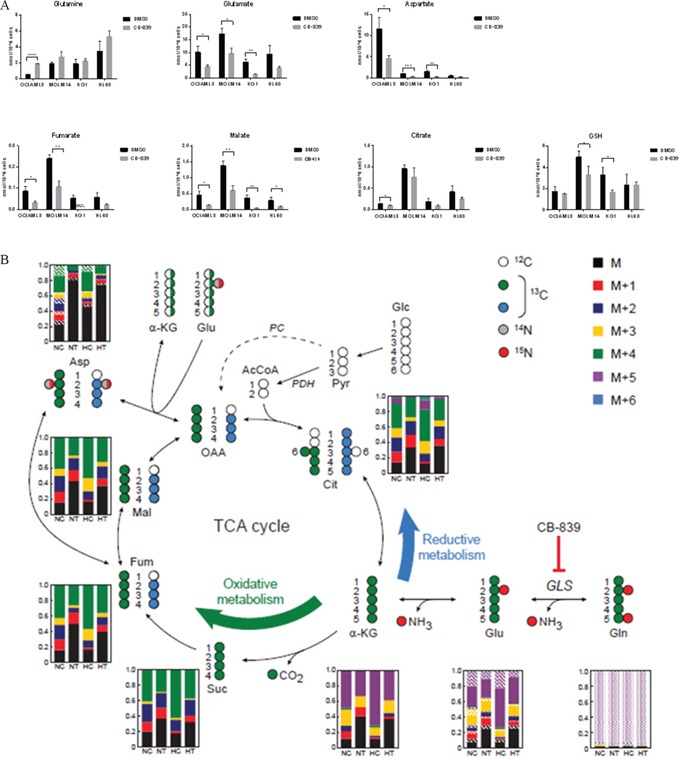
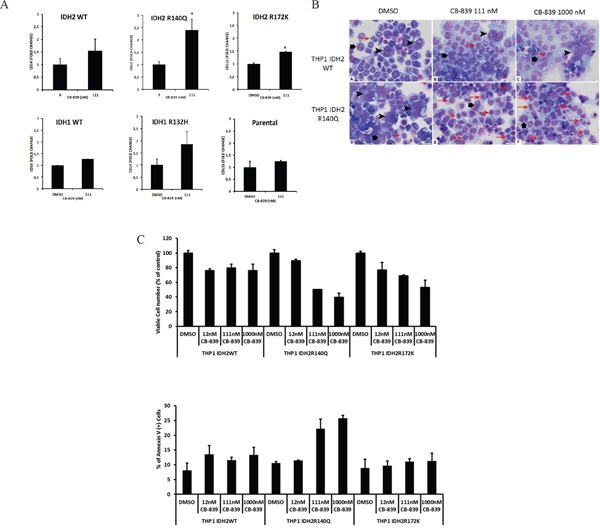
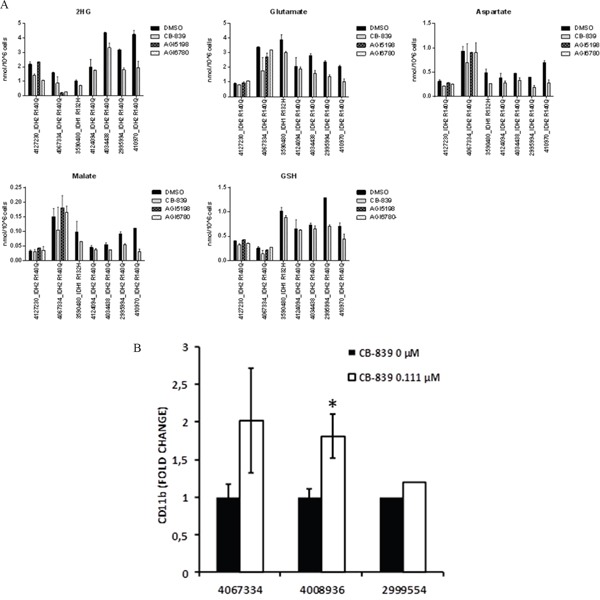
Metabolic reprogramming has been described as a hallmark of transformed cancer cells. In this study, we examined the role of the glutamine (Gln) utilization pathway in acute myeloid leukemia (AML) cell lines and primary AML samples. Our results indicate that a subset of AML cell lines is sensitive to Gln deprivation. Glutaminase (GLS) is a mitochondrial enzyme that catalyzes the conversion of Gln to glutamate. One of the two GLS isoenzymes, GLS1 is highly expressed in cancer and encodes two different isoforms: kidney (KGA) and glutaminase C (GAC). We analyzed mRNA expression of GLS1 splicing variants, GAC and KGA, in several large AML datasets and identified increased levels of expression in AML patients with complex cytogenetics and within specific molecular subsets. Inhibition of glutaminase by allosteric GLS inhibitor bis-2-(5-phenylacetamido-1, 2, 4-thiadiazol-2-yl) ethyl sulfide or by novel, potent, orally bioavailable GLS inhibitor CB-839 reduced intracellular glutamate levels and inhibited growth of AML cells. In cell lines and patient samples harboring IDH1/IDH2 (Isocitrate dehydrogenase 1 and 2) mutations, CB-839 reduced production of oncometabolite 2-hydroxyglutarate, inducing differentiation. These findings indicate potential utility of glutaminase inhibitors in AML therapy, which can inhibit cell growth, induce apoptosis and/or differentiation in specific leukemia subtypes.

Keywords: differentiation therapy; glutamine; leukemia; metabolism; microenvironment.


Conflict of interest statement

CONFLICTS OF INTEREST

Weiqun Li, Ph.D. and Taotao Wang, M.S are current employees of Calithera Biosciences.

Figures

Figure 1
Figure 1. Expression of GAC and GLUD1 in TCGA and MLL AML datasets respectively
A. Principal genes related to Gln metabolism. B. Boxplot comparing expression values of GAC and C. GLUD1 from the TCGA AML dataset. Expression represents batch-effect adjusted, normalized, log2-transformed RPKM (Reads per Kilobase of transcript per Million mapped reads) values. D. GAC and E. GLUD1 expression from the MLL AML dataset in different cytogenetic abnormality categories. The p-values were determined by ANOVA. Asterisk and red boxes denote categories with statistically significant higher GAC expression compared to healthy normal donors; median GAC in normal controls is shown by dotted red line. NK NPM, AML with normal karyotype, NPM-mutant; FLT3-LM NPM, AML with normal karyotype, FLT3-ITD length mutation and NPM-co-mutated; NK, normal karyotype AML.
Figure 2
Figure 2. Viability and apoptosis of leukemic cell lines and AML primary samples after Gln deprivation and GLS1 inhibition by CB-839
A. Expression of GLS isoforms, GAC and KGA in leukemic cell lines. AML cell lines showed high expression levels of the KGA and GAC isoform. The expression of the full length GLS protein KGA (669 aa) and the shorter isoform GAC (598 aa) was determined in a panel of leukemia (n=10) by Western blotting using GAC- specific antibody (top panel) and an antibody that binds to both GAC and KGA isoforms (bottom panel). B-D. The percentage of viable leukemia cells among cells treated with Gln deprivation or GLS1 inhibition by CB-839 was normalized to the percentage of viable cells in control samples measured after 3 days of culture by multicolor flow cytometry. C-E. Levels of specific apoptosis in CB-839–treated cell lines relative to control, measured by annexing V flow cytometry. F. The percent of viable AML blast cells (blast gate determined based on CD45/side scatter) in treated samples normalized to viable AML blasts in controls was measured after 72 hours by flow cytometry (n=21).
Figure 3
Figure 3. CB-839 blocks Gln utilization in AML cells
A. CB-839 treatment induced moderate accumulation of Gln and decreased cellular levels of glutamate Glu, aspartate, TCA acid cycle intermediates, and GSH in AML cell lines. B. In SIRM analysis, incorporation of 13C5, 15N2 Gln into Krebs cycle intermediates via oxidative and reductive metabolism of Gln. Molecular structures of Krebs cycle intermediates are represented as follows: white circles represent 12C, green and blue circles indicate 13C atoms, and grey and red circles correspond to 14N and 15N atoms, respectively. For simplicity, only the first round of the Krebs cycle is shown and the contribution of carbons derived from glucose through pyruvate carboxylase (PC; dashed arrow) is not shown. The bar graphs represent the relative fractions of 13C- and/or 15N-enriched compounds measured by LC-MS. Average levels from four replicate samples are shown. Solid color bars indicate different units of 13C enrichment (as per legend) without 15N enrichment, oblique lines and dotted areas correspond to 15N enrichment of one and two N atoms, respectively. NC and HC, control cells under normoxic and hypoxic conditions; NT and HT, cells treated with CB-839 under normoxic and hypoxic conditions, respectively.
Figure 4
Figure 4. CB-839 treatment promotes growth arrest and differentiation in THP-1 cell lines with mutant IDH1/2
A. wild-type IDH1/2 or doxycycline-inducible mutants IDH2-R140-R172 were exposed to CB-839 for 8 days. Expression of differentiation marker CD14 was determined through multicolor flow cytometry. B. Morphological signs of differentiation induced by CB-839 treatment in THP-1 cells stably transduced with WT IDH2 or IDH2-R140Q were determined with hematoxylin-eosin staining after 8 days of treatment. The composite figure illustrates representative cytospin preparations of IDH2 WT (A-C) and mutant IDH2-R140 (D-F) cells. The control samples (A, D) demonstrated a mixture of predominantly giant anaplastic cells (arrowheads) and moderately differentiated medium-sized cells (large arrows) with relatively few small differentiated cells (small red arrows). Treatment with CB-839 111 nM (B) or CB-839 1000 nM (C) did not change IDH2 WT cell composition of the sample. In contrast, treatment with CB-839 111 nM (E) or CB-839 1000 nM (F) resulted in significant differentiation of IDH2-R140–mutated cells, which is supported by the disappearance of giant anaplastic cells and marked increase in small differentiated cells. C. Viability and apoptosis in THP-1 cells transduced with WT-IDH2, IDH2-R140Q, or IDH2-R172K cells were measured by flow cytometry.
Figure 5
Figure 5. CB-839 induces metabolic changes in IDH1/2 mutant AML patient samples
A. CB-839 treatment decreased cellular levels of 2-HG, Glu, aspartate, malate, and GSH in IDH1/IDH2–mutant AML patient samples. Intracellular metabolite levels were measured in primary AML samples after treatment with CB-839 (1 μM), IDH1 inhibitor AGI-5198 (500 nM), or IDH2 inhibitor AGI-6780 (500 nM) for 24 hours (4127230; 3590480; 4124094) or 96 hours (4067334, 4034438; 2995994). B. Flow cytometry analysis in IDH2-R140Q (4067334)–, IDH1-R132C (4008936), and IDH2-R140Q (2995994) mutated AML samples showed an increase in a fraction of CD11b+ cells after treatment with CB-839 (0.111 μM). Because of limited sample size, triplicate measurements could not be performed in sample number 2995994.

References

    1. Wise DR, DeBerardinis RJ, Mancuso A, Sayed N, Zhang XY, Pfeiffer HK, Nissim I, Daikhin E, Yudkoff M, McMahon SB, Thompson CB. Myc regulates a transcriptional program that stimulates mitochondrial glutaminolysis and leads to glutamine addiction. Proc Natl Acad Sci U S A. 2008;10548:18782–18787. - PMC - PubMed
    1. Wang JB, Erickson JW, Fuji R, Ramachandran S, Gao P, Dinavahi R, Wilson KF, Ambrosio AL, Dias SM, Dang CV, Cerione RA. Targeting mitochondrial glutaminase activity inhibits oncogenic transformation. Cancer Cell. 2010;183:207–219. - PMC - PubMed
    1. Gross MI, Demo SD, Dennison JB, Chen L, Chernov-Rogan T, Goyal B, Janes JR, Laidig GJ, Lewis ER, Li J, Mackinnon AL, Parlati F, Rodriguez ML, Shwonek PJ, Sjogren EB, Stanton TF, Wang T, Yang J, Zhao F, Bennett MK. Antitumor activity of the glutaminase inhibitor CB-839 in triple-negative breast cancer. Mol Cancer Ther. 2014;134:890–901. - PubMed
    1. Robinson MM, McBryant SJ, Tsukamoto T, Rojas C, Ferraris DV, Hamilton SK, Hansen JC, Curthoys NP. Novel mechanism of inhibition of rat kidney-type glutaminase by bis-2-(5-phenylacetamido-1,2,4-thiadiazol-2-yl)ethyl sulfide (BPTES) The Biochemical journal. 2007;4063:407–414. - PMC - PubMed
    1. DeLaBarre B, Gross S, Fang C, Gao Y, Jha A, Jiang F, Song JJ, Wei W, Hurov JB. Full-length human glutaminase in complex with an allosteric inhibitor. Biochemistry. 2011;5050:10764–10770. - PubMed

MeSH terms