. 2016 Nov 17;539(7629):378-383.
doi: 10.1038/nature20142. Epub 2016 Nov 2.

Forward-genetics analysis of sleep in randomly mutagenized mice

Affiliations

Forward-genetics analysis of sleep in randomly mutagenized mice

Hiromasa Funato et al. Nature. .

Abstract

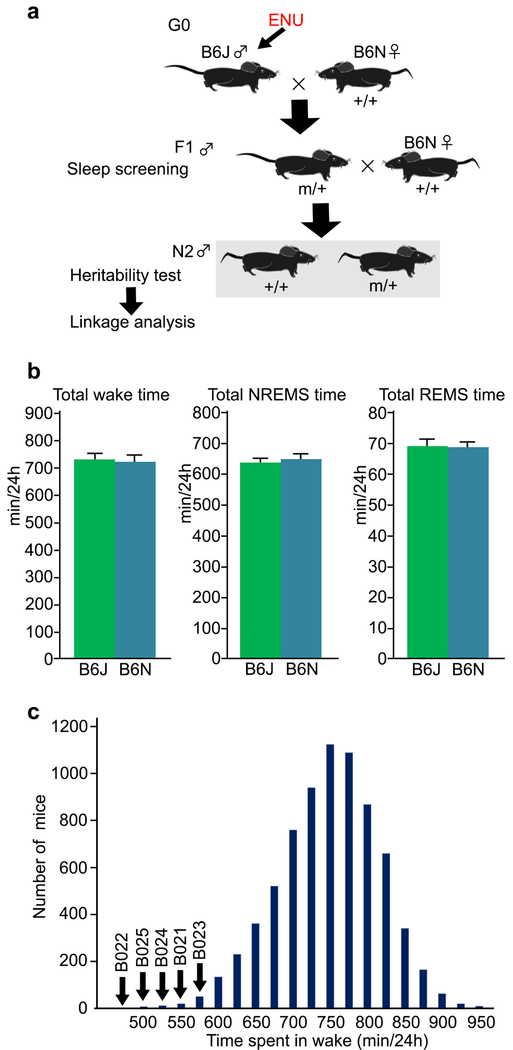
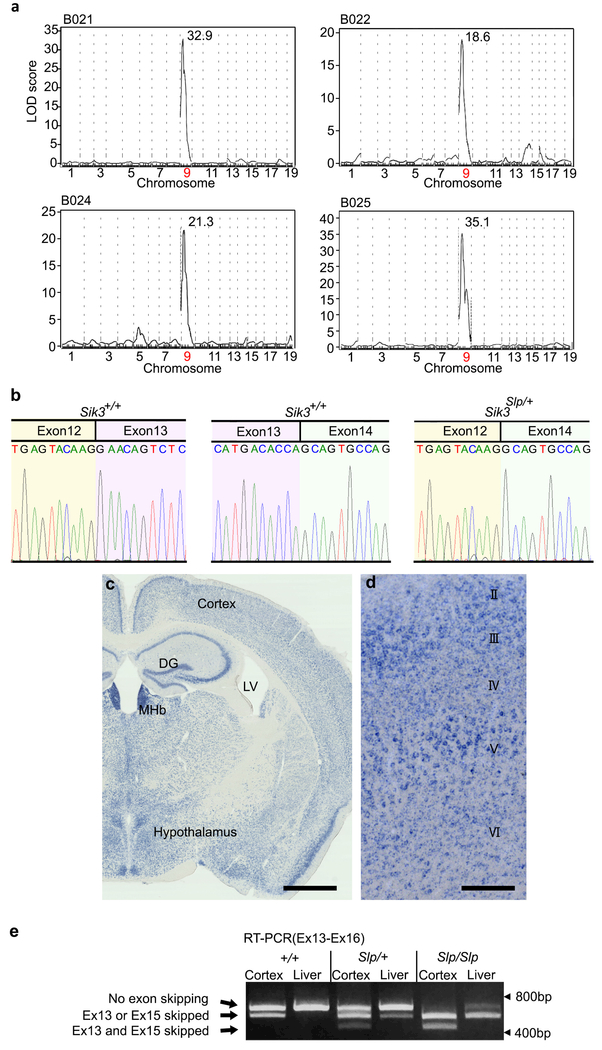
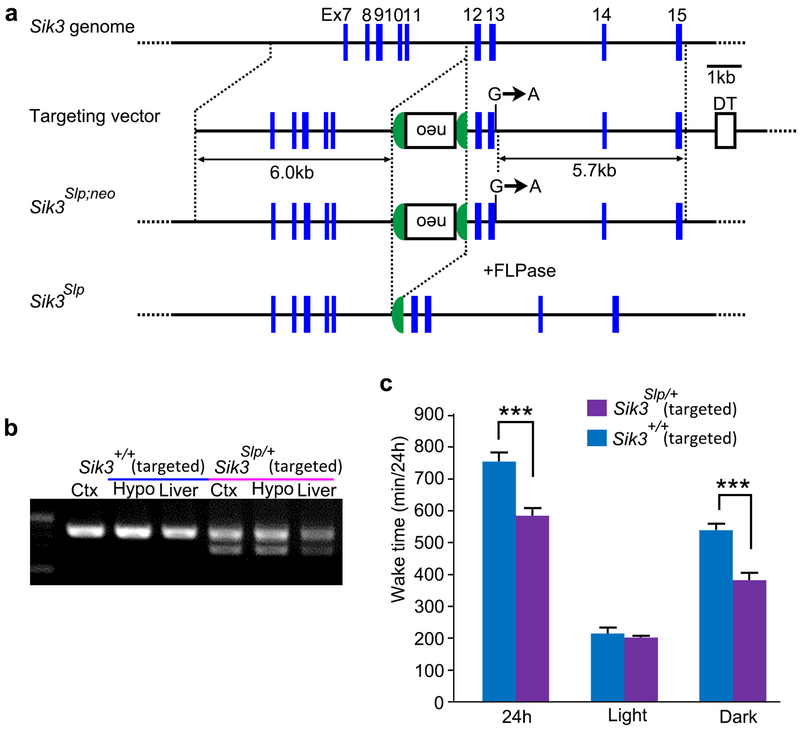
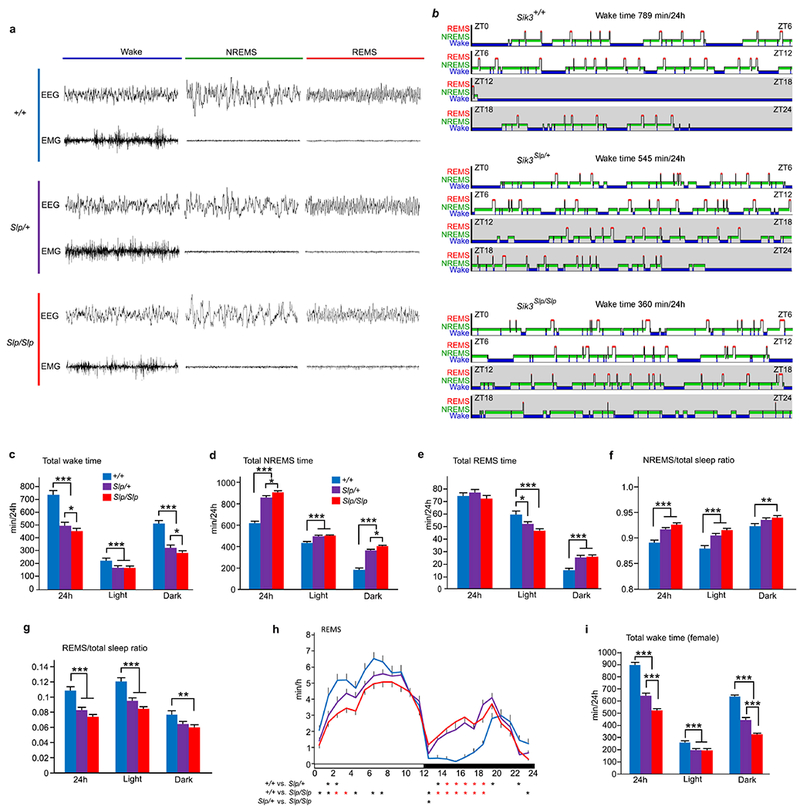
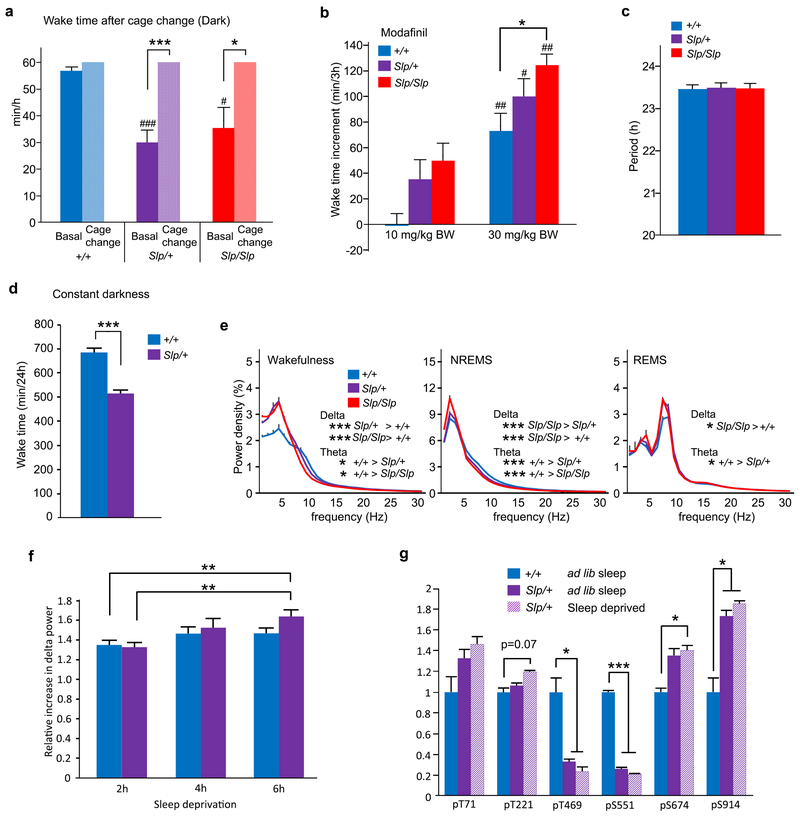
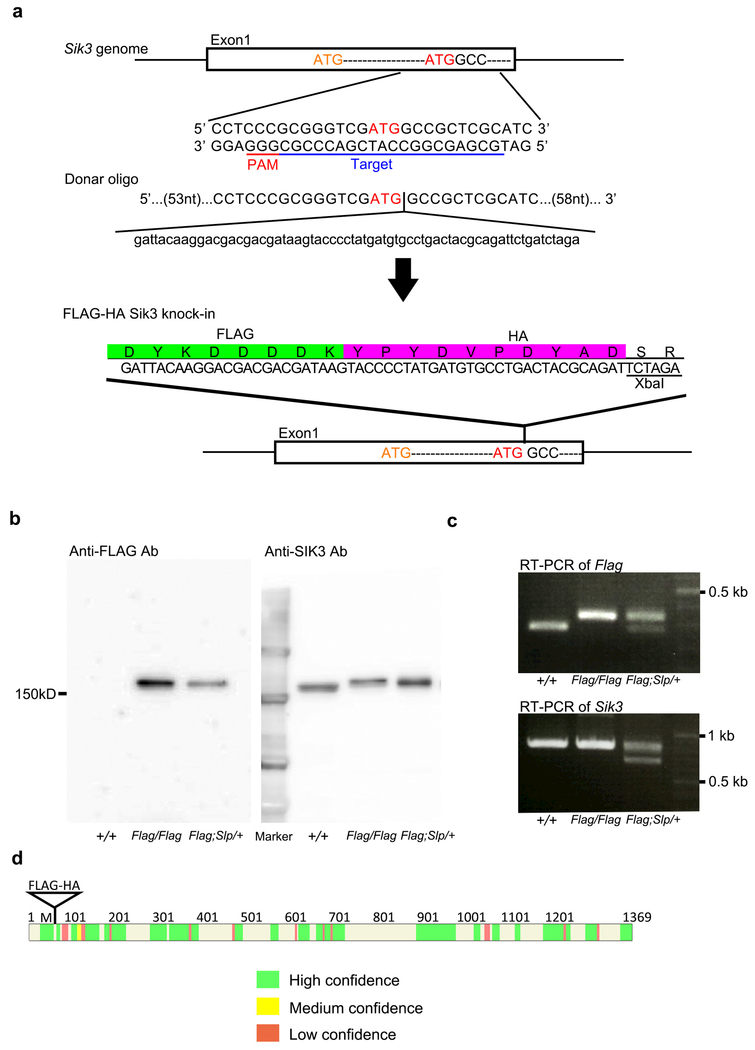
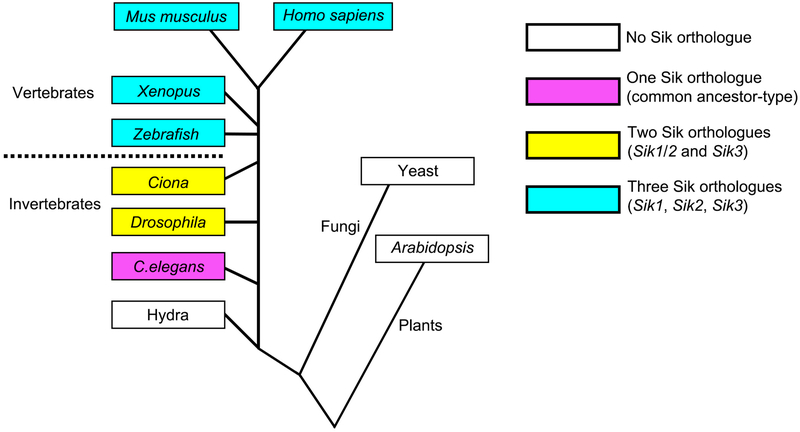
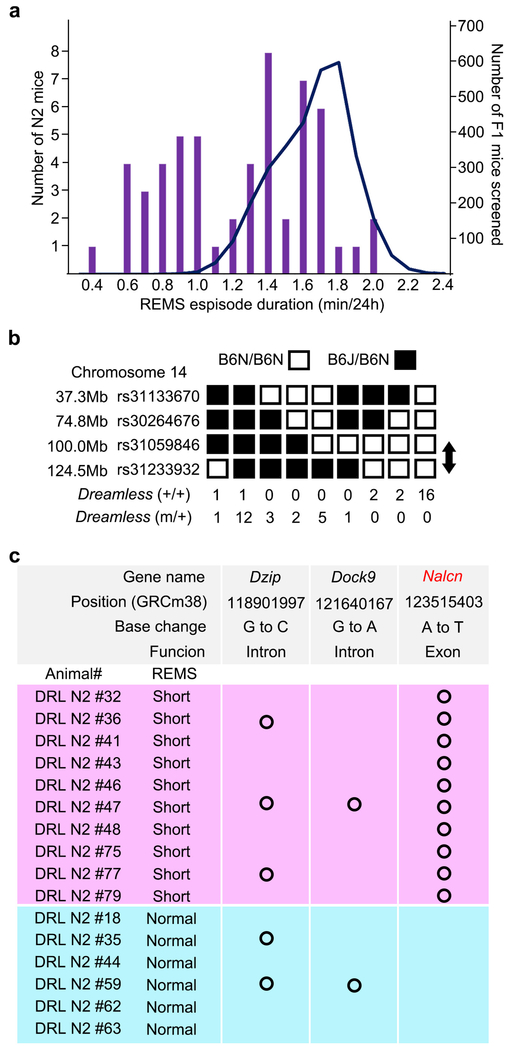
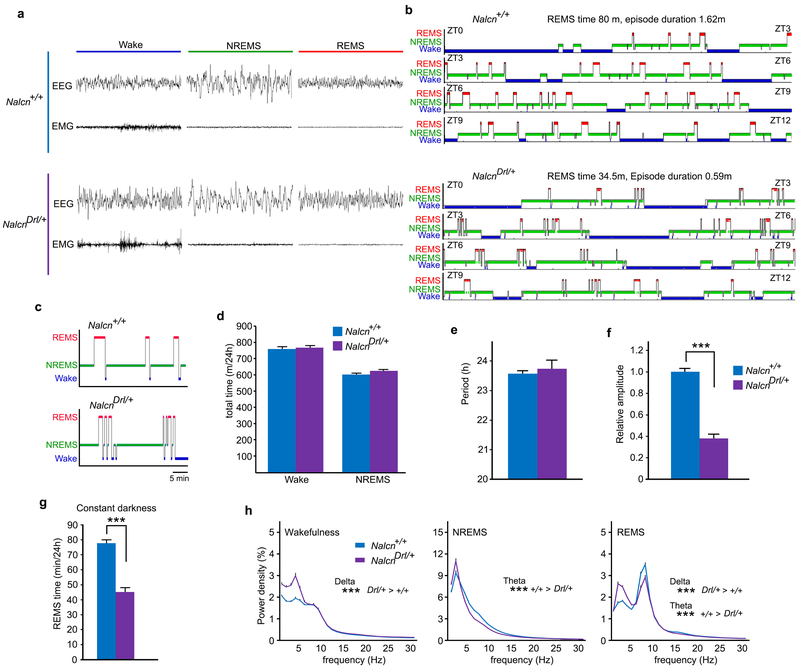
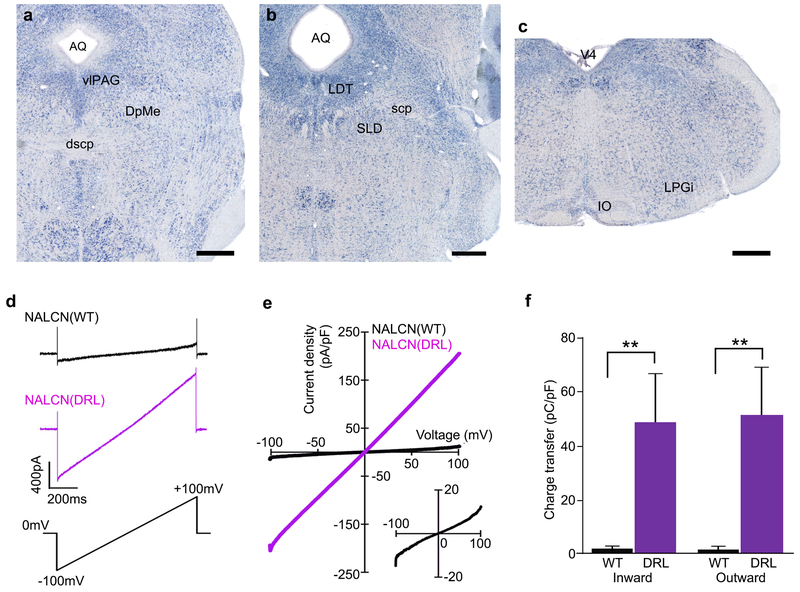
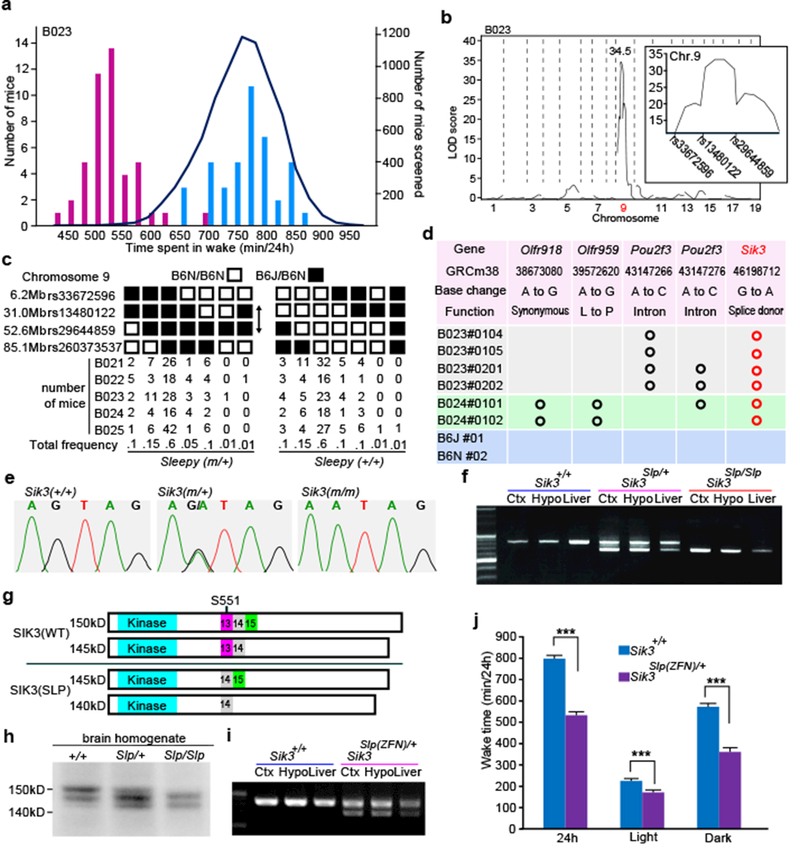
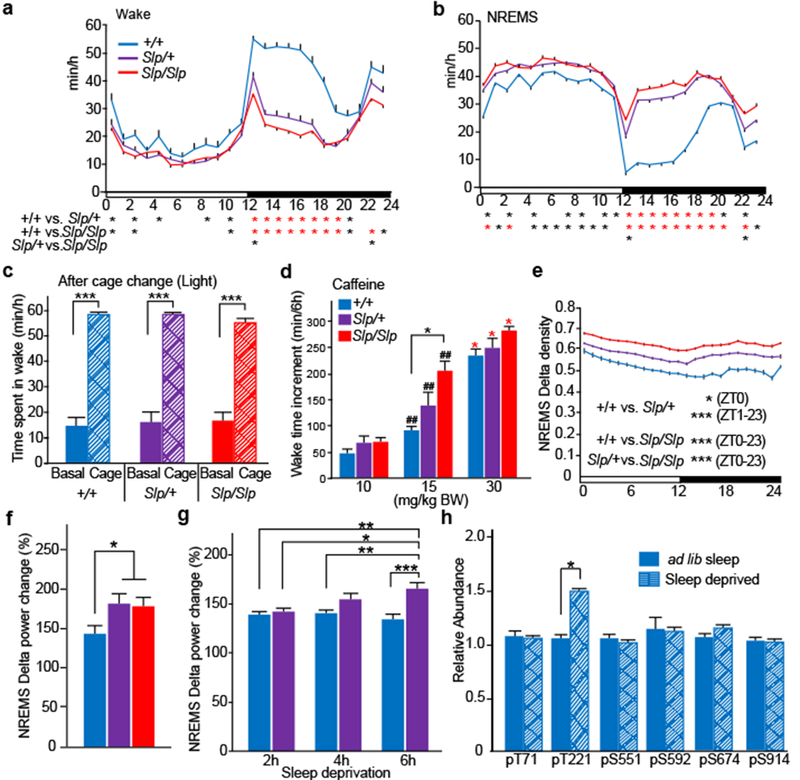
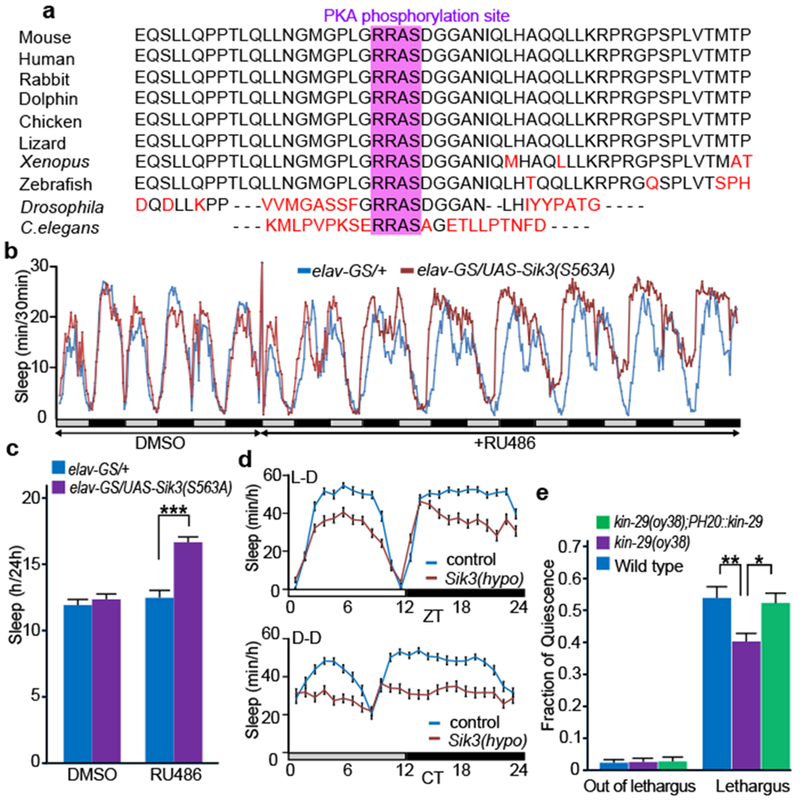
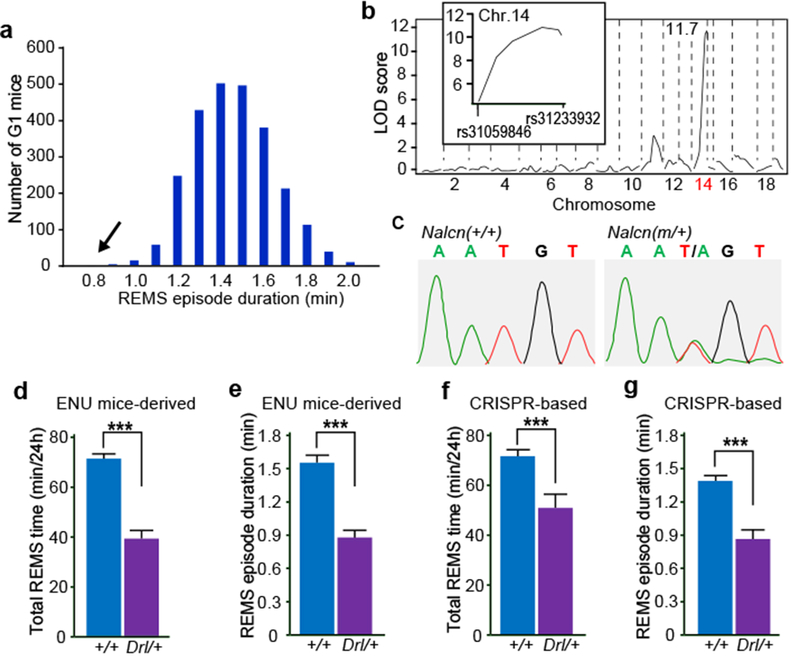
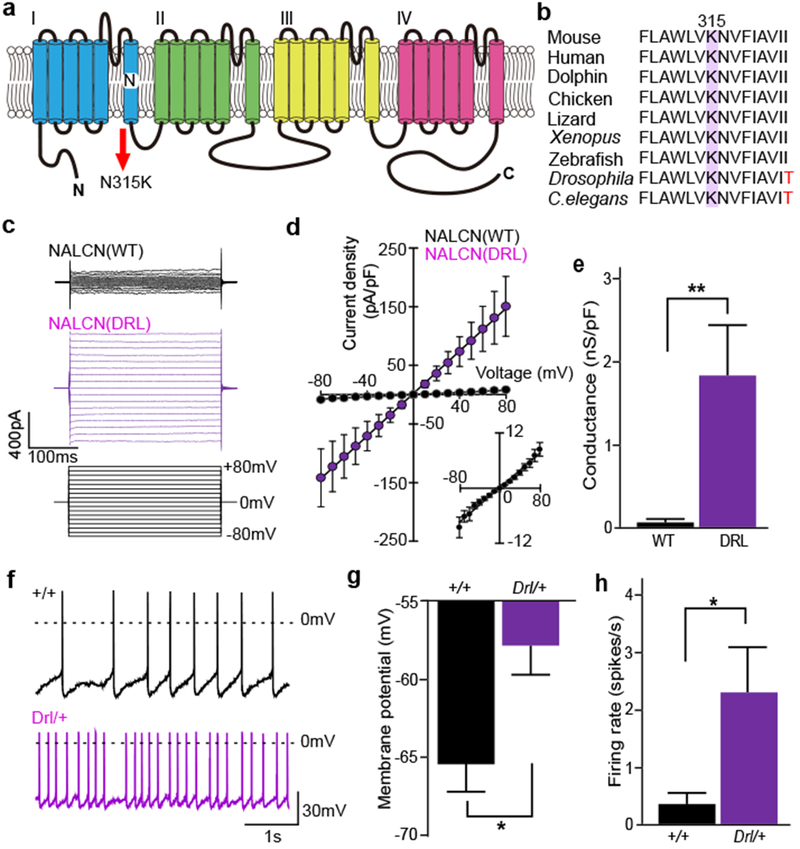
Sleep is conserved from invertebrates to vertebrates, and is tightly regulated in a homeostatic manner. The molecular and cellular mechanisms that determine the amount of rapid eye movement sleep (REMS) and non-REMS (NREMS) remain unknown. Here we identify two dominant mutations that affect sleep and wakefulness by using an electroencephalogram/electromyogram-based screen of randomly mutagenized mice. A splicing mutation in the Sik3 protein kinase gene causes a profound decrease in total wake time, owing to an increase in inherent sleep need. Sleep deprivation affects phosphorylation of regulatory sites on the kinase, suggesting a role for SIK3 in the homeostatic regulation of sleep amount. Sik3 orthologues also regulate sleep in fruitflies and roundworms. A missense, gain-of-function mutation in the sodium leak channel NALCN reduces the total amount and episode duration of REMS, apparently by increasing the excitability of REMS-inhibiting neurons. Our results substantiate the use of a forward-genetics approach for studying sleep behaviours in mice, and demonstrate the role of SIK3 and NALCN in regulating the amount of NREMS and REMS, respectively.


Conflict of interest statement

Author information

The authors declare no competing financial interests.

Figures

Extended Data Figure 1 |
Extended Data Figure 1 |. Sleep/wakefulness screening of randomly mutagenized mice.
a, ENU-treated G0 mice were mated with B6N females to obtain the offspring. The F1 mice were used for sleep/wakefulness analysis. A mouse showing any sleep abnormalities was crossed with B6N female mice. The N2 progeny was examined for heritability of sleep abnormality and for chromosomal mapping, b, B6J (n = 20) and B6N (n = 21) showed similar the total wake time (left, P = 0.67, two-tailed Student’s t-test). NREMS time (center, P = 0.66) and REMS time (right, P = 0.84). Values are means ± sem. c, The histogram shows total daily wake time of all mice screened. Total wake time of screened mice was 735 ± 66.9 min (mean ± SD). Arrows indicate the founders of Sleepy mutant pedigree.
Extended Data Figure 2 |
Extended Data Figure 2 |. QTL analysis of Sleepy mutant pedigrees and characterization of Sik3 transcript.
a, QTL analysis of B021 (n = 119), B022 (n = 95), B024 (n = 59) and B025 (n = 112) pedigrees for total wake time produced a single LOD score peak on chromosome 9. b, Direct sequencing of the exon 12/13 boundary and exon 13/14 boundary of Sik3 mRNA of Sik13+/+ mouse. Direct sequencing of the short RT-PCR product specific to Sik3 mutant mice shows the direct transition from exon 12 to exon 14. c-d, Sik3 mRNA is expressed broadly in forebrain neurons (c). Sik3 mRNA is expressed throughout the cerebral cortex in the primary motor area(d). DG, dentate gyrus; LV, lateral ventricle; MHb, medial habenula. Scale bars; 1 mm (c), 250 μm (d). e, RT-PCR of Sik3 mRNA from cerebral cortex and liver of Sik3+/+, Sik3Slp/+ and Sik3Slp/Slp mice. Normal Sik3 variant lacking exon 15 expressed in the cerebral cortex.
Extended Data Figure 3 |
Extended Data Figure 3 |. Sleep/wakefulness of Sik3Slp knock-in mice.
a, The structure of the Sik3 genome and targeting vector for Sik3Slp. Neomycin resistance gene under the mouse phosphoglycerol kinase promoter (neo) was sandwiched with the Flippase Recognition Target (FRT) sequences. The guanine at the fifth nucleotide from the beginning of the intron 13 was substituted with adenine. The neo cassette was deleted by crossing with beta-actinCAG-FLP knock-in mice, b, RT-PCR of Sik3 mRNA of Sik3Slp/+ knock-in mice, c, Total wake time of Sik3Slp/+ knock-in mice (n = 10) and Sik3+/+ littermates (n = 6). Two-way ANOVA followed by Tukey’s test. *** P < 0.001. Values are means ± sem.
Extended Data Figure 4 |
Extended Data Figure 4 |. Sleep/wakefulness behaviors of Sik3 mutant mice.
a, Representative 8s-EEG and EMG for wake, NREMS and REMS of Sik3 mutant mice, b, Representative hypnogram of Sik3 mutant mice. Wake (blue), NREMS (green) and REMS (red) are indicated from ZT0 to ZT24. c-g, Total wake time (c), NREMS time (d), REMS time (e), NREMS/total sleep ratio (f) and REMS/total sleep ratio (g) and circadian variation of REMS (h) of Sik3+/+ (n = 22), Sik3Slp/+ (n = 32) and Sik3Slp/Slp (n = 31) mice. For c-g, Two-way ANOVA followed by Tukey’s test. * P < 0.05, ** P < 0.01, *** P < 0.001. For h, One-way repeated measures ANOVA followed by Tukey’s test. Black asterisk, P < 0.05; Red asterisk, P < 0.001. i, Total wake time of female Sik3+/+ (n = 10), Sik3Slp/+ (n = 11) and Sik3Slp/Slp (n = 9) mice. Two-way ANOVA followed by Tukey’s test. *** P < 0.001. Values are means ± sem.
Extended Data Figure 5 |
Extended Data Figure 5 |. Characterization of Sleep/wakefulness behaviors of Sik3 mutant mice.
a, Wake time after cage change at ZT15 in Sik3+/+ (n = 5), Sik3Slp/+ (n = 10) and Sik3Slp/Slp (n = 5) mice. The graph shows time spent in wakefulness from ZT15 to ZT16 under a basal condition and after cage change from the home cage to a new cage at ZT15. One-way repeated measures ANOVA followed by Tukey’s test. * P < 0.05, *** P < 0.001; vs. Sik3+/+, #P < 0.05, ### P < 0.001. b, Wake time increase for 3 h after modafinil injection at ZT0 to Sik3+/+ (n = 6), Sik3Slp/+ (n = 6) and Sik3Slp/Slp (n = 6) mice. Two-way ANOVA followed by Tukey’s test. * P < 0.05; vs modafinil 10 mg/kg in the same genotype # P < 0.05, ## P < 0.01. c, The circadian period under constant darkness in Sik3 (n = 8), Sik3Slp/+ (n = 8) and Sik3Slp/Slp (n = 6) mice. One-way ANOVA. P = 0.97. d, Total wake time of Sik3+/+ (n = 9) and Sik3Slp/+ (n = 12) mice under constant darkness. Two-tailed Student’s /-test. *** P < 0.001. e, EEG power spectra of Sik3+/+ (n = 22), Sik3Slp/+ (n = 32) and Sik3Slp/Slp (n = 31) mice. One-way ANOVA followed by Tukey’s test. * P < 0.05, *** P < 0.001. f, Increase in NREMS delta power after 2 h-, 4 h- and 6 h-sleep deprivation of Sik3+/+ (n = 11) and Sik3Slp/+ (n = 11) mice relative to mean NREM delta power during basal sleep. Two-way ANOVA followed by Tukey’s test. ** P < 0.01. g, Phosphorylation of FLAG-SIK3 of Flag-Sik3+/+ brains and of FLAG-SIK3(SLP) of Flag-Sik3Slp/+ brains with or without 4-h sleep deprivation. Two-way ANOVA followed by Tukey’s test. * P < 0.05. *** P < 0.001. Values are means ± sem.
Extended Data Figure 6 |
Extended Data Figure 6 |. Characterization of Flag-Sik3 mice made by CRISPR/Cas9 technology.
a, Exon 1 of the Sik3 gene contains the first and second methionine residues. The single guide RNA was designed to target the second methionine-coding region. The donor oligo has a FLAG-HA-coding sequence immediately after the second methionine and 70-nucleotide long arms at both 5’ and 3’ ends. The FLAG-HA-coding region is followed by an XbaI site. b, Immunoblotting of brain homogenates of Sik3+/+, Sik3Flag/Flag Sik3Flag,Slp/+ mice showed that anti-FLAG antibody detected FLAG-SIK3 protein of Sik3Flag/Flag brains and FLAG-SIK3(SLP) protein of Sik3Flag,Slp/+ brains, whereas anti-Sik3 antibody detected SIK3 proteins of all genotype. c, RT-PCR of brain Sik3 mRNA of Sik3+/+, Sik3Flag/Flag, Sik3Flag,Slp/+ mice. d, Tryptic peptides of immunoprecipitated and gel-purified FLAG-SIK3 protein were analyzed by LC-MS and mapped on the reference SIK3 protein. The peptide fragments were mapped on almost entire SIK3 protein with high confidence.
Extended Data Figure 7 |
Phylogenetic conservation of SIK3 protein.
Extended Data Figure 8 |
Extended Data Figure 8 |. Identification of Nalcn mutation of the Dreamless mutant pedigree.
a, Histogram of REMS episode duration in N2 littermates of Dreamless mutant pedigree (bars) and all F1 mice examined (curve). b, Haplotype analysis of chromosome 14 of Dreamless mutant pedigree with or without short REMS episode duration. c, Whole exome sequencing of Dreamless mutant N2 mice. All mice with short REMS episode duration had the single nucleotide substitution in exon 9 of the Nalcn gene.
Extended Data Figure 9 |
Extended Data Figure 9 |. Sleep/wakefulness behavior of Nalcn mutant mice.
a, Representative 8s-EEG and EMG for wake, NREMS and REMS of Nalcn mutant mice b, Representative hypnogram of Nalcn+/+ mice (upper) and NalcnDrl/+ mice (lower). Wake (blue), NREMS (green) and REMS (red) are indicated from ZT0 to ZT12. c, Enlarged hypnogram of around ZT7 showed the frequent transitions between NREMS and REMS of NalcnDrl/+ mice, d, Total wake time and NREMS time of NalcnDrl/+ mice (n = 29) and Nalcn+/+ mice (n = 25). Wake, P = 0.58; NREMS, P = 0.17, One-way ANOVA. e-f, Circadian period length (e) and amplitude of circadian behavior (f) in constant darkness of NalcnDrl/+ mice (n = 6) and Nalcn+/+ mice (n = 7). Two-tailed Student’s t-test, (e) P = 0.76. (f) *** P < 0.001. g, Total REMS time of NalcnDrl/+ mice (n = 9) and Nalcn+/+ mice in constant darkness (n = 8). Two-tailed Student’s t-test. *** P < 0.001. h, EEG power spectra of NalcnDrl/+ mice (n = 29) and Nalcn+/+ mice (n = 25). One-way ANOVA followed by Tukey’s test. *** P < 0.001. Values are means ± sem.
Extended Data Figure 10 |
Extended Data Figure 10 |. Increased conductance of NALCN(DRL).
a-c, Nalcn mRNA is expressed in the ventrolateral periaqueductal grey mater (vlPAG) and deep mesencephalic nucleus (DpMe) of the upper pons (a), the lateral dorsal tegmental nucleus (LDT) and sublateral dorsal nucleus (SLD) of the lower pons (b), and the lateral paragigantocellular nucleus (LPGi) of the medulla (c). AQ, aqueduct; dscp, decussation of superior cerebellar peduncle; IO, inferior olive; scp, superior cerebellar peduncle. Scale bars, 500 μm. d, Representative traces of membrane currents in response to ramp pulses (Vh = 0 mV, from −100 mV to +100 mV in 1 s; lower) recorded from HEK293T cells cotransfected with mUNC80, SRC(Y529F), and NALCN-GFP (upper) or NALCN(DRL)-GFP (middle). The traces are averaged from 3 trials. The transient capacitance currents are also recorded. e, Mean current density in response to ramp pulses (NALCN, n = 5, black line; NALCN(DRL), n = 7, purple line). The data from NALCN are also shown on an expanded scale (lower right). f, The charge transfer of NALCN(DRL)-transfected cells was larger than that of NALCN-transfected cells. Mann-Whitney U test.** P < 0.01. The recording data are same as in e. Values are means ± sem.
Figure 1 |
Figure 1 |. Identification of Sik3 splicing mutation responsible for reduced total wake time.
a, Wake time distribution of B023 N2 littermates (bars) and all mice screened (curve). Blue and Purple bars indicates retrospectively genotyped Sik3+/+ and Sik3Slp/+ mice, respectively, b, QTL analysis of B023 pedigree (n = 93) for total wake time. (Inset) LOD score peak between rs13480122 and rs29644859. c, Haplotype analysis of Sleepy mutant pedigrees, B021-B025, in terms of the presence of Sleepy phenotypes, d, Exome sequencing results from Sleepy mutant mice of B023 and B024 pedigrees together with wildtype mice within the region of LOD score peak, e, Direct sequencing of Sik3 gene, f, RT-PCR of Sik3 mRNA produced smaller bands specific to Sik3Slp mice, g, Structures of wildtype and mutant SIK3 proteins, h, Immunoblotting of brain homogenates showing wildtype and mutant SIK3 protein variants, i, RT-PCR of brain mRNA from ZFN-based Sik3Slp/+ mice showing smaller bands lacking exon 13, in addition to larger bands containing the exon 13. j, Sik3Slp(ZFN)/+ mice (n = 15) showed shorter total wake time than wildtype littermates (n = 14). Two-way ANOVA followed by Tukey’s test. *** P < 0.001. Values are means ± sem.
Figure 2 |
Figure 2 |. Increased sleep need and normal wake-promoting response of Sik3 mutant mice.
a-b, Circadian variation in wakefulness (a) and NREMS (b) in Sik3+/+ (n = 22), Sik3Slp/+ (n = 32) and Sik3SlpJslp (n = 31) mice. One-way repeated measures ANOVA followed by Tukey’s test. Black asterisk: P < 0.05; Red asterisk: P < 0.001. c, Time spent in wakefulness from ZT4 to ZT5 after cage change at ZT5 of Sik3+/+ (n = 6), Sik3Slp/+ (n = 9) and Sik3Slp/Slp (n = 6) mice. One-way repeated measures ANOVA followed by Tukey’s test. *** P < 0.001. d, Wake time for 6-h after caffeine injection at ZT0 in Sik3+/+ (n = 6), Sik3Slp/+ (n = 6) and Sik3Slp/Slp (n = 6) mice. Two-way ANOVA followed by Tukey’s test. * P < 0.05. ## vs. 10 mg/kg BW, P < 0.01. Red asterisk: vs. 15 mg/kg BW, P < 0.01. e, NREM delta density of Sik3 mutant mice (Sik3+/+, n = 22; Sik3Slp/+, n = 32; Sik3Slp/Slp, n = 31) across the LD cycle. One-way repeated ANOVA followed by Tukey’s test, f, Increase in NREMS delta power of Sik3+/+ (n = 7), Sik3Slp/+ (n = 7) and Sik3Slp/Slp (n = 10) mice after 6-h sleep deprivation. One-way ANOVA followed by Tukey’s test. * P < 0.05. g, Increase in NREMS delta power after 2 h-, 4 h- and 6 h-sleep deprivation of Sik3+/+ (n = 11) and Sik3Slp/+ (n = 11) mice relative to NREM delta power of the same ZT during basal sleep. Two-way ANOVA followed by Tukey’s test. * P < 0.05. ** P < 0.01. *** P < 0.001. h, Phosphorylation of FLAG-SIK3 of Flag-Sik3+/+ brains with or without 4-h sleep deprivation. Two-way ANOVA followed by Tukey’s test. * P < 0.05. Values are means ± sem.
Figure 3 |
Figure 3 |. Role of Sik3 orthologues in invertebrate sleep-like behaviors.
a, The phylogenetic conservation of exon 13-encoded region of Sik3. b,c, Sleep time before and after induction of Sik3(S563A) by RU486 under constant darkness (32 per group). One-way repeated measures ANOVA followed by Tukey’s test. *** P < 0.001. d, Sleep time of control and Sik3 hypomorphic mutant in 12h light-12h dark condition (upper, 16 per group, P < 0.001) and in constant darkness (lower, 16 per group, P < 0.001). One-way repeated measures ANOVA. e, Sik3 null mutant worms, kin-29(oy38) (n = 15), exhibited reduced quiescence during lethargus than wildtype worms (n = 10). kin-29(oy38);PH20::kin-29 (n = 9) in which wildtype kin-29 was expressed in neuronal cells restored normal quiescence during lethargus. Fraction of quiescence out of lethargus were similar ( P = 0.98). One-way repeated measures ANOVA followed by Tukey’s test. * P < 0.05, ** P < 0.01. Values are means ± sem.
Figure 4 |
Figure 4 |. Missense mutation in Nalcn gene reduces REMS time and episode duration.
a, Histogram of REMS episode duration of G1 mice screened (mean ± SD = 1.41 ± 0.19 min). Arrow indicates the founder of Dreamless mutant pedigree. b, QTL analysis of Dreamless mutant pedigree (n = 56) for REM sleep episode duration. (Inset) LOD score peak near rs31233932. c, Direct sequencing of the Nalcn gene. d-e, Total REMS time (d) and REMS episode duration (e) of NalcnDrI/+ mice (n = 29) and Nalcn+/+ (n = 25) mice of the Dreamless mutant pedigree. Two-tailed Student’s t-test. *** p < 0.001. f-g, Total REMS time (f) and REMS episode duration (g) of NalcnDrl/+ mice (n = 11) and Nalcn+/+ (n = 17) mice produced by CRISPR/Cas9 technology. Two-tailed Student’s t-test. *** P < 0.001. Values are means ± sem.
Figure 5 |
Figure 5 |. Dreamless mutation in Nalcn gene increases excitability of neurons in the “REM-off” area.
a, Schematic structure of NALCN protein. b, Phylogenetic conservation of N315 residue in NALCN. c, Representative traces of membrane currents in response to 300-ms step pulses ranging from −80 mV to +80 mV in 10 mV increments (Vh = 0 mV, lower) recorded from HEK293T cells transfected with NALCN (upper) or NALCN(DRL) (middle). d, Mean current-voltage (I-V) curves in NALCN (n = 5, black circles) or NALCN(DRL) (n = 7, purple circles and lower right). e, The conductance of NALCN(DRL)-transfected cells was larger than that of NALCN-transfected cells (NALCN, 0.09 ± 0.02 nS/pF, n = 5; NALCN(DRL), 1.81 ± 0.62 nS/pF, n = 7). Mann-Whitney Utest. ** P < 0.01. f, Representative trace of membrane potentials of DpMe neurons in Nalcn+/+ (upper) and NalcnDrl/+ mice (lower). Dashed lines indicate 0 mV level. g-h, Mean membrane potentials (g) and spontaneous firing rates (h) of DpMe neurons (Nalcn+/+, n = 33; NalcnDrl/+, n = 31). Mann-Whitney U test. * P < 0.05. Values are means ± sem.

Comment in

References

    1. Cirelli C et al. Reduced sleep in Drosophila Shaker mutants. Nature 434, 1087–1092 (2005). - PubMed
    1. Koh K et al. Identification of SLEEPLESS, a sleep-promoting factor. Science 321, 372–6 (2008). - PMC - PubMed
    1. Raizen DM et al. Lethargus is a Caenorhabditis elegans sleep-like state. Nature 451, 569–572 (2008). - PubMed
    1. Daan S, Beersma DG & Borbely, a a. Timing of human sleep: recovery process gated by a circadian pacemaker. Am. J. Physiol. 246, R161–83 (1984). - PubMed
    1. Franken P, Chollet D & Tafti M The homeostatic regulation of sleep need is under genetic control. J. Neurosci. 21, 2610–21 (2001). - PMC - PubMed

Publication types

MeSH terms