. 2016 Nov 24;539(7630):518-523.
doi: 10.1038/nature20109. Epub 2016 Nov 2.

Developmental mechanisms of stripe patterns in rodents

Affiliations

Developmental mechanisms of stripe patterns in rodents

Ricardo Mallarino et al. Nature. .

Abstract

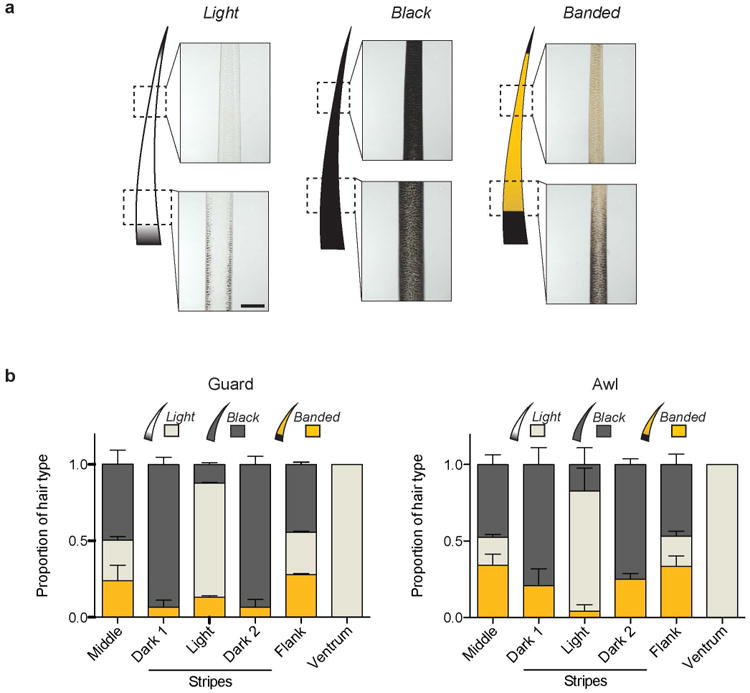
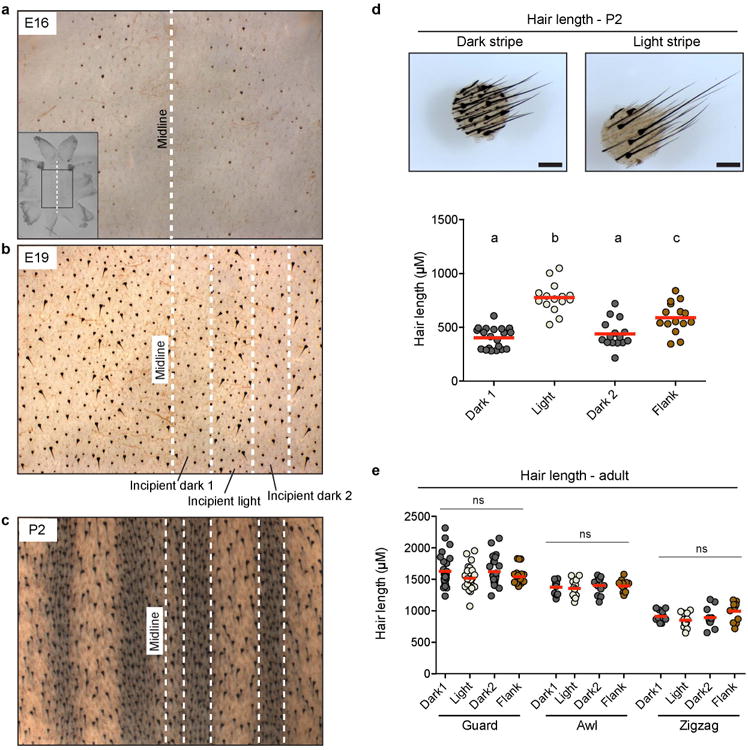
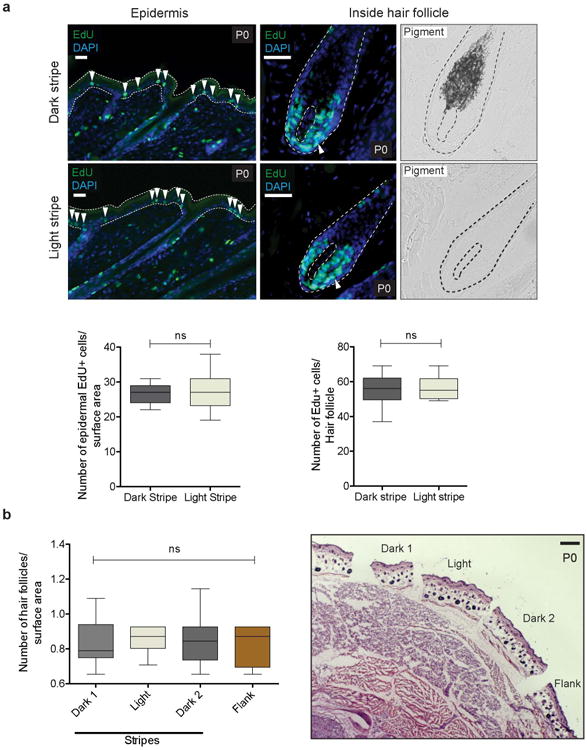
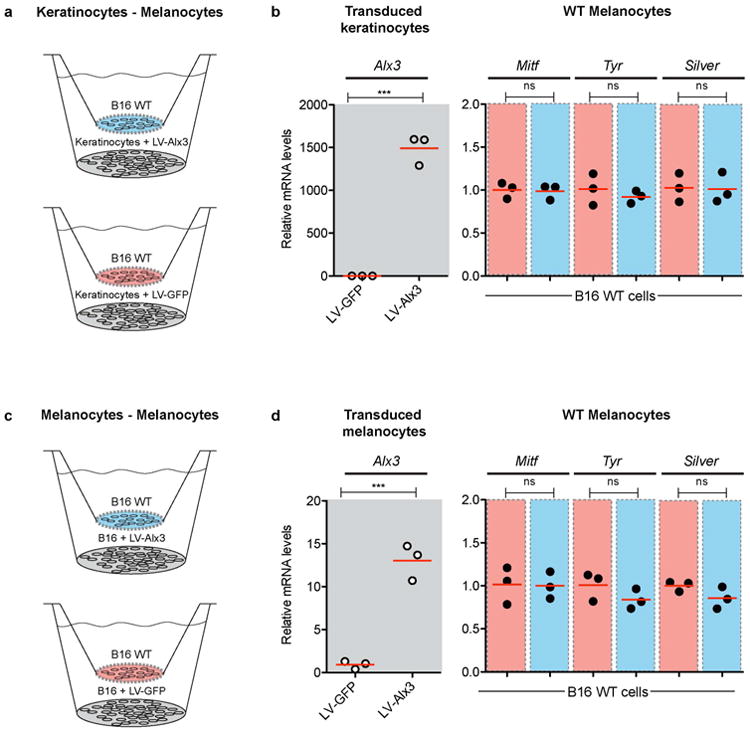
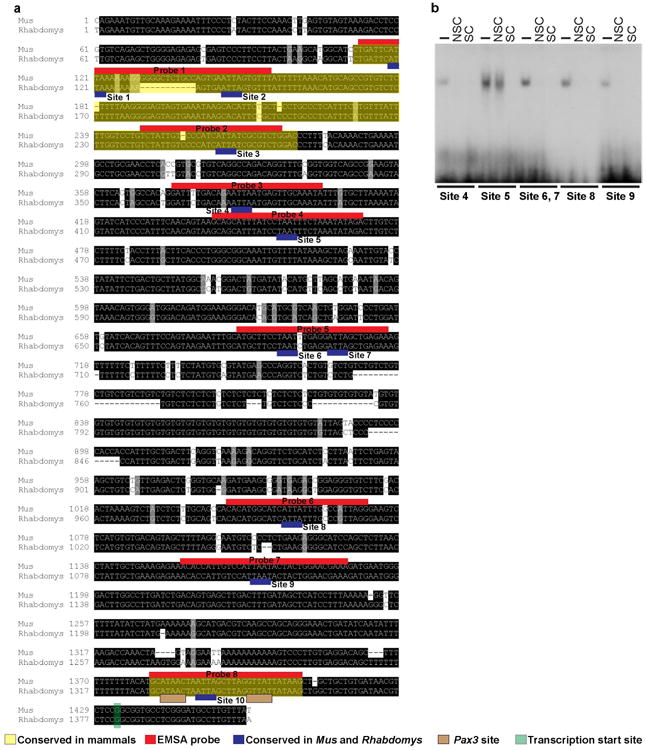
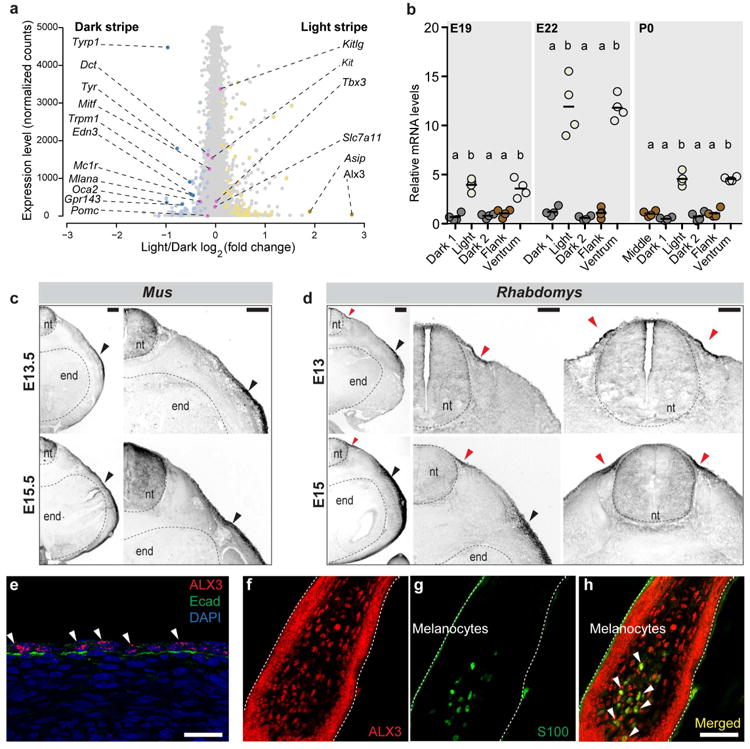
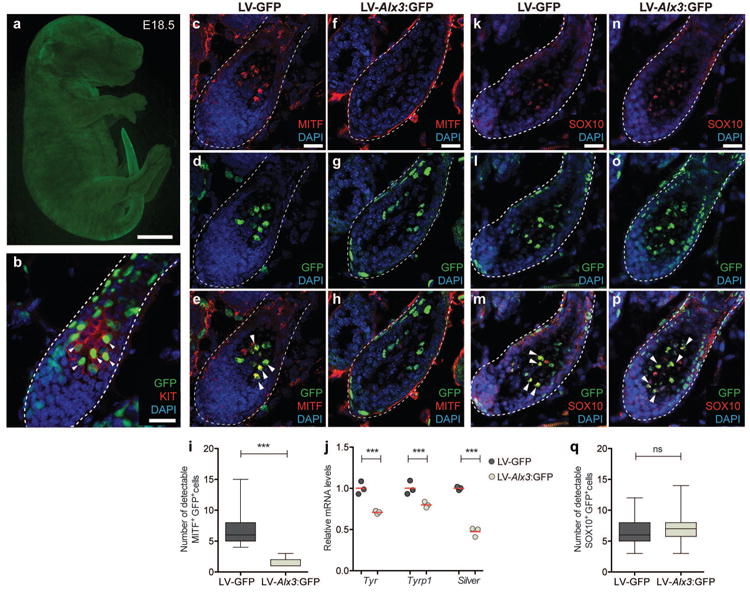
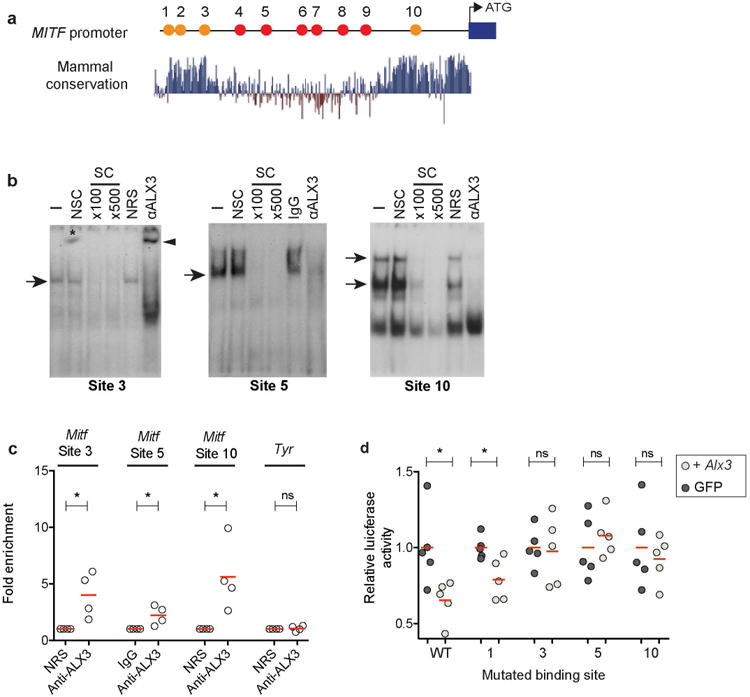
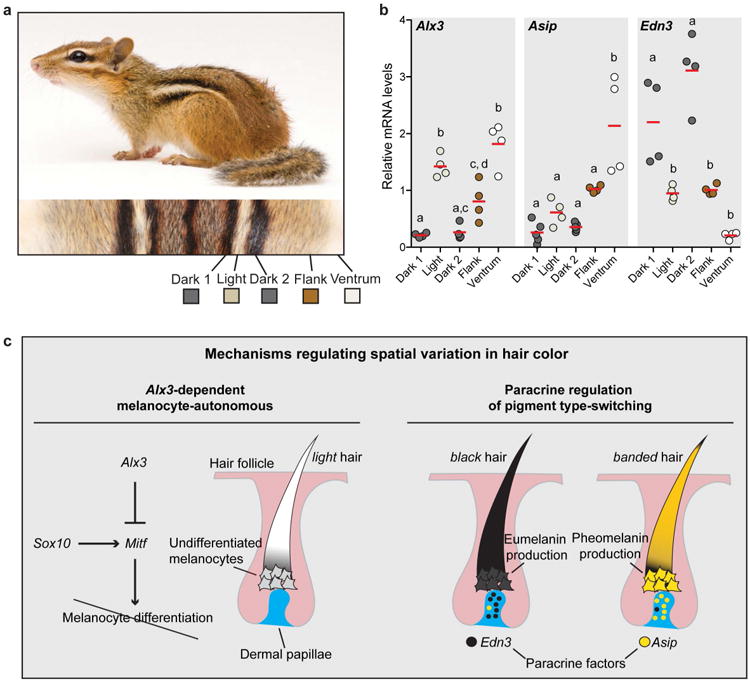
Mammalian colour patterns are among the most recognizable characteristics found in nature and can have a profound impact on fitness. However, little is known about the mechanisms underlying the formation and subsequent evolution of these patterns. Here we show that, in the African striped mouse (Rhabdomys pumilio), periodic dorsal stripes result from underlying differences in melanocyte maturation, which give rise to spatial variation in hair colour. We identify the transcription factor ALX3 as a regulator of this process. In embryonic dorsal skin, patterned expression of Alx3 precedes pigment stripes and acts to directly repress Mitf, a master regulator of melanocyte differentiation, thereby giving rise to light-coloured hair. Moreover, Alx3 is upregulated in the light stripes of chipmunks, which have independently evolved a similar dorsal pattern. Our results show a previously undescribed mechanism for modulating spatial variation in hair colour and provide insights into how phenotypic novelty evolves.


Figures

Extended Data Figure 1
Extended Data Figure 1. Hair characterization in adult striped mice
a, Striped mice have three different phenotypic categories (light, black, and banded) of hair based on individual pigment pattern. All hair types have a black tip, which corresponds to structural hair features (not pigment). b, Relative proportion of light, black, and banded guard and awl hair along the striped mouse dorsoventral axis (n = 5; error bars represent SEM). Scale bar in (a) 100 μm.
Extended Data Fig. 2
Extended Data Fig. 2. Stripe-like differences in hair length along the dorsum in Rhabodmys embryos and pups
a-c, Flat-mount skin preparations (‘dermis up’) of embryos at E16 (a), E19 (b), and pups from P2 (c). Middle axis is indicated in all cases (midline). White dashed lines represent regions differing in hair length at El9 (b) and regions differing in pigmentation at P2 (c). Incipient pigmentation stripes are shown in (b). d, Skin punches and measurements show differences in hair length between the dark and light stripe of P2 individuals. Hair length differences in (b) (incipient stripes) correlate with those seen when pigment differences arise (c, d). Differences among dorsal regions were evaluated by ANOVA followed by a Tukey-Kramer test; n = 3; statistically significant differences (P < 0.05) are indicated by different letters. Red bars indicate the mean, e, Hair length measurements taken from guard, awl, and zigzag hair found along the dorsum of adults. Differences among dorsal regions were evaluated by ANOVA followed by a Tukey-Kramer test; n = 3; P = 0.1736 (guard hair), P = 0.8006 (awl hair) P = 0.1038 (zigzag hair). f, Predicted probabilities of the observed stripe-like phenotypes, as inferred by supervised learning models built and trained to recognize time point specific gene expression signatures of the stripes. The bars reflect the average probabilities and their standard errors computed from 30 consecutive iterations of the predictive model in each of the examined situations. The labels indicate, as a ratio, the time point at which the randomForests model was applied to predict the stripe-like phenotype (the left term of the ratio), and the time point at which the model was built and trained (the right term of the ratio). The dotted line indicates the prior probability of either stripe phenotype (i.e., 50% in case a case with only two distinct phenotypes). Please see methods section for more details.
Extended Data Figure 3
Extended Data Figure 3. Cell proliferation and hair follicle density in striped mouse newborn pups (P0)
a, Counts of proliferating cells, as determined by EdU labeling, in the epidermis and inside hair follicles (Epidermal cells: dark stripe 1 vs. light stripe, two-tailed t test; n = 3, P = 0.5417; cells counted: 402 [dark stripe 1] and 444 [light stripe]); Intrafollicular cells (dark stripe 1 vs. light stripe, two-tailed t test; n = 3, P = 0.7537; cells counted: 724 [dark stripe 1] and 680 [light stripe]), b, Number of hair follicles per surface area along the dorsoventral axis. Differences among dorsal regions were evaluated by ANOVA; n = 3, P = 0.4391; total number of hair follicles counted: 139 [light stripe], 141 [dark stripe 1], 132 [dark stripe 2], and 128 [flank]). Bright field images in (a) depict pigment. Red bars indicate the mean. Scale bars in (a) 100 μm, (b) 200 μm.
Extended Data Figure 4
Extended Data Figure 4. Venn diagrams comparing M. musculus and the de novo assembled transcriptome as references
a-c, Differentially expressed genes identified using either the M. musculus reference or the de novo transcriptome assembly in light vs. dark stripes (a), light vs. flank (b), and flank vs. dark (c). d, Differentially expressed genes in light or dark stripes vs. the other skin region (light or dark stripes and the flank). Genes that are specifically upregulated only in the dark or light stripes are highlighted in red.
Extended Data Figure 5
Extended Data Figure 5. RNA-Seq transcript levels (normalized gene counts) plotted as a function of differential expression (log2fold-change)
a, The 1148 genes demonstrating significant (FDR < 0.1) differential expression in the flank versus the dark stripe are shown in yellow (higher expression in the flank) or blue (higher expression in the dark stripe; Supplementary Table lc). Eleven differentially expressed pigmentation-related genes are illustrated in darker colors (dark yellow or dark blue), while 6 additional pigmentation-related genes that are not differentially expressed are shown in pink. b, The 1777 genes demonstrating significant (FDR < 0.1) differential expression in the light stripe versus the flank are shown in yellow (higher expression in the light stripe) or blue (higher expression in the flank; Supplementary Table lb). Four differentially expressed pigmentation-related genes are illustrated in darker colors (dark yellow or dark blue), while 11 additional pigmentation-related genes that are not differentially expressed are shown in pink.
Extended Data Figure 6
Extended Data Figure 6. Stage-specific gene expression
a-c, Quantitative PCR shows the relative expression of the pigment-type switching genes Asip (a), Edn3 (b), and melanin synthesis genes Tyr and Tyrpl (c) in different regions of the Rhabdomys skin. Differences among stripes in within each time point was evaluated by ANOVA followed by a Tukey-Kramer test; n = 4 per time point; statistically significant differences (P < 0.05) are indicated by different letters. Red bars indicate the mean.
Extended Data Fig. 7
Extended Data Fig. 7. Gain- and loss of function experiments in cultured cells
a, Lentiviral constructs were modified from pLKO. 1, a generic vector for expressing human RNU6-1 promoter-driven short hairpin RNAs (red loop). LTR, long terminal repeat;ψ, retroviral packaging element, RRE, Rev response element; cPPT, central polypurine tract; PGK, phosphoglycerate kinase promoter; H2B-GFP, Hist2h2be fused to GFP cDNA; P2A, 2A peptide, b, Western blot shows expression of ALX3 in nuclear extracts of B16-F1 cells. Positive controls were extracts from mouse embryonic mesenchyme (MEM) or COS cells transfected with a pcDNA-ALX3 expression vector. COS cells transfected with empty pcDNA served as negative controls. ACTIN immunoreactivity is shown for the same extracts as a control. c, Quantitative PCR showing mRNA levels of cells transduced with LV-Alx3:GFP, relative to cells transduced with the LV-GFP control (LV-Alx3:GFP vs. LV-GFP, two-tailed t test; n = 3. Red bars indicate the mean), d, Quantitative PCR showing mRNA levels of cells transduced with shRNA lentiviral constructs, relative to cells transduced with a scrambled control (shRNAl, 2, 3, or 4 vs. shRNA scrambled, two-tailed t test; n = 3; statistically significant differences [P < 0.05] are indicated by different letters. Red bars indicate the mean).
Extended Data Fig. 8
Extended Data Fig. 8. Non-cell autonomous effects of Alx3 on B16 melanocytes
a-d, Wildtype B16 melanocytes (B16 WT) were exposed to keratinocytes (a) or melanocytes (c) stably transduced with either LV-Alx3:GFP (LV-Alx3 in graphs) or LV-GFP. b, d, Quantitative PCR showing relative mRNA levels of Alx3 in cells carrying the lentiviral constructs (gray panel) and of Mitf, Tyr, and Silver in B16 WT melanocytes exposed to keratinocytes (c) or melanocytes (d) transduced with LV-Alx3:GFP (red panels) or LV-GFP (blue panels) (LV-Alx3:GFP vs. LV-GFP, two-tailed t test; n = 3, ***P < 0.0001) Red bars in (b) and (d) indicate the mean.
Extended Data Figure 9
Extended Data Figure 9. Effect of Alx3 on skin
a-f, Hair follicles from samples injected with LV-GFP control (a-c) and LV-Alx3:GFP (d-f) depicting immunohistochemistry for K14 (a, d), virus transduced cells (b, e), and merged images showing K14+GFP+ cells (c, f). g, Number of detctable K14+GFP+ cells per follicular area (LV-GFP vs LV-Alx3:GFP, two-tailed t test; n = 3, P = 0.275; total number of hair follicles counted: 44 in LV-Alx3:GFP [Average: 52.809 cells/hair follicle area] and 50 in LV-GFP [Average: 55.123 cells/hair follicle area]), h, Hair follicle density in samples injected with the viruses (LV-GFP vs LVAlx3:GFP, two-tailed t test; n = 3, P = 0.103; total number of hair follicles counted: 914 in LV-Alx3:GFP [Average: 0.794 hair follicles/surface area] and 864 in LV-GFP [Average: 0.84 hair follicles/surface area]). Scale in (a-f) 50 μM.
Extended Data Figure 10
Extended Data Figure 10. Alignment of a ~1.5kb region of the Mitf M promoter in laboratory mice (Mus) and striped mice (Rhabdomys)
Black boxes represent conserved sequences. Mapped onto the sequences are the evolutionary conserved regions of the mammalian MitfM promoter, identified in silico (http://genome.ucsc.edu)(yellow), regions where the EMSA probes were designed (red), Alx3 binding sites analyzed (blue), and the transcription start site (green). b, EMS As showing the binding of recombinant Alx3 to the indicated sites. The absence (-) or presence of non-specific (NSC; 500-fold molar excess) or specific (SC; indicated fold molar excess) competing oligonucleotides.
Figure 1
Figure 1. Phenotypic characterization
a, Striped mice have dark and light longitudinal stripes, b, Proportion of light, black, and banded hair along the dorsoventral axis for zigzag hair (n = 5; error bars represent SEM). c, The dorsal pattern at E22, P0, and P2. d-f, Postnatal day 2 skin sections from dark and light stripes showing hematoxilin and eosin stain (d), and immunohistochemistry for KIT (e) and MITF (f). g-h, number of detectable cells expressing MITF (g) and their fluorescence intensity (h) (dark stripe vs light stripe cell number: two-tailed t test; n = 4, ***p < 0.001; hair follicles analyzed: 65 in the dark stripe 1 [615 cells] and 62 in the light stripe [284 cells]; dark stripe 1 vs light stripe fluorescense intensity: two-tailed t test; n = 4, ***p < 0.001; hair follicles analyzed: 34 in the dark stripe 1 and 34 in the light stripe), i, Quantification of the extent of KIT stain in each hair bulb (dark stripe vs light stripe, two-tailed t test; n = 3, P = 0.5429; hair follicles analyzed: 20 in the dark stripe 1 and 20 in the light stripe), j, qPCR shows Tyr and Tyrpl mRNA levels in P2 dark and light stripes. Differences among stripes were evaluated by ANOVA followed by a Tukey-Kramer test; n = 4; *P < 0.05, **P < 0.01; ***P < 0.001; red bars indicate the mean, k, Tyramide-based assay reveals Tyr activity in hair follicles from P2 dark and light stripes. Brightfield images are shown in (e, f) to depict pigment. Scale bars in (d, k) 100 μm; in (e, f) 50 μm.
Figure 2
Figure 2. Alx3 is a candidate for regulating spatial differences in hair color
a, Transcript levels (normalized gene counts) plotted as a function of differential expression (log2 fold-change) in light vs. dark stripe. The 145 genes showing significant (FDR < 0.1) differential expression in the light vs. the dark stripe, including Alx3, are shown in yellow (higher expression in the light stripe) or blue (higher expression in the dark stripe; Supplementary Table la). Nine differentially expressed pigmentation-related genes are shown in darker colors (dark yellow or dark blue), while 8 additional pigmentation-related genes not differentially expressed are shown in pink, b, Quantitative PCR showing Alx3 mRNA levels from El9, E22, and P0. Differences among skin regions within each time point were evaluated by ANOVA followed by a Tukey-Kramer test; n = 4 per time point; statistically significant differences (P < 0.05) are indicated by different letters. Red bars indicate the mean, c, d, Comparative Alx3 in situ hybridization analysis between laboratory mice (c) and striped mice (d) embryos show lateral and ventral mesenchyme expression in both species (black arrow) and a symmetrical dorsal domain of expression unique to striped mice (red arrows), e-h Immunohistochemistry for ALX3 and E-cadherin (Ecad) in an El5 striped mouse embryo (e) and for ALX3 (f) and SI00 (g) in a developing dorsal hair follicles from P0. Arrowheads show ALX3 expressing cells (e) and colocalization (h); nt: neural tube, end: endoderm. Scale bars in (c, d) 200 μm, (e-h) 50 μm.
Figure 3
Figure 3. Alx3 decreases melanin synthesis in vivo
a, b, Injections at E8.5 allowed stable transduction of various cell types, including melanocytes (arrowheads), c-h, Hair follicles from samples injected with LV-GFP control (c-e) and LV-Alx-3:GFP (f-h) depicting immunohistochemistry for MITF (c, f), virus transduced cells (d, g), and merged images showing MITF+GFP+ cells (e, h)(arrowheads). i, Number of detectable MITF+ cells (LV-GFP vs LV-Alx3, two-tailed t test; n = 3, ***P < 0.001; hair follicles counted: 61 in LV-Alx3:GFP [88 cells] and 60 in LV-GFP [402 cells]), j, Quantitative PCR of FACS-isolated melanocytes transduced with both viruses (two-tailed t test; n = 3, ***P < 0.001). (k-p) Hair follicles from samples injected with lentiviruses depicting immunohistochemistry for SOX 10 (k, n), virus transduced cells (1, o) and merged images with arrowheads showing SOX+GFP+ cells (m, p). q, Number of detectable SOX 10+ cells (two-tailed t test; n = 3, P = 0.1173; hair follicles counted: 62 in LV-Alx3:GFP [426 cells] and 61 in LV-GFP [398 cells]). Scale bar in (a) 1mm, (b) 100 μm. Scale bar in (c-h and k-p) 50 μm.
Figure 4
Figure 4. AIx3 binds to the Mitf promoter directly
a, Location of putative Alx3 binding sites (labeled 1-10), conserved in Mus and Rhabdomys (red circles) and across mammals (orange circles), along the Mitf M promoter, b, EMSAs show the binding of nuclear proteins from B16-F1 cells to sites 3, 5, and 10. The absence (-) or presence of non-specific (NSC; 500-fold molar excess) or specific (SC; indicated fold molar excess) competing oligonucleotides, or the addition of ALX3 antibodies or control (non-immune rabbit serum [NRS] or IgG) is indicated. Arrows indicate complexes containing ALX3, arrowhead shows supershitf for site 3, and asterisk shows an artifact in the gel. c, ChlP-qPCR assays showing amplification of Mitf chromatin corresponding to different regions of the promoter immunoprecipitated with an anti-ALX3 antibody or with control NRS (Anti-ALX3 vs. NRS, two-tailed t test; n = 4,*P< 0.05). d, Relative levels of luciferase activity in B16-F1 cells stably expressing Alx3 (light circles) or GFP (dark circles). Labels of mutated binding sites correspond to those described in (a). Luciferase activity was normalized relative to cells transfected with the pLightSwitch_Prom luciferase reporter vector (empty vector) and values are given as a fraction of luminescence for GFP transfected cells. Differences between cells transfected with LV-Alx3:GFP and LV-GFP for each plasmid was evaluated using two-tailed t tests; n = 5; *P < 0.05. Red bars in (c and d) indicate the mean.
Figure 5
Figure 5. Hair color patterning mechanisms in rodents
a, Chipmunks (Sciuridae) have independently evolved dark and light stripe in a pattern that resembles the one seen in striped mice, b, Quantitative PCR revealed spatial differences in Alx3, Asip, and Edn3 mRNA levels along the dorsoventral axis. Differences among dorsal regions were evaluated by ANOVA followed by a Tukey-Kramer test; n = 4; statistically significant differences (P < 0.05) are indicated by different letters. Red bars indicate the mean, c, The combination of melanocye autonomous pathways, mediated by Alx3, and non-autonomous pathways, mediated by paracrine factor (Edn3 and Asip), may help explain variation in pigmentation patterns seen across rodents and mammals.

Comment in

References

    1. Barsh GS. The genetics of pigmentation: from fancy genes to complex traits. Trends in Genetics. 1996;12:299–305. - PubMed
    1. Jackson I, et al. Genetics and molecular biology of mouse pigmentation. Pigment Cell Research. 1994;7:73–80. - PubMed
    1. Mills MG, Patterson LB. Not just black and white: Pigment pattern development and evolution in vertebrates. Seminars in Cell & Developmental Biology. 2009;20:72–81. - PMC - PubMed
    1. Candille SI, et al. Dorsoventral patterning of the mouse coat by Tbx15. Plos Biol. 2004;2:e3. - PMC - PubMed
    1. Rawls JF, Mellgren EM, Johnson SL. How the zebrafish gets its stripes. Developmental Biology. 2001;240:301–314. - PubMed

Publication types

MeSH terms

Substances