. 2016 Dec 1;311(6):R1223-R1233.
doi: 10.1152/ajpregu.00362.2016. Epub 2016 Nov 2.

High-fat diet-induced glucose dysregulation is independent of changes in islet ACE2 in mice

Affiliations

High-fat diet-induced glucose dysregulation is independent of changes in islet ACE2 in mice

Harshita Chodavarapu et al. Am J Physiol Regul Integr Comp Physiol. .

Abstract

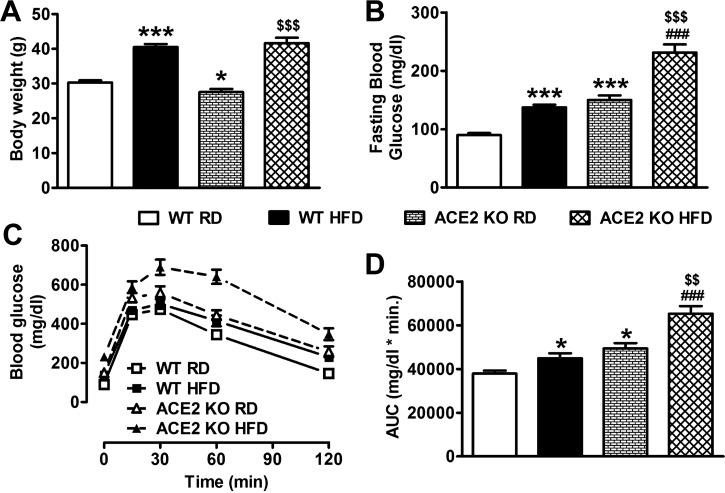
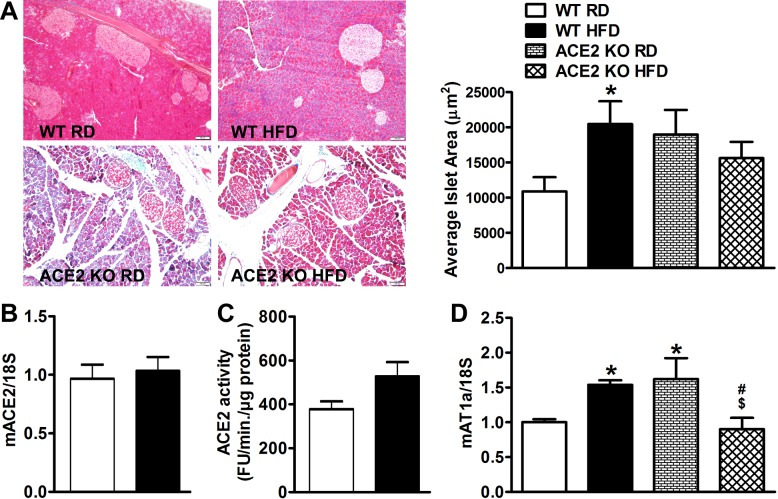
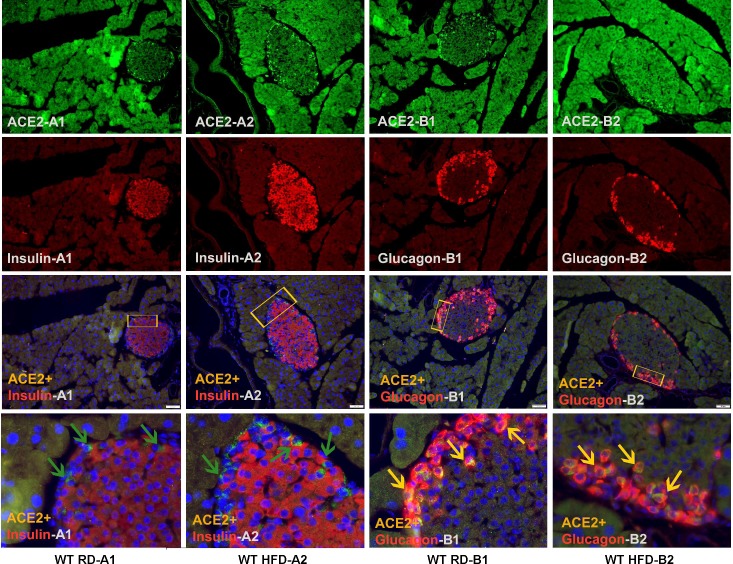
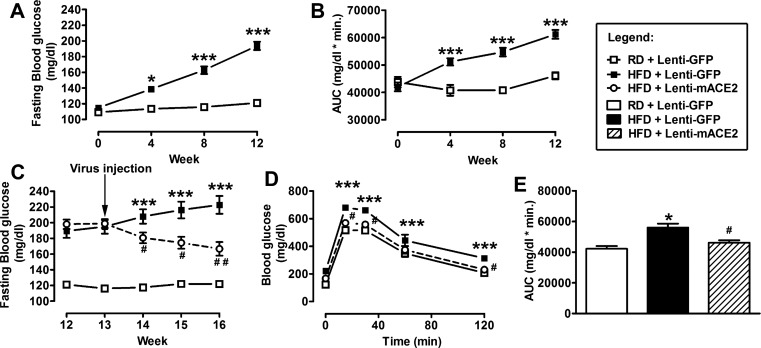
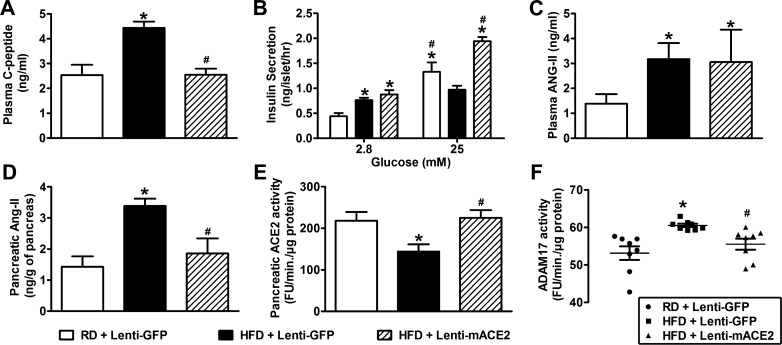
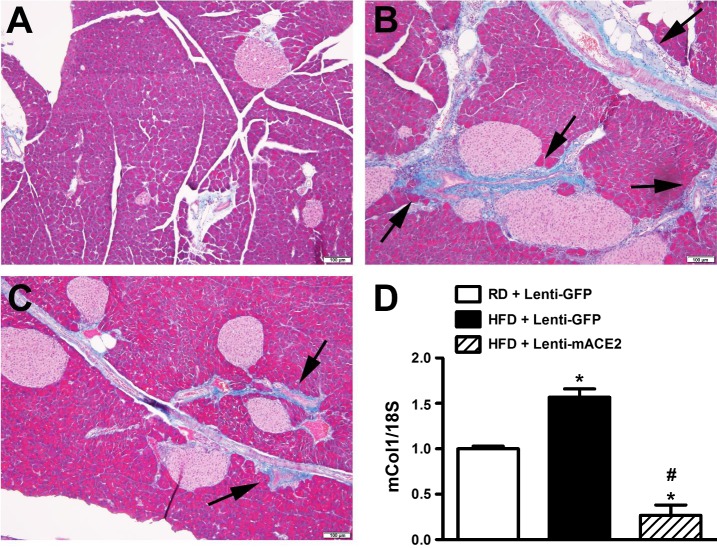
While restoration of ACE2 activity in the pancreas leads to improvement of glycemia in experimental models of Type 2 diabetes, global deficiency in ACE2 disrupts β-cell function and impairs glucose tolerance in mice, demonstrating the physiological role of ACE2 in glucose homeostasis. Although the contribution of pancreatic ACE2 to glucose regulation has been demonstrated in genetic models of diabetes and in models with overexpression of the renin-angiotensin system (RAS), it is unclear whether islet ACE2 is involved in glycemic control in common models of human Type 2 diabetes. To determine whether diet-induced diabetes deregulates glucose homeostasis via reduction of ACE2 in the pancreatic islets, wild-type (WT) and ACE2 knockout (KO) male mice were fed a high-fat diet (HFD) for 16 wk. ACE2 KO mice were more susceptible than WT mice to HFD-mediated glycemic dysregulation. Islet ACE2 activity and expression of various genes, including ANG II type 1a receptor (mAT1aR) were then assessed. Surprisingly, we observed no change in islet ACE2 activity and expression despite local RAS overactivity, indicated by an upregulation of mAT1aR expression. Despite a predominant expression in islet α-cells, further investigation highlighted a minor role for ACE2 on glucagon expression. Further, pancreatic ACE2 gene therapy improved glycemia in HFD-fed WT mice, leading to enhanced glucose-stimulated insulin secretion, reduced pancreatic ANG II levels, fibrosis, and ADAM17 activity. Altogether, our study demonstrates that HFD feeding increases RAS activity and mediates glycemic dysregulation likely through loss of ACE2 present outside the islets but independently of changes in islet ACE2.

Keywords: ACE2; Type 2 diabetes; high-fat diet; pancreatic islets; renin-angiotensin system.


Figures

Fig. 1.
Fig. 1.
Effect of high-fat diet (HFD) feeding on metabolic parameters in wild-type (WT) and ACE2 knockout (KO) mice. Despite a significantly lower body weight in ACE2 KO compared with WT on baseline (A), the significant increase induced by HFD was not different between strains after 16 wk of feeding. In WT mice, HFD induced a significant increase in fasting blood glucose levels (B) and impaired glucose tolerance (C and D) that was exacerbated in ACE2 KO mice. Statistical significance: *P < 0.05, ***P < 0.001 vs. WT RD; $$P < 0.01, $$$P < 0.001 vs. ACE2 KO RD; ###P < 0.001 vs. WT HFD using two-way ANOVA followed by Bonferroni’s multiple-comparison test. Data are from n = 39–49 mice for WT RD and HFD groups; n = 14–19 mice for ACE2 KO RD and HFD groups.
Fig. 2.
Fig. 2.
Effect of HFD feeding on islet area and islet ACE2/AT1aR levels in WT and ACE2 KO mice. A: islet area of pancreatic sections from WT (n = 4 mice/group) and ACE2 KO (n = 2 mice/group) on RD and HFD mice stained with Masson’s trichrome and a representative average islet area (µm2) bar graph. HFD-fed WT mice showed no difference in islet mACE2 gene expression levels (n = 5/group) (B) or activity (n = 7 or 8/group) (C) compared with RD-fed control mice. HFD-fed WT mice and RD-fed ACE2 KO mice showed significantly increased mAT1aR gene expression levels compared with RD-fed WT mice (D). Statistical significance: *P < 0.05 vs. WT RD; $P < 0.01 vs. ACE2 KO RD; #P < 0.05 vs. WT HFD using two-way ANOVA followed by Bonferroni’s multiple-comparison test.
Fig. 3.
Fig. 3.
ACE2 expression in the pancreas. A: double immunofluorescence expression for ACE2 (green) and insulin (red) superimposed image and zoomed in superimposed image of ACE2+Insulin+DAPI (indicated by green arrows) in WT RD (A1), WT HFD (A2) pancreatic sections. B: double immunofluorescence staining of ACE2 (green) and glucagon (red) superimposed image and zoomed in superimposed image of ACE2+Glucagon+DAPI (indicated by yellow arrows) in WT RD (B1) and WT HFD (B2) pancreatic sections. Images were taken at ×20 magnification using a fluorescence microscope. Note that rectangular insets in each superimposed panel point to the region used to obtain zoomed-in superimposed image.
Fig. 4.
Fig. 4.
Effect of HFD on glucagon and insulin in WT and ACE2 KO mice. A: HFD-fed WT mice had significantly lower-glucagon mRNA levels, while ACE2 KO mice on HFD had significantly higher levels in the islets. HFD feeding significantly increased plasma insulin levels (B) and elevated insulin/glucagon gene expression ratio (C) in WT mice but significantly decreased plasma insulin levels (B) and insulin/glucagon gene expression ratio (C) in ACE2 KO mice. D: ex vivo treatment with normal (5 mM) and high (25 mM) glucose concentrations in the presence and absence of 100 nM ANG II and ANG-(1–7) for 3 h showed no effect on glucagon mRNA levels in isolated islets of WT mice. Statistical significance, *P < 0.05, **P < 0.01 vs. WT RD; $$P < 0.01 vs. ACE2 KO RD; #P < 0.05, ##P < 0.01, ###P < 0.001 vs. WT HFD using two-way ANOVA followed by Bonferroni’s multiple comparison test.
Fig. 5.
Fig. 5.
Effect of Lenti-mACE2 gene therapy on fasting blood glucose and glucose intolerance in HFD-fed mice. Twelve weeks after HFD-feeding, HFD + Lenti-GFP showed significantly higher fasting blood glucose (A) and glucose intolerance (B) compared with RD + Lenti-GFP mice. Three weeks after the pancreatic injection of Lenti-mACE2 (n = 8) or the control lentivirus Lenti-GFP (n = 10), fasting blood glucose levels (C) and glucose intolerance (D and E) were significantly reduced in HFD + Lenti-mACE2 compared with HFD + Lenti-GFP mice. Statistical significance: *P < 0.05, ***P < 0.001 vs. RD + Lenti-GFP; #P < 0.05, ##P < 0.01 vs. HFD + Lenti-GFP using repeated-measures ANOVA followed by Bonferroni’s post hoc test (A–D). One-way ANOVA followed by the Tukey multiple-comparison test (E).
Fig. 6.
Fig. 6.
Effect of Lenti-mACE2 gene therapy on renin angiotensin system (RAS) overactivity and ADAM17 activity in the pancreas of HFD-fed mice. Three weeks after the pancreatic injection of Lenti-mACE2 (n = 8) or the control lentivirus Lenti-GFP (n = 10), C-peptide levels (A) and glucose-stimulated insulin secretion (GSIS) (B) (20 islets/mouse; n = 3) were determined in RD and HFD-fed mice. HFD-fed mice treated with Lenti-GFP show increased plasma ANG II (C), pancreatic ANG II (D), reduced pancreatic mACE2 activity (E), and increased pancreatic ADAM17 activity (F), while intrapancreatic Lenti-mACE2 injection reduced pancreatic (D) but not plasma (C) ANG II, ADAM17 activity (F), and restored ACE2 activity (E) in the pancreas of the HFD-fed mice. Statistical significance: *P < 0.05 vs. RD + Lenti-GFP; #P < 0.05 vs. HFD + Lenti-GFP using one-way ANOVA followed by the Tukey multiple-comparison test. For GSIS: *P < 0.05 vs. 2.8 mM glucose or RD; #P < 0.05 vs. HFD + Lenti-GFP using two-way ANOVA followed by Bonferroni’s post hoc test.
Fig. 7.
Fig. 7.
Effect of ACE2 gene therapy on pancreatic fibrosis in HFD-fed mice. Masson’s trichrome staining of pancreatic sections showing fibrosis (black arrows) in RD + Lenti-GFP (A), HFD + Lenti-GFP (B), and HFD+Lenti-ACE2 (C)-treated groups. Pictures were taken at ×10 magnification. HFD + Lenti-GFP (D) group showed a significant increase in mCol1 gene expression compared with RD + Lenti-GFP group and HFD + Lenti-ACE2-treated group significantly decreased mCol1 mRNA levels in the pancreas. Statistical significance: *P < 0.05 vs. RD + Lenti-GFP; #P < 0.05 vs. HFD + Lenti-GFP using one-way ANOVA followed by Tukey’s multiple-comparison test (n = 3/group).

References

    1. Bangalore S, Fakheri R, Toklu B, Messerli FH. Diabetes mellitus as a compelling indication for use of renin angiotensin system blockers: systematic review and meta-analysis of randomized trials. BMJ 352: i438, 2016. doi:10.1136/bmj.i438. - DOI - PMC - PubMed
    1. Bernardi S, Tikellis C, Candido R, Tsorotes D, Pickering RJ, Bossi F, Carretta R, Fabris B, Cooper ME, Thomas MC. ACE2 deficiency shifts energy metabolism towards glucose utilization. Metabolism 64: 406–415, 2015. doi:10.1016/j.metabol.2014.11.004. - DOI - PubMed
    1. Bindom SM, Hans CP, Xia H, Boulares AH, Lazartigues E. Angiotensin I-converting enzyme type 2 (ACE2) gene therapy improves glycemic control in diabetic mice. Diabetes 59: 2540–2548, 2010. doi:10.2337/db09-0782. - DOI - PMC - PubMed
    1. Bindom SM, Lazartigues E. The sweeter side of ACE2: physiological evidence for a role in diabetes. Mol Cell Endocrinol 302: 193–202, 2009. doi:10.1016/j.mce.2008.09.020. - DOI - PMC - PubMed
    1. Bokhari S, Israelian Z, Schmidt J, Brinton E, Meyer C. Effects of angiotensin II type 1 receptor blockade on beta-cell function in humans. Diabetes Care 30: 181, 2007. doi:10.2337/dc06-1745. - DOI - PubMed