. 2016 Dec 16;291(51):26273-26290.
doi: 10.1074/jbc.M116.764613. Epub 2016 Nov 2.

Fibroblast Growth Requires CT10 Regulator of Kinase (Crk) and Crk-like (CrkL)

Affiliations

Fibroblast Growth Requires CT10 Regulator of Kinase (Crk) and Crk-like (CrkL)

Taeju Park et al. J Biol Chem. .

Abstract

CT10 regulator of kinase (Crk) and Crk-like (CrkL) are the cellular counterparts of the viral oncogene v-Crk Elevated levels of Crk and CrkL have been observed in many human cancers; inhibition of Crk and CrkL expression reduced the tumor-forming potential of cancer cell lines. Despite a close relationship between the Crk family proteins and tumorigenesis, how Crk and CrkL contribute to cell growth is unclear. We ablated endogenous Crk and CrkL from cultured fibroblasts carrying floxed alleles of Crk and CrkL by transfection with synthetic Cre mRNA (synCre). Loss of Crk and CrkL induced by synCre transfection blocked cell proliferation and caused shrinkage of the cytoplasm and the nucleus, formation of adherens junctions, and reduced cell motility. Ablation of Crk or CrkL alone conferred a much more modest reduction in cell proliferation. Reintroduction of CrkI, CrkII, or CrkL individually rescued cell proliferation in the absence of the endogenous Crk and CrkL, suggesting that Crk and CrkL play overlapping functions in regulating fibroblast growth. Serum and basic FGF induced phosphorylation of Akt, MAP kinases, and S6 kinase and Fos expression in the absence of Crk and CrkL, suggesting that cells lacking Crk and CrkL are capable of initiating major signal transduction pathways in response to extracellular stimuli. Furthermore, cell cycle and cell death analyses demonstrated that fibroblasts lacking Crk and CrkL become arrested at the G1-S transition and undergo a modest apoptosis. Taken together, our results suggest that Crk and CrkL play essential overlapping roles in fibroblast growth.

Keywords: adaptor protein; apoptosis; cell cycle; cell growth; fibroblast; growth factor; serum.


Figures

FIGURE 1.
FIGURE 1.
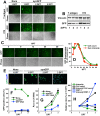
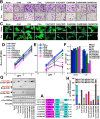
Efficient and rapid expression of GFP after synGFP transfection. A–C, Crk/CrkL double-floxed fibroblasts immortalized by T antigen or the 3T3 protocol were transfected without synRNA (None) or with synGFP (2 μg in 10 μl of cell suspension). A, both phase-contrast and GFP images of cells were taken at the indicated DPT. B, total cell lysates were obtained from cells transfected with synGFP for Western blot analyses. Protein levels of GFP at different DPT were compared. Vinculin levels were used as a control. C and D, T antigen-immortalized Crk/CrkL double-floxed fibroblasts were transfected with synGFP (2 μg in 10 μl cell suspension). At 5 h post transduction (HPT), GFP-positive cells were chosen, and time-lapse images of GFP and phase contrast were recorded every 4 h. The number of GFP-positive cells and their sum fluorescence intensities in the field of view were calculated using the Object Count function of the Nikon NIS element program. Four separate experiments were done, and a representative field of view was chosen for both image display (C) and GFP fluorescence quantification (D). E–H, T antigen-immortalized Crk/CrkL double-floxed fibroblasts were transfected without synRNA (None), with synGFP (2 μg in 10 μl cell suspension) or with GFP DNA (2 μg in 10 μl cell suspension). E, cells were fixed at the indicated DPT and stained with DAPI to visualize the nucleus. Representative images of GFP and DAPI are shown. Scale bar: 100 μm. F, the number of GFP-positive cells was counted (see “Experimental Procedures”). G, proliferation of fibroblasts after transfection was measured using WST-1. H, the average intensity of GFP fluorescence per cell for the synGFP-transfected cells (intensity) was calculated by combining all the sum fluorescence intensities in all the fields of view and dividing it by the total number of DAPI-positive objects. The total intensity was obtained by multiplying the average GFP fluorescence intensity per cell by the total number of DAPI-positive objects (intensity × cell count) or by the WST-1 measurement (intensity × WST-1).
FIGURE 2.
FIGURE 2.
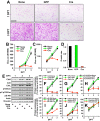
Lack of cell proliferation in the absence of Crk and CrkL. T antigen-immortalized Crk/CrkL double-floxed fibroblasts were transfected without synRNA (None) or with synGFP (GFP) or synCre (Cre) (2 μg in 10 μl of cell suspension). A, crystal violet images of cells were taken at the indicated DPT. Whereas control and synGFP-transfected fibroblasts had substantial proliferation, synCre-transfected cells failed to proliferate. Scale bar: 500 μm. B and C, cell proliferation was quantitatively measured using WST-1, and the A450–690 values are presented in linear (B) and logarithmic (C) scales. D, exponential trend lines for the WST-1 assay graphs were drawn, and their slopes, the coefficients of x, are presented as the rates for exponential cell growth. E, total cell lysates were obtained at the indicated DPT for Western blot analyses. Protein levels were compared among cells transfected without synRNA (None) or with synGFP (GFP), or synCre (Cre). F–K, protein bands were quantified using the Odyssey system and calculated as percentages of the control (none at 3 DPT), and their mean ± S.D. values are shown in the graph.
FIGURE 3.
FIGURE 3.
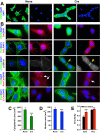
Morphological alterations of cells in the absence of Crk and CrkL. T antigen-immortalized Crk/CrkL double-floxed fibroblasts were transfected without synRNA (None) or with synCre (0.2 μg in 10 μl cell suspension). At 3 DPT, cells were fixed and stained with antibodies and DAPI to visualize distribution of proteins and identify the cytoplasm and the nucleus. A, cells were immunostained with a HSP90 antibody to visualize the cytoplasm. Scale bar: 50 μm. B, cells were immunostained with Crk, CrkL, p120-catenin, pan-cadherin, and E-cadherin antibodies to visualize distribution of the proteins. Cells were also co-stained with a HSP90 antibody and phalloidin to visualize the cytoplasm and actin stress fibers, respectively. Yellow and white arrows indicate formation of cell-to-cell junctions. C, areas of DAPI-stained objects were calculated (see “Experimental Procedures”), and their mean ± S.D. values are shown. D, areas of HSP90-stained objects were calculated (see “Experimental Procedures”), and their mean ± S.D. values are shown. E, the circularity (roundness) of the cytoplasm (Cyto) and nucleus (Nuc) was measured (see “Experimental Procedures”), and their mean ± S.D. values are shown. ***, p < 0.001; **, p < 0.01, compared with control.
FIGURE 4.
FIGURE 4.
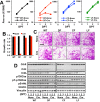
Reduced cell motility in the absence of Crk and CrkL. T antigen-immortalized Crk/CrkL double-floxed fibroblasts were transfected without synRNA (None) or with synCre (0.2 μg in 10 μl cell suspension). At 2 DPT, a wound was created by scratching through the cell monolayer with a micropipette tip, and cells were allowed to migrate into the gap at the wound site for 24 h, fixed, and stained with a HSP90 antibody and DAPI to visualize the cytoplasm and nucleus. A, after fluorescence images were taken, a ROI of 2230 × 1000 μm as the original wound gap was drawn (red rectangles) using the Nikon NIS element program. Six separate experiments were done for each group, and representative images are shown. Scale bar: 500 μm. B, DAPI-stained objects were counted using the Nikon NIS element program for the whole image and for the ROI. Data are shown as the mean ± S.D. (bars) values. C, the percentage of cells that migrated to the ROI was calculated for each image. Data are shown as the mean ± S.D. (bars) values. ***, p < 0.001, compared with control.
FIGURE 5.
FIGURE 5.
synCre concentration-dependent inhibition of cell proliferation. Wild-type (WT, A) and Crk/CrkL double-floxed (DF, B) fibroblasts immortalized by T antigen were transfected with increasing concentrations of synCre (μg in 10 μl cell suspension), and their cell proliferation was measured using WST-1. C, an exponential trend line for the WST-1 assay graph was drawn, and its slope, the coefficient of x, is presented as the rate for exponential cell growth. D, cells that were transfected with indicated concentrations of synCre were fixed at 3 DPT, and crystal violet images of cells were taken. Scale bar: 200 μm. E, total cell lysates were obtained from cells transfected with indicated concentrations of synCre at 3 DPT for Western blot analyses. Protein levels were compared among different synCre concentrations. F–K, protein bands were quantified using the Odyssey system, and their mean ± S.D. values are shown.
FIGURE 6.
FIGURE 6.
Cell proliferation in the absence of either Crk or CrkL. A, wild-type (WT), Crk/CrkL double-floxed (DF), Crk floxed (CF), and CrkL floxed (LF) fibroblasts immortalized by T antigen were transfected with synCre (0.2 μg in 10 μl of cell suspension), and their cell proliferation was measured using WST-1. B, an exponential trend line for the WST-1 assay graph was drawn, and its slope, the coefficient of x, is presented as the rate for exponential cell growth. C, crystal violet images of cells transfected without synRNA (None) or with synCre (Cre) were taken at 3 DPT. Scale bar: 200 μm. D, total cell lysates were obtained from cells at 3 DPT for Western blot analyses. Protein levels were compared between control and synCre-transfected cells. E, protein bands were quantified using the Odyssey system, calculated as percentages of the control (None at 1 DPT), and their mean ± S.D. values are shown.
FIGURE 6.
FIGURE 6.
Cell proliferation in the absence of either Crk or CrkL. A, wild-type (WT), Crk/CrkL double-floxed (DF), Crk floxed (CF), and CrkL floxed (LF) fibroblasts immortalized by T antigen were transfected with synCre (0.2 μg in 10 μl of cell suspension), and their cell proliferation was measured using WST-1. B, an exponential trend line for the WST-1 assay graph was drawn, and its slope, the coefficient of x, is presented as the rate for exponential cell growth. C, crystal violet images of cells transfected without synRNA (None) or with synCre (Cre) were taken at 3 DPT. Scale bar: 200 μm. D, total cell lysates were obtained from cells at 3 DPT for Western blot analyses. Protein levels were compared between control and synCre-transfected cells. E, protein bands were quantified using the Odyssey system, calculated as percentages of the control (None at 1 DPT), and their mean ± S.D. values are shown.
FIGURE 7.
FIGURE 7.
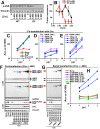
Recovery of cell proliferation by reintroduction of Crk and CrkL. T antigen-immortalized Crk/CrkL double-floxed (DF) fibroblasts were co-transfected with synCre (0.2 μg in 10 μl cell suspension) plus various Crk and CrkL constructs (2 μg of synRNA in 10 μl cell suspension), and their cell proliferation was measured using WST-1. A, schematic diagrams of various Crk and CrkL constructs. B, crystal violet images of cells transfected with various Crk and CrkL constructs with or without synCre were taken at 3 DPT. Scale bar: 200 μm. C, cells were fixed at 3 DPT and stained with phalloidin and DAPI to visualize actin stress fibers and the nucleus, respectively. D, proliferation of cells transfected with various Crk and CrkL constructs without synCre was measured using WST-1. E, proliferation of cells transfected with various Crk and CrkL constructs plus synCre was measured using WST-1. F, an exponential trend line for the WST-1 assay graph was drawn, and its slope, the coefficient of x, is presented as the rate for exponential cell growth. G, total cell lysates were obtained from cells at 3 DPT for Western blot analyses. Protein levels were compared among control, synCre-transfected cells and cells transfected with synCre plus various Crk and CrkL constructs. H, protein bands were quantified using the Odyssey system, and their mean ± S.D. values are shown in the graph. The protein levels of endogenous CrkII and CrkL in control cells served as references and were assigned 100% each, and relative protein levels of endogenous and exogenous proteins in cells expressing CRE and various Crk and CrkL constructs are normalized to their references. The steady state protein level of endogenous CrkI was ∼5% that of endogenous CrkII in normal cells.
FIGURE 8.
FIGURE 8.
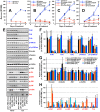
Failed rescue of cell proliferation by JNK activation. A and B, T antigen-immortalized wild-type (WT) and Crk/CrkL double-floxed (DF) fibroblasts were transfected with different concentrations of synCre (μg in 10 μl cell suspension), and protein levels of phosphorylated JNKs were compared. Protein bands for phosphorylated JNKs were quantified using the Odyssey system, and their mean ± S.D. values at different synCre concentrations are shown. C–H, proliferation of T antigen-immortalized Crk/CrkL double-floxed (DF) fibroblasts co-transfected with synCre (0.2 μg) plus CrkII (2 μg synRNA) (D) or different concentrations (μg) of synRNA or DNA for constitutively active JNKs, MKK-JNK1 (D) and MKK-JNK2 (E) was measured using WST-1. F, total cell lysates were obtained from cells co-transfected with synCre plus constitutively active JNKs for Western blot analyses. Protein levels of JNKs and phosphorylated JNKs at 1 DPT, and those of Crk and CrkL at 3 DPT are shown. G, total cell lysates were obtained from cells serially transfected with synCre first and 16 h later with constitutively active JNKs for Western blot analyses. Protein levels of JNKs and phosphorylated JNKs at 1 DPT and those of Crk and CrkL at 3 DPT are shown. H, proliferation of cells that were serially transfected first with synCre (0.2 μg) and 16 h later with different concentrations (μg) of constitutively active JNKs was measured using WST-1.
FIGURE 9.
FIGURE 9.
Cell proliferation and activation of signaling molecules in response to serum and growth factors. A–D, T antigen-immortalized Crk/CrkL double-floxed (DF) fibroblasts were transfected without synRNA (None) or with synCre (0.2 μg in 10 μl cell suspension), plated onto 48-well plates (3000 cells/well), and cultured in normal serum (10% FBS) overnight. The medium was then replaced with DMEM plus low serum (0.5% FBS) with or without growth factors (100 ng/ml EGF, 50 ng/ml basic FGF, or 50 ng/ml PDGF), and cell proliferation for 4 days was measured using WST-1. Data are shown as the mean ± S.D. (bars) values. *, p < 0.05, **, p < 0.01, compared with low serum without growth factor treatment. E, T antigen-immortalized Crk/CrkL double-floxed (DF) fibroblasts were transfected with synCre (0.2 μg in 10 μl cell suspension) and cultured in normal serum (10% FBS) for 2 days. The medium was then replaced with DMEM plus low serum (0.5% FBS), and cells were cultured for additional 24 h. Then cells were stimulated with DMEM plus high serum (20% FBS) or 50 ng/ml basic FGF for 5 min or 1 h at 37 °C, and total cell lysates were obtained for Western blot analyses. F–H, protein bands were quantified using the Odyssey system, calculated as percentages of the control (None stimulated with 20% FBS for 1 h), and their mean ± S.D. values are shown. Whereas levels of CrkII, CrkI, CrkL, p130Cas, and phosphorylated p130Cas substantially decreased by synCre transfection, levels of vinculin, α-tubulin, JNK, phosphorylated cofilin, and phosphorylated TOR did not change by synCre transfection.
FIGURE 10.
FIGURE 10.
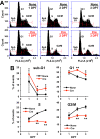
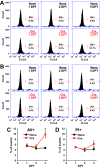
Cell cycle analysis. T antigen-immortalized Crk/CrkL double-floxed (DF) fibroblasts were transfected without synRNA (None) or with synCre (0.2 μg in 10 μl cell suspension), cultured, and fixed with ethanol at the indicated DPT for flow cytometry analyses using propidium iodide. Experiments were done in triplicate for each group. A, histograms of representative propidium iodide staining are shown. B, percentages of events for cell cycle phases are calculated, and their mean ± S.D. values are shown. *, p < 0.05; **, p < 0.01, compared with control.
FIGURE 11.
FIGURE 11.
Cell death analysis. T antigen-immortalized Crk/CrkL double-floxed (DF) fibroblasts were transfected without synRNA (None) or with synCre (0.2 μg in 10 μl cell suspension), cultured, and harvested at the indicated DPT for flow cytometry analyses using annexin V and propidium iodide to detect apoptosis and necrosis, respectively. Experiments were done in triplicate for each group. A and B, three separate experiments for annexin V staining were done, and representative histograms for annexin V (A) and propidium iodide staining (B) are shown. C and D, percentages of annexin V (AV)-positive (C) and propidium iodide (PI)-positive cells (D) are calculated, and their mean ± S.D. values are shown. *, p < 0.05, compared with control.

References

    1. Mayer B. J., Hamaguchi M., and Hanafusa H. (1988) Characterization of p47gag-crk, a novel oncogene product with sequence similarity to a putative modulatory domain of protein-tyrosine kinases and phospholipase C. Cold Spring Harb. Symp. Quant. Biol. 53, 907–914 - PubMed
    1. Kumar S., Fajardo J. E., Birge R. B., and Sriram G. (2014) Crk at the quarter century mark: perspectives in signaling and cancer. J. Cell. Biochem. 115, 819–825 - PubMed
    1. Matsuda M., Tanaka S., Nagata S., Kojima A., Kurata T., and Shibuya M. (1992) Two species of human CRK cDNA encode proteins with distinct biological activities. Mol. Cell. Biol. 12, 3482–3489 - PMC - PubMed
    1. Senechal K., Halpern J., and Sawyers C. L. (1996) The CRKL adaptor protein transforms fibroblasts and functions in transformation by the BCR-ABL oncogene. J. Biol. Chem. 271, 23255–23261 - PubMed
    1. Yamada S., Yanamoto S., Kawasaki G., Rokutanda S., Yonezawa H., Kawakita A., and Nemoto T. K. (2011) Overexpression of CRKII increases migration and invasive potential in oral squamous cell carcinoma. Cancer Lett. 303, 84–91 - PubMed

MeSH terms

Substances

LinkOut - more resources