. 2016 Oct 15;30(20):2325-2338.
doi: 10.1101/gad.285429.116. Epub 2016 Nov 2.

Hair follicles' transit-amplifying cells govern concurrent dermal adipocyte production through Sonic Hedgehog

Affiliations

Hair follicles' transit-amplifying cells govern concurrent dermal adipocyte production through Sonic Hedgehog

Bing Zhang et al. Genes Dev. .

Abstract

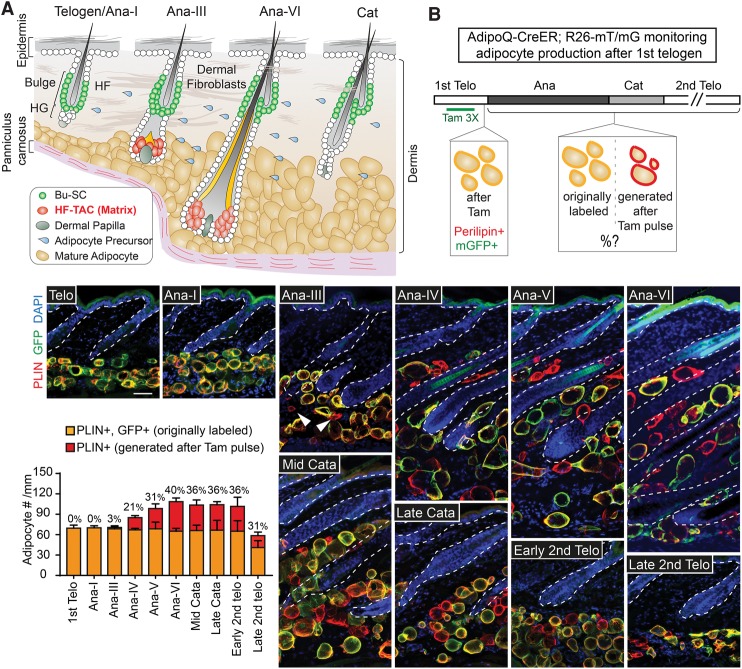
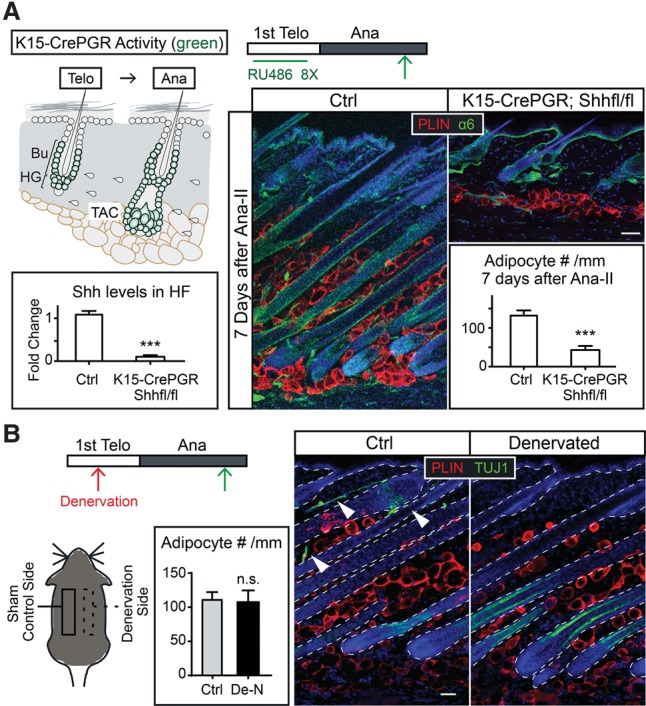
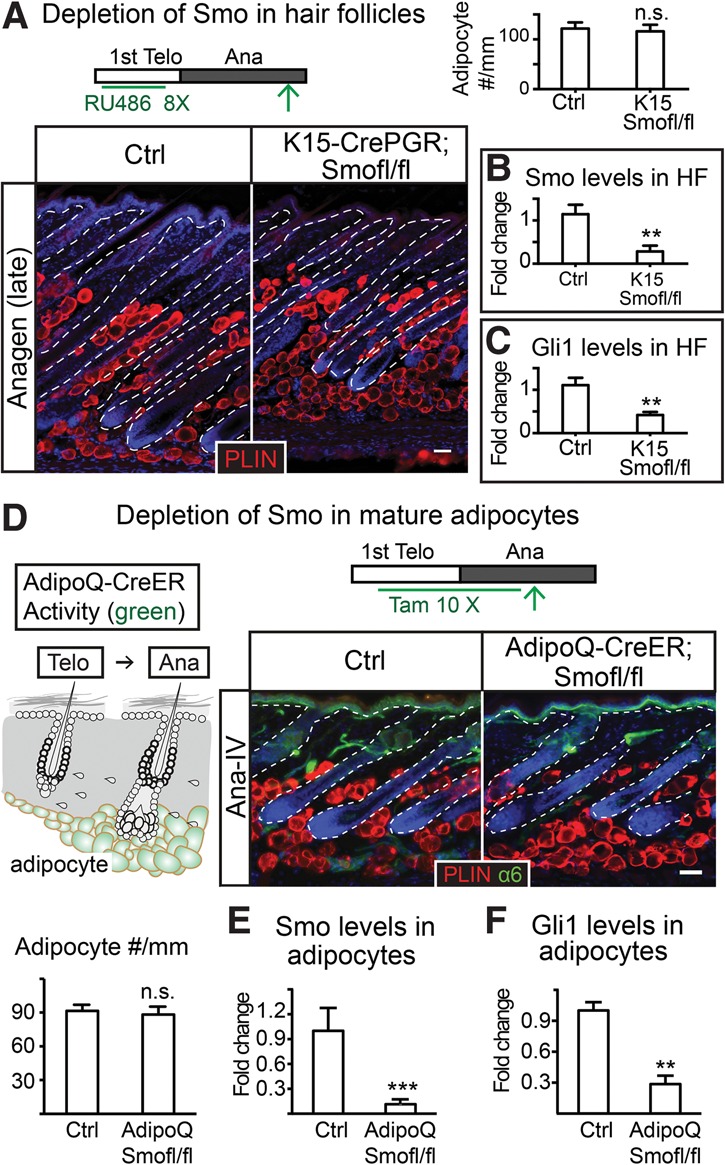
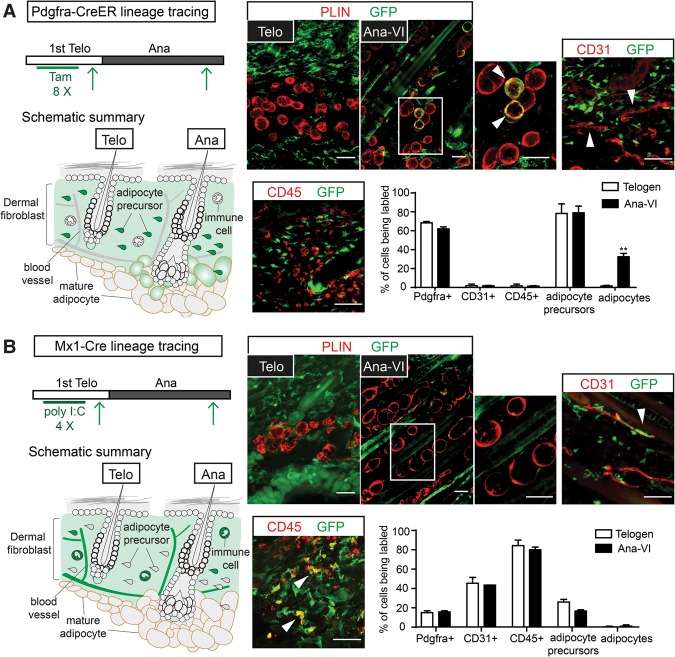
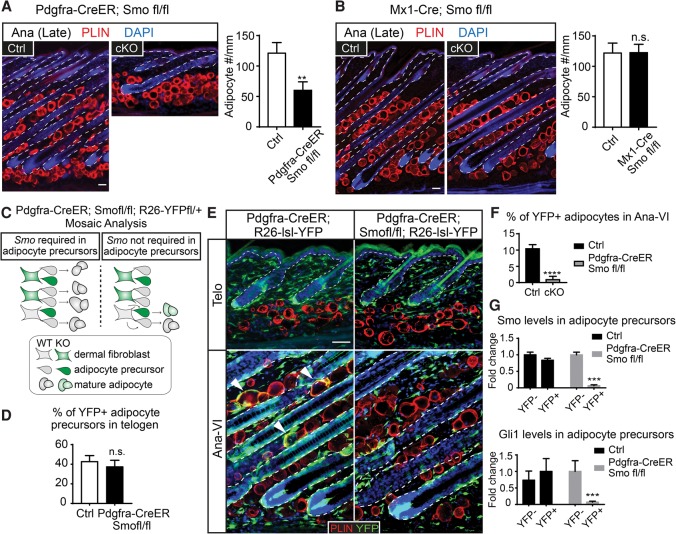
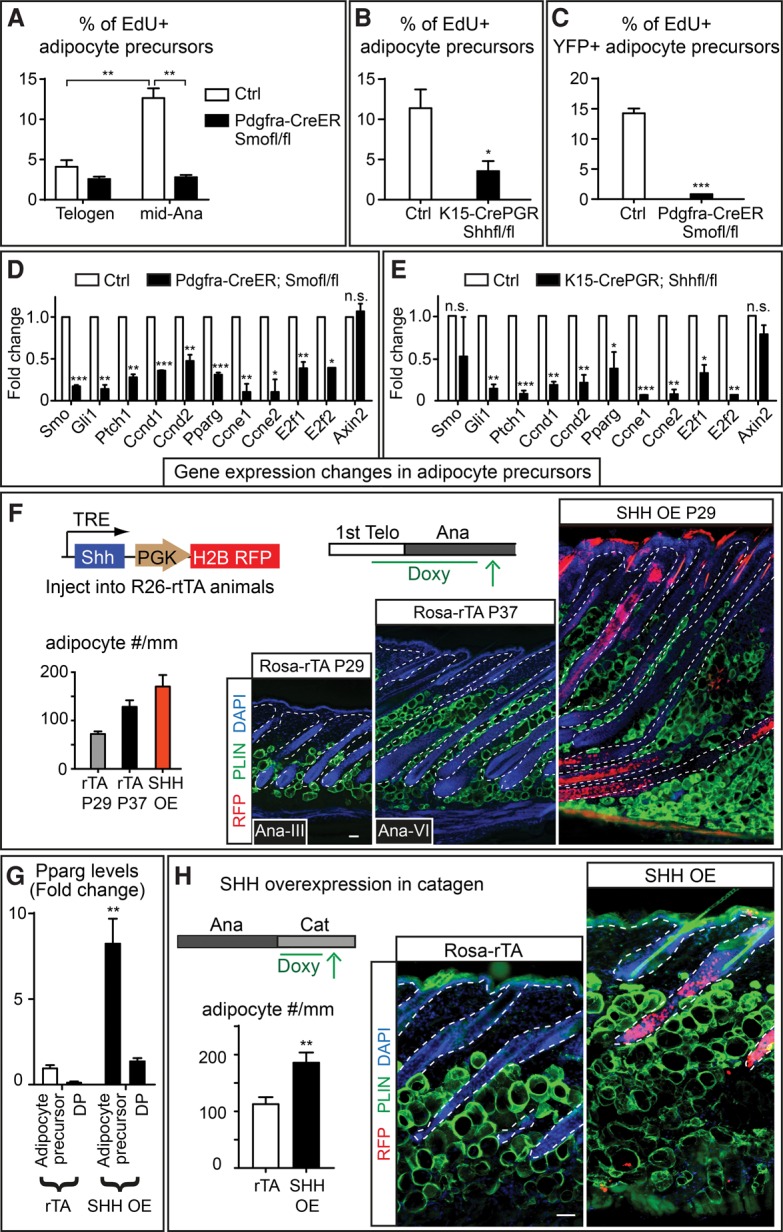
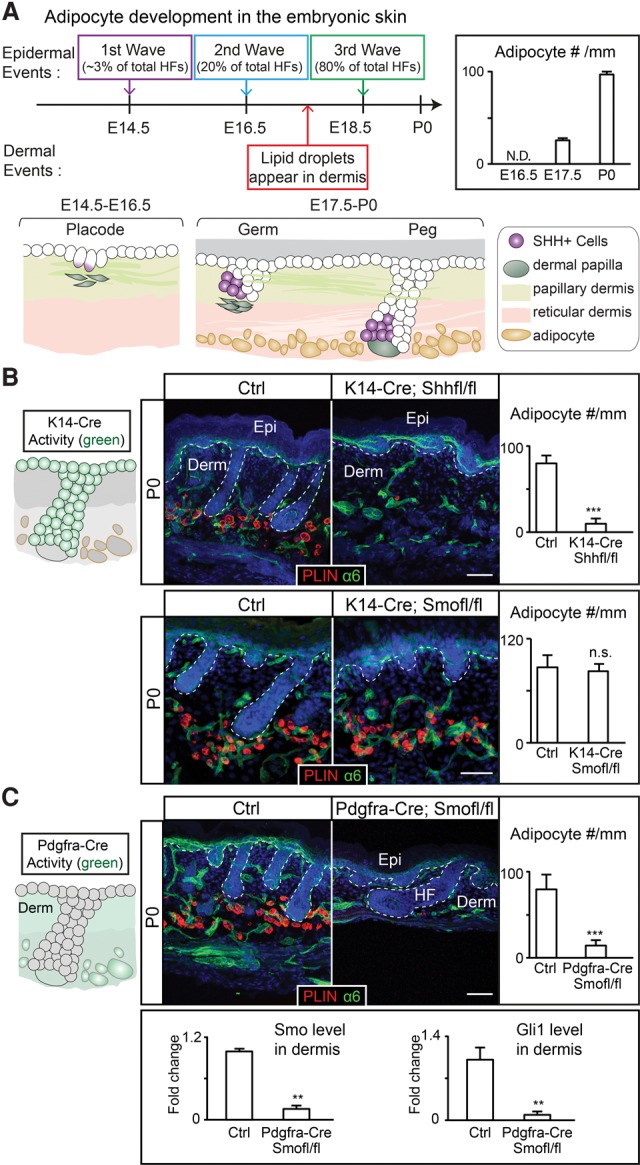
Growth and regeneration of one tissue within an organ compels accommodative changes in the surrounding tissues. However, the molecular nature and operating logic governing these concurrent changes remain poorly defined. The dermal adipose layer expands concomitantly with hair follicle downgrowth, providing a paradigm for studying coordinated changes of surrounding lineages with a regenerating tissue. Here, we discover that hair follicle transit-amplifying cells (HF-TACs) play an essential role in orchestrating dermal adipogenesis through secreting Sonic Hedgehog (SHH). Depletion of Shh from HF-TACs abrogates both dermal adipogenesis and hair follicle growth. Using cell type-specific deletion of Smo, a gene required in SHH-receiving cells, we found that SHH does not act on hair follicles, adipocytes, endothelial cells, and hematopoietic cells for adipogenesis. Instead, SHH acts directly on adipocyte precursors, promoting their proliferation and their expression of a key adipogenic gene, peroxisome proliferator-activated receptor γ (Pparg), to induce dermal adipogenesis. Our study therefore uncovers a critical role for TACs in orchestrating the generation of both their own progeny and a neighboring lineage to achieve concomitant tissue production across lineages.

Keywords: adipocyte precursors; adipogenesis; hair follicle regeneration; interlineage communications; stroma; transit-amplifying cells.


Figures

Figure 1.
Figure 1.
Dermal adipogenesis commences after the formation of HF-TACs and stops upon HF-TAC destruction. (A) Schematic of the skin at distinct hair cycle stages illustrating different cell types and their relative positions. HF-TACs are formed at mid-anagen and are absent in telogen, anagen I (Ana-I), or catagen hair follicles. (B) Tamoxifen (Tam)-treated AdipoQ-CreER; Rosa26-lox membrane tdTomato–lox membrane GFP (R26-mT/mG) mice taken at different hair cycle stages. Tamoxifen treatment (three times, 3×) leads to activation of membrane GFP (mGFP) in existing adipoctyes at the first telogen, which appears as membrane GFP- and Perilipin (PLIN)-double-positive (yellow). Adipocytes generated after this labeling period are Perilipin-positive but negative for membrane GFP (red). The bar graph quantifies the number of adipocytes found in each millimeter width of skin. The percentages on the bar graph denote the percentage of adipocytes generated after initial tamoxifen labeling among total adipocytes found at each hair cycle substage. (Arrowheads) Newly generated adipocytes. n = 2 mice for each stage. Data are mean ± SD. Bars, 50 µm.
Figure 2.
Figure 2.
Depletion of Shh from HF-TACs abrogates anagen-associated dermal adipogenesis, while nerve-derived SHH is dispensable. (A) Conditional deletion of Shh from the adult hair follicles (using K15-CrePGR) prior to anagen entry inhibits both hair follicle downgrowth and dermal adipogenesis. Schematics show a K15-CrePGR induction scheme and cells that are positive for Cre activity (denoted in green) after K15-CrePGR is induced in telogen by RU486. Green arrows denote the time points when skin samples were taken. Integrin α6 staining marks the basement membrane separating epithelial cells and dermal cells. Shh levels in the hair follicles (HF) were determined by RT–PCR of FACS-purified YFP+ cells isolated from K15-CrePGR; R26-lsl-YFP and K15-CrePGR; R26-lsl-YFP; Shhfl/fl skin. Adipocyte numbers are quantified as numbers of Perilipin+ (PLIN+) cells per millimeter of skin width. n = 2 mice for control; n = 4 mice for knockout. (B) Immunolabeling of Tuj1 (a pan-neuronal marker that also marks inner hair follicles) and Perilipin on the denervated (De-N) side and the sham-operated control side of the same mouse. Denervation was conducted in telogen, and the skin samples were taken in full anagen. n = 3 mice. (Arrowheads) Nerve fibers. Data are mean ± SD. Bars, 50 µm. (***) P < 0.001; (n.s.) not significant.
Figure 3.
Figure 3.
SHH pathway activity is not required in the hair follicles or mature adipocytes to promote adipogenesis in anagen. (A) Depletion of Smo with K15-CrePGR results in no changes in dermal adipocyte numbers. Bars represent the number of Perilipin+ cells per millimeter width of skin in each genotype. n = 2 for control; n = 3 mice for knockout. (B,C) RT–PCR of Smo (B) and Gli1 (C) in hair follicles isolated from control and K15-CrePGR; Smof/fl anagen skin. (D) Deleting Smo with AdipoQ-CreER throughout telogen and anagen results in no change in dermal adipocyte numbers. The schematic represents an induction scheme and cells positive for Cre activity after 10 tamoxifen treatments (10×) throughout telogen and anagen. The bar graph quantifies the number of Perilipin+ cells per millimeter width of skin. (E,F) RT–PCR of Smo (E) and Gli1 (F) in mature dermal adipocytes isolated from control and AdipoQ-CreER; Smof/fl anagen skin. n = 4 mice for each genotype. The epidermis and hair follicles are outlined by white dashed lines. Data are mean ± SD. Bars, 50 µm. (***) P < 0.001; (**) P < 0.01; (n.s.) not significant.
Figure 4.
Figure 4.
Pdgfra-CreER and Mx1-Cre mark distinct cell types in the dermis. (A) Lineage tracing with Pdgfra-CreER to monitor Cre activity and progeny derived from Pdgfra-CreER+ cells. Pdgfra-CreER was crossed to R26-lsl-YFP or R26-mT/mG mice. Tamoxifen was given at telogen. Skin biopsy samples were first taken after injection at telogen to determine cell types labeled by Pdgfra-CreER prior to anagen entry. Another skin sample was then taken at Ana-VI to monitor cell types that were labeled by Rosa reporters at the end of anagen. The schematics summarize the induction scheme and lineage-tracing results. Note that the number of labeled adipocytes increases significantly at anagen, suggesting that Pdgfra-CreER labels adipocyte precursors giving rise to mature adipocytes in anagen. (B) Lineage tracing with Mx1-Cre; R26-lsl-YFP to monitor Cre activity and progeny derived from Mx1-Cre+ cells. Polyinosinic:polycytidylic acid (poly I:C) was given to Mx1-Cre; R26-lsl-YFP mice at telogen. First, biopsy samples were taken at telogen after poly I:C injections, and another skin sample was taken at the end of anagen. The schematics summarize the induction scheme and lineage-tracing results. Images at the right show representative examples for labeled cells (stained as GFP+) together with markers of distinct dermal cell types. Immunofluorescence staining shows labeled cells (GFP+) in relation to markers of adipocytes (PLIN), endothelial cells (CD31), and immune cells (CD45). Bars quantify the percentage of cells being labeled for each cell type at different hair cycle stages. The percentages of labeled Pdgfra+ (pan-fibroblasts: Pdgfra+, CD31, and CD45), CD31+ (endothelial cells), CD45+ (pan-immune cells), and adipocyte precursors (CD24+, Sca1+, CD31, and CD45) were quantified with FACS analysis. Mature adipocytes were quantified by counting the numbers of Perilipin- and GFP-double-positive cells among all Perilipin-positive cells in the dermis. n = 2 mice for each genotype. Data are mean ± SD. Bars, 50 µm. (**) P < 0.01.
Figure 5.
Figure 5.
Deletion of Smo in adipocyte precursors inhibits dermal adipogenesis. (A,B) Full-anagen skin samples from controls, Pdgfra-CreER; Smofl/fl (n = 6), and Mx1-Cre; Smofl/fl (n = 4) with immunolabeling of Perilipin and quantification of adipocyte numbers per millimeter width of skin. (CG) Mosaic analysis assessing the autonomous requirement of Smo in adipocyte precursors. (C,D) Reduction of tamoxifen treatment (four times in telogen) leads to partial activation of Pdgfra-CreER in a subset of adipocyte precursors, which is revealed as the YFP+ subset. The percentages of YFP+ adipocyte precursors right after tamoxifen pulse in control (Pdgfra-CreER; R26-lsl-YFP) and Pdgfra-CreER; R26-lsl-YFP; Smofl/fl are similar, as shown in D. (E,F) The YFP+ adipocytes in Pdgfra-CreER; R26-lsl-YFP control and Pdgfra-CreER; Smofl/fl; R26-lsl-YFP animals at the telogen and anagen stages are imaged and quantified. n = 3. Note that while YFP+ adipocytes exist in Pdgfra-CreER; R26-lsl-YFP skin (arrowheads, black bar in F), few if any YFP+ adipocytes are found in Pdgfra-CreER; Smofl/fl; R26-lsl-YFP skin (gray bar in F). (G) RT–PCR of Smo and Gli1 in YFP+ and YFP adipocyte precursors purified from Pdgfra-CreER; R26-lsl-YFP control and Pdgfra-CreER; Smofl/fl; R26-lsl-YFP animals. Data are mean ± SD. Bars, 50 µm. (****) P < 0.0001; (***) P < 0.001; (**) P < 0.01; (n.s.) not significant.
Figure 6.
Figure 6.
Reduction of SHH signaling inhibits adipocyte precursor proliferation, while overexpression of Shh promotes adipogenesis independently of hair cycle status. (A) Quantification of EdU+ adipocyte precursors in control and Pdgfra-CreER; Smofl/fl animals at different hair cycle stages. Adipocyte precursors were FACS-purified as Pdgfra+, CD24+, Sca1+, CD31 and CD45. (B) Quantification of EdU+ adipocyte precursors in control and K15-CrePGR; Shhfl/fl mice at mid-anagen. (C) Quantification of EdU+ YFP+ adipocyte precursors in Pdgfra-CreER; R26-lsl-YFP control and Pdgfra-CreER; Smofl/fl; R26-lsl-YFP animals at mid-anagen after mosaic induction of Pdgfra-CreER (four tamoxifen injections). (D) RT–PCR analysis for gene expression changes in adipocyte precursors FACS-purified from control and Pdgfra-CreER; Smofl/fl animals at mid-anagen. (E) RT–PCR analysis for gene expression changes in adipocyte precursors purified from control and K15-CrePGR; Shhfl/fl animals at mid-anagen. (F) Overexpression of SHH by transducing the skin with lentiviruses containing doxycycline (Doxy)-regulatable SHH. Doxycycline was given from postnatal day 21 (P21) to P29. Both the littermate age control (Rosa-rTA P29) and Ana-VI control (Rosa-rTA P37) are shown as comparisons with the SHH overexpression skin. The analysis of variance reveals a significant difference among these three groups. F2,15 = 47.18. P < 0.0001, one-way ANOVA. n = 2 mice for Rosa-rtTA controls; n = 3 mice for SHH overexpression. (G) RT–PCR of Pparg in dermal papilla (DP) and adipocyte precursors FACS-purified from Rosa-rtTA control and SHH overexpression skins. (H) Overexpression of SHH in catagen by transducing Rosa-rtTA mice with doxycycline-regulatable SHH as in F, but doxycycline was given after catagen entry for 5 d. Data are mean ± SD. Bars, 50 μm. (***) P < 0.001; (**) P < 0.01; (*) P < 0.05; (n.s.) not significant.
Figure 7.
Figure 7.
The SHH pathway is required for the de novo formation of dermal adipocytes during development. (A) De novo formation of adipocytes in the embryonic dermis begins between the second and third wave of hair follicle development at E17.5. The schematic summarizes SHH+ cells found in different stages (placode, germ, and peg stages) of hair follicles during development. The bar graph summarizes the number of Perilipin+ cells per millimeter width of skin at different embryonic/postnatal days. (N.D.) Not determined. n = 3 mice for each stage. (B) Deletion of Shh from the embryonic epidermis and hair follicles by K14-Cre prevents dermal adipocyte formation, while deletion of Smo using K14-Cre results in changes in hair follicle length but no changes in adipocyte formation. Cells derived from K14-Cre+ embryonic progenitors are denoted in green in the schematic. Bars represent the number of Perlipin+ cells per millimeter width of skin. n = 4. (C) Schematic showing cells derived from Pdgfra-Cre+ cells at P0. Deleting Smo using Pdgfra-Cre leads to severe deficits in dermal adipocyte formation. The bar graphs represent the number of Perilipin+ cells per millimeter width of skin and RT–PCR of Smo and Gli1 in FACS-purified Pdgfra+ cells. n = 4. Data are mean ± SD. Bars, 50 μm. (***) P < 0.001; (**) P < 0.01; (n.s.) not significant.

Comment in

References

    1. Beronja S, Livshits G, Williams S, Fuchs E. 2010. Rapid functional dissection of genetic networks via tissue-specific transduction and RNAi in mouse embryos. Nat Med 16: 821–827. - PMC - PubMed
    1. Bhatia B, Hsieh M, Kenney AM, Nahle Z. 2011. Mitogenic Sonic hedgehog signaling drives E2F1-dependent lipogenesis in progenitor cells and medulloblastoma. Oncogene 30: 410–422. - PMC - PubMed
    1. Blanpain C, Fuchs E. 2009. Epidermal homeostasis: a balancing act of stem cells in the skin. Nat Rev Mol Cell Biol 10: 207–217. - PMC - PubMed
    1. Brownell I, Guevara E, Bai CB, Loomis CA, Joyner AL. 2011. Nerve-derived sonic hedgehog defines a niche for hair follicle stem cells capable of becoming epidermal stem cells. Cell Stem Cell 8: 552–565. - PMC - PubMed
    1. Chang CY, Pasolli HA, Giannopoulou EG, Guasch G, Gronostajski RM, Elemento O, Fuchs E. 2013. NFIB is a governor of epithelial–melanocyte stem cell behaviour in a shared niche. Nature 495: 98–102. - PMC - PubMed