A POGLUT1 mutation causes a muscular dystrophy with reduced Notch signaling and satellite cell loss
- PMID: 27807076
- PMCID: PMC5090660
- DOI: 10.15252/emmm.201505815
A POGLUT1 mutation causes a muscular dystrophy with reduced Notch signaling and satellite cell loss
Abstract
Skeletal muscle regeneration by muscle satellite cells is a physiological mechanism activated upon muscle damage and regulated by Notch signaling. In a family with autosomal recessive limb-girdle muscular dystrophy, we identified a missense mutation in POGLUT1 (protein O-glucosyltransferase 1), an enzyme involved in Notch posttranslational modification and function. In vitro and in vivo experiments demonstrated that the mutation reduces O-glucosyltransferase activity on Notch and impairs muscle development. Muscles from patients revealed decreased Notch signaling, dramatic reduction in satellite cell pool and a muscle-specific α-dystroglycan hypoglycosylation not present in patients' fibroblasts. Primary myoblasts from patients showed slow proliferation, facilitated differentiation, and a decreased pool of quiescent PAX7+ cells. A robust rescue of the myogenesis was demonstrated by increasing Notch signaling. None of these alterations were found in muscles from secondary dystroglycanopathy patients. These data suggest that a key pathomechanism for this novel form of muscular dystrophy is Notch-dependent loss of satellite cells.
Keywords: Notch; O‐glycosylation; POGLUT1; muscular dystrophy; satellite cell.
© 2016 The Authors. Published under the terms of the CC BY 4.0 license.
Figures

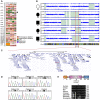
The family pedigree, where circles denote female members, squares male members, solid symbols affected members, and white symbols asymptomatic members with normal physical exam; the dots indicate heterozygous carriers, and double line denotes a consanguineous marriage. The pictures show scapular winging, which is a consistent clinical sign in affected individuals.
Hematoxylin and eosin staining (H&E) of skeletal muscle from patient II.1 shows histological features of moderate‐to‐severe dystrophic pattern. Scale bar, 50 μm.
T1‐weighted MRI axial images at thigh and calf levels show that the fatty degeneration is more prominent in thigh muscles, equally affecting posterior and anterior compartments, with relative sparing of the rectus femoris, sartorius, and gracilis muscles until late stages (4, 10, and 11, respectively). Strikingly, the fatty tissue is located in the internal parts of almost all the affected muscles in thigh (1, 2, 3, 5–9), while the external regions are spared. At calf level, only the gastrocnemius medialis muscle (12) shows this pattern, while the soleus (13) is diffusely involved. Patient II.2 (PII.2) shows late‐stage thigh muscles with an unusual involvement of the tibialis posterior muscle (14) in the lower leg.

Muscle sections show variable labeling using an antibody against glycosylated α‐dystroglycan (αDG‐IIH6), whereas labeling using antibodies against α‐dystroglycan core protein (αDG‐Core), β‐dystroglycan (βDG), and laminin‐α2 is similar to control (scale bar, 100 μm).
Western blots and ligand overlay (O/L) of wheat germ agglutinin‐enriched muscle and fibroblasts lysates from PII.2, PII.5, the healthy sibling (HII.3), and healthy controls (Ctr, Ctr1, and Ctr2) (muscle: 250 μg protein/lane, fibroblasts: 800 μg/lane). In muscle, expression of αDG‐IIH6 is reduced, but the αDG‐Core shows similar expression as controls, with a slight reduction in molecular weight; laminin overlay assay detected some binding activity but was diminished compared with controls, whereas agrin‐binding activity showed no difference with controls. In fibroblasts, both αDG‐IIH6 and αDG‐Core expression and laminin‐binding activity were normal, suggesting that unlike other muscular dystrophies, α‐dystroglycan glycosylation defect is muscle specific in POGLUT1 patients.
No ultrastructural alterations are observed in muscle by electron microscopy (6–7 fields were captured from PII.1, PII.3, and PII.5). Note normal basement membrane compaction (arrowheads). Original magnification: ×26,700.

Genomewide mapping through high‐density genotyping. The structural genomic variation and extended regions of homozygosity (loss of heterozygosity [LOH]) over the entire genome is shown for individuals II.1 to II.5. The homozygosity segment shared by the four affected siblings in chromosome 3 is indicated with an arrow.
This region is represented in more detail, where extended regions of homozygous genotypes in contiguous biallelic polymorphisms are highlighted with a green background.
The 14.6 megabase region of homozygosity that is shared by all affected siblings is highlighted by vertical red lines in (B), and genes within this genomic region are shown. Note that POGLUT1 gene is underlined.
Chromatograms reveal a homozygous T‐to‐G substitution (black boxes and arrowheads) in the four affected family members, while a heterozygous G/T in the healthy sibling.
Schematic structure of the human POGLUT1 protein, which contains a signal peptide (SP), a CAP10 domain, and a Lys‐Asp‐Glu‐Leu (KDEL)‐like endoplasmic reticulum retention signal. D233E is located in the CAP10 domain (arrow), close to the predicted ERD catalytic motif (asterisk). Alignment of amino acids flanking the mutated aspartic acid from POGLUT1 orthologs indicates evolutionary conservation of D233 in vertebrates (open arrowhead). Black boxes denote similarity of amino acid residues.

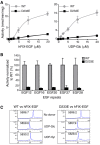
Protein O‐glucosyltransferase activity of wild‐type (WT) or D233E mutant POGLUT1 protein toward human factor IX EGF repeat (hFIX‐EGF). Wild type shows higher O‐glucosyltransferase activity than D233E, and this activity is dependent on the concentration of the acceptor substrate hFIX‐EGF repeat (left) and on the concentration of donor substrate UDP‐glucose (UDP‐Glc) (right). Values indicate mean ± SEM from three independent assays.
O‐Glucosyltransferase activity toward five different single EGF repeats from mouse Notch1. Wild‐type POGLUT1 shows higher activity toward all EGF repeats tested than POGLUT1D233E. The y‐axis shows the normalized activity relative to wild‐type POGLUT1. EGF repeats were at 10 μM. Values indicate mean ± SEM from three independent assays.
Elution profiles of the POGLUT1 reaction products on reverse‐phase HPLC. hFIX‐EGF repeat was incubated with wild‐type or D233E mutant POGLUT1 and donor substrate, UDP‐Glc or UDP‐xylose (UDP‐Xyl), at 37°C overnight. Values on top of the peaks indicate the measured masses. Addition of Glc (162 Da) or xylose (132 Da) to hFIX‐EGF (5696.2 Da) by wild‐type POGLUT1 caused a shift to an earlier retention time (left). Similarly, the products exhibited a similar shift after incubation with POGLUT1D233E (right). These results indicate that POGLUT1D233E can add a single glucose or xylose to hFIX‐EGF repeats and thus has residual enzymatic activity.

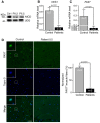
- A
Western blot of muscle homogenates shows reduced expression of Notch1 intracellular domain (NICD) in patients.
- B, C
qRT–PCR on RNA extracted from skeletal muscle shows that expression of HES1 (B) and PAX7 (C) was significantly lower in D233E patients compared with healthy controls. Mean ± SEM; Student's t‐test (B) and Mann–Whitney U‐test (C).
- D
PAX7+ cells in skeletal muscle sections, demonstrating that satellite cells are less abundant in D233E patients than in controls (n = 3 muscles with 10–15 fields analyzed per muscle). Mean ± SEM; Mann–Whitney U‐test; scale bar, 50 μm.

- A–A″
Staining of Drosophila indirect flight muscles at 25% pupal development with 22C10 antibody (myotube marker) and anti‐Twist antibody (myoblast marker) indicates that in wild‐type animals, indirect flight muscles are formed from six myotubes, and a large number of Twist+ myoblasts are present.
- B–B″
rumi 79/79 mutants raised at 18°C show no obvious defects in myoblast number or myotube morphology.
- C–D″
rumi 79/79 mutants exhibit decreased number of myoblasts at 25–30°C and either an incomplete set of short myotubes when raised at 25°C or aberrant morphology of myotubes when raised at 30°C.
- E–E″
rumi 79/79 animals overexpressing FLAG‐tagged POGLUT1WT in the muscle compartment using Mef2‐GAL4 and raised at 25°C during the pupal stage show a rescue of the rumi 79/79 muscle phenotype.
- F–G″
Overexpression of FLAG‐tagged POGLUT1D233E only partially rescues the rumi 79/79 muscle phenotype, with some variation in the myotube length and the number of restored Twist+ cells (compare G and F). Note that the number of Twist+ cells restored by POGLUT1D233E is much smaller than that restored by POGLUT1WT.
- H
Quantification of myotube lengths in rumi 79/79 mutants with or without POGLUT1 expression indicates a weak rescue of the phenotypes by POGLUT1D233E compared with POGLUT1WT. The differences in myotube lengths are statistically significant. For rumi 79/79 rescue (left bar), 5 animals were used and a total of 23 myotubes were measured; for D233E rescue, 11 animals and 54 myotubes; for WT rescue, 5 animals and 22 myotubes. Mean ± SD is shown; one‐way ANOVA with Bonferroni's multiple comparisons test.

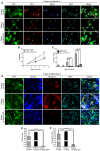
- A–F
Proliferation assays examined proliferating (PAX7+ MyoD+, arrows), self‐renewing (PAX7+ MyoD−, open arrows), and differentiating (PAX7− MyoD+, arrowheads) cells from D233E patients (n = 2), healthy controls (n = 3), and disease controls (n = 3) at 1, 4, and 8 days growing in proliferation medium. Panel (A) shows representative images from day 8. The number of patient myoblasts is lower than that of controls at all three time points, indicating a slower proliferation rate in patient myoblasts (B), and accordingly, the percentage of proliferating cells (C) is smaller in the patient. (D) The percentage of self‐renewing cells is small in patient's culture, reflecting a poor capacity for maintaining the pool of quiescent SCs. In addition, the percentage of PAX7+ cells (E) is smaller in patient's culture, similar to what was found in adult D233E muscle (shown in Fig 5D). (F) The percentage of differentiating cells is higher in the patient. We examined proliferation capturing 7–12 randomly fields per day and condition (mean ± SEM is shown; Kruskal–Wallis with Dunn's multiple comparisons test; scale bar, 50 μm).
- G–I
When myoblasts started to be confluent, the proliferation medium was replaced with differentiation medium, and the myoblasts started to fuse yielding myotubes, which were analyzed after 4 days of differentiation. (H) The fusion index, which measures the percentage of nuclei in myotubes with respect to the total number of nuclei in myogenic cells, was higher in D233E cultures than in controls. (I) Besides, myogenin showed increased expression in D233E myoblast cultures compared with controls. The data support that differentiation process is facilitated in patient's muscle. Data were collected from 3 to 10 randomly chosen areas per condition (mean ± SEM is shown; Kruskal–Wallis with Dunn's multiple comparisons test (H) and one‐way ANOVA with Bonferroni's multiple comparisons test (I); scale bar, 50 μm).

- A–C
We overexpressed NICD in immortalized primary myoblasts to rescue the features displayed by immortalized D233E myoblasts. (B) We analyzed the proliferation at 1, 3, and 5 days, and proliferation rate in patient‐LV‐NICD‐GFP reached the level observed in control‐LV‐GFP, which were higher than in patient‐LV‐GFP. (C) However, the percentage of PAX7+ cells in patient‐LV‐NICD‐GFP showed the same reduced value as in patient‐LV‐GFP, which were significantly lower than in control‐LV‐GFP. The majority of control myoblasts were proliferating cells (PAX7+ MyoD+, arrows), with no quiescent cells and few differentiating cells (PAX7− MyoD+, arrowheads) detected. Data were collected from n = 2 independent assays (5–8 images per condition). Mean ± SEM is shown; one‐way ANOVA with Tukey multiple comparisons test (B) and Kruskal–Wallis with Dunn's multiple comparisons test (C); scale bar, 50 μm.
- D–F
As previously described in patient's primary myoblasts, patient‐LV‐GFP myoblasts showed a striking facilitated differentiation compared with control‐LV‐GFP myoblasts. This phenotype fully disappeared in patient‐LV‐GFP‐NICD myoblasts, as quantification of the fusion index (E), and myogenin expression (F) demonstrated. The data support a pathogenic role for Notch inhibition on the altered differentiation in our patients. Data were collected from n = 3 independent assays (13–17 images per condition). Mean ± SEM is shown; Kruskal–Wallis with Dunn's multiple comparisons test; scale bar, 50 μm.

- A
Immortalized primary myoblasts from a healthy control showed a progressive pattern of α‐dystroglycan glycosylation during 5 days of differentiation (D0–D5), as has been previously described by Goddeeris et al (2013). Immortalized primary myoblasts from patients displayed an irregular pattern of glycosylation, with a final level of glycosylated α‐dystroglycan that was lower than control.
- B
α‐dystroglycan glycosylation of infected immortalized myoblasts from patient‐LV‐NICD‐GFP at differentiation day 5 (D5) showed a striking reduction, in line with the strong inhibition of myotubes formation and differentiation induced by NICD overexpression. α‐dystroglycan in myoblasts from patient‐LV‐GFP showed a reduction in glycosylation compared with control‐LV‐GFP at D5, similar to the results obtained in the adult muscle from patients (Fig 2).
- C, D
C2C12 myogenic cells showed a reduced level of glycosylated α‐dystroglycan when the Notch signaling inhibitor DAPT or LY3039478 was added to the differentiation medium. This indicates that reducing Notch signaling can affect α‐dystroglycan glycosylation in wild‐type C2C12 myoblasts cells, which do not harbor any known mutations in α‐dystroglycan glycosyltransferases or Poglut1.
- E, F
qRT–PCR experiments show that upon DAPT or LY3039478 treatment, a remarkable decrease in Hes1 mRNA is induced in C2C12 cells during differentiation. Three replicates per condition were analyzed; mean ± SEM is shown.
References
-
- Awano H, Blaeser A, Wu B, Lu P, Keramaris‐Vrantsis E, Lu Q (2015) Dystroglycanopathy muscles lacking functional glycosylation of alpha‐dystroglycan retain regeneration capacity. Neuromuscul Disord 25: 474–484 - PubMed
-
- Barresi R, Campbell KP (2006) Dystroglycan: from biosynthesis to pathogenesis of human disease. J Cell Sci 119: 199–207 - PubMed
Publication types
MeSH terms
Substances
Grants and funding
LinkOut - more resources
Full Text Sources
Other Literature Sources
Medical
Molecular Biology Databases
Miscellaneous

