. 2016 Nov 21;215(4):559-573.
doi: 10.1083/jcb.201603107. Epub 2016 Nov 2.

DAAM1 stabilizes epithelial junctions by restraining WAVE complex-dependent lateral membrane motility

Affiliations

DAAM1 stabilizes epithelial junctions by restraining WAVE complex-dependent lateral membrane motility

Tamako Nishimura et al. J Cell Biol. .

Abstract

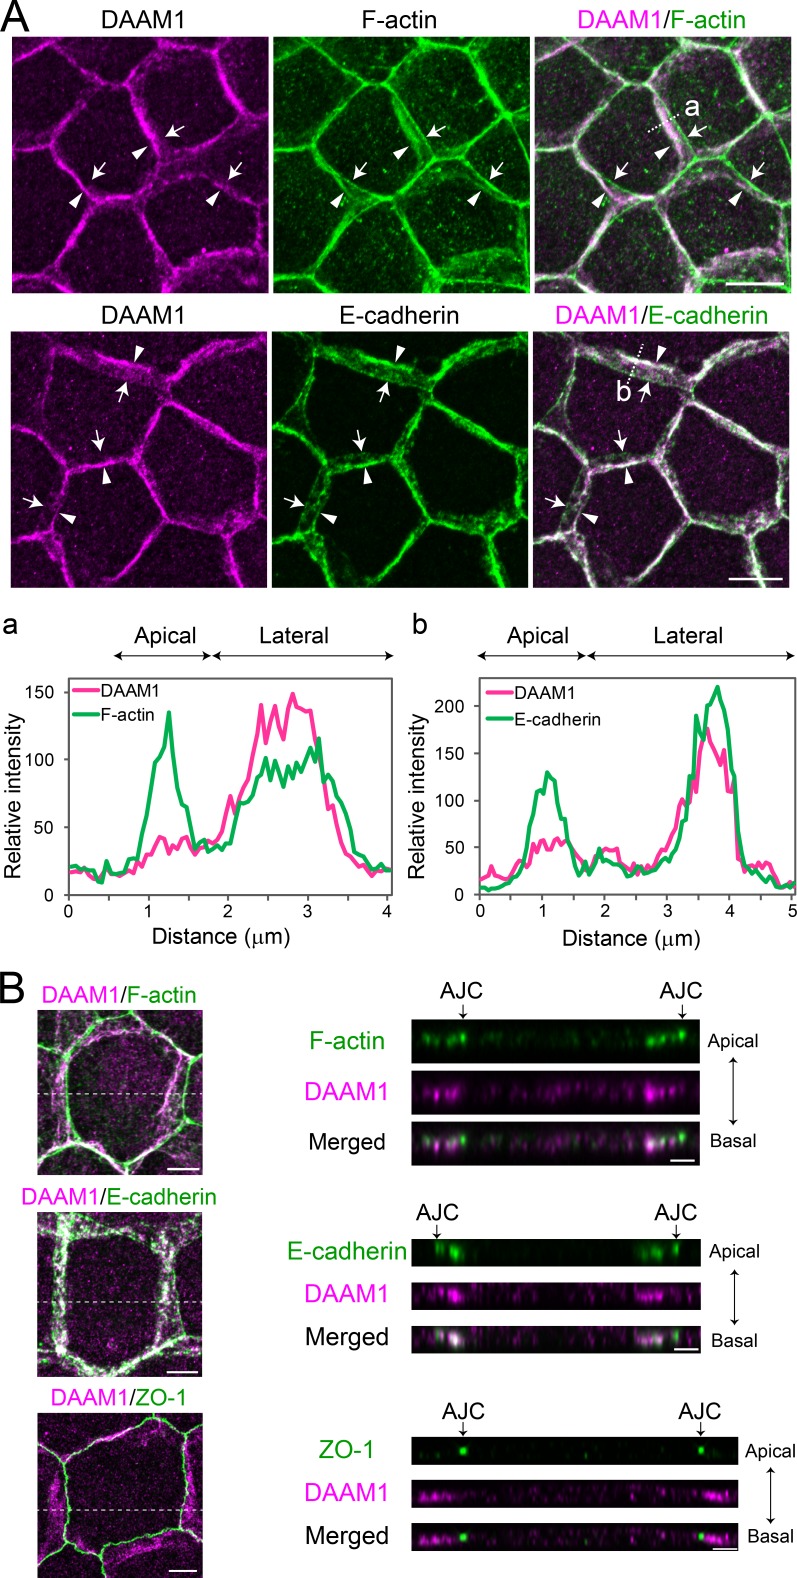
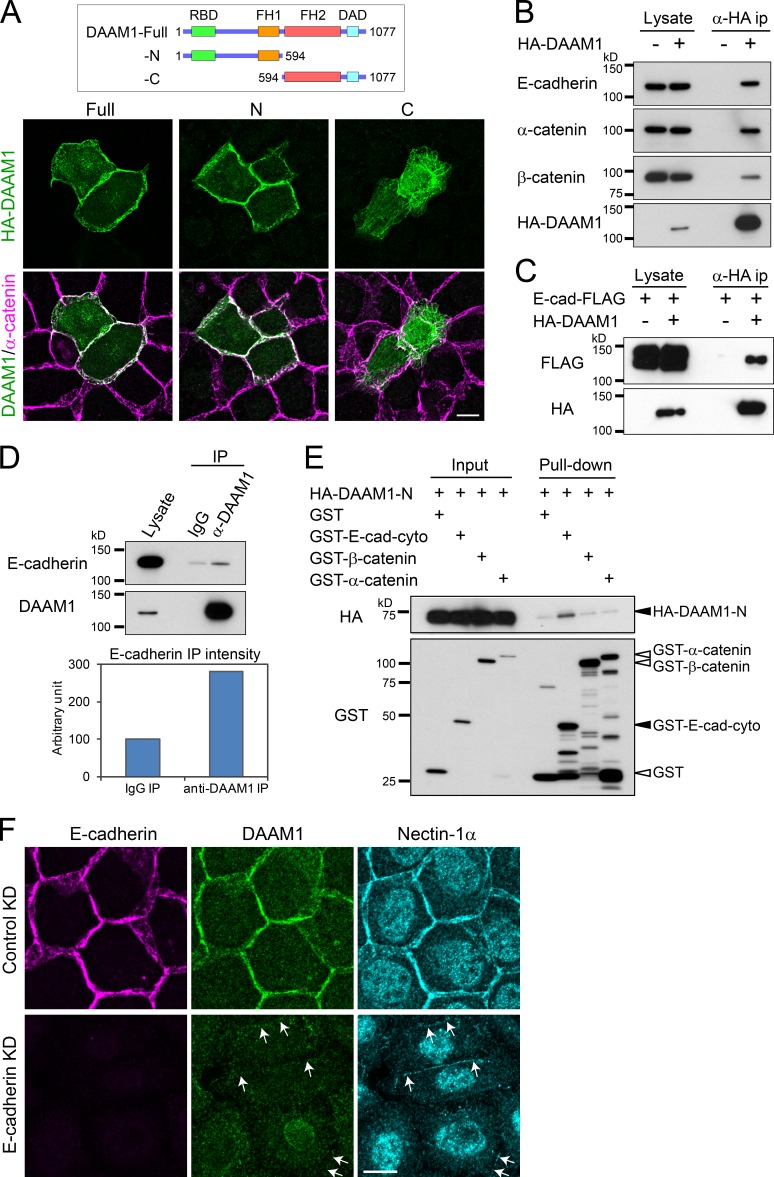
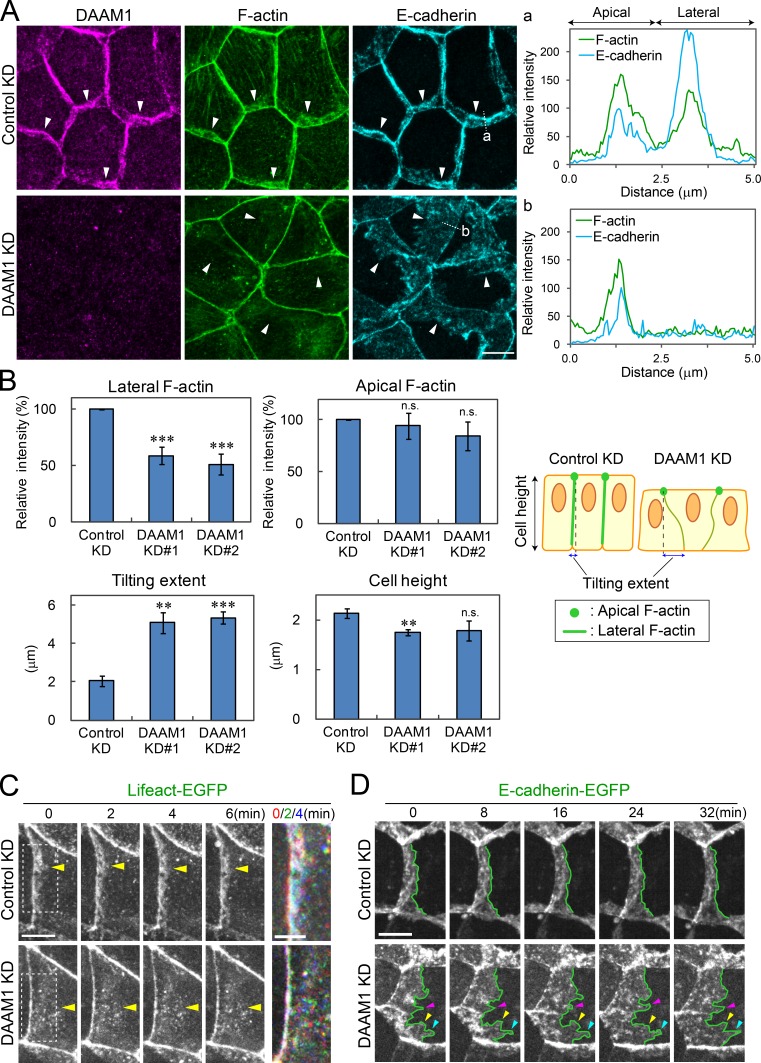
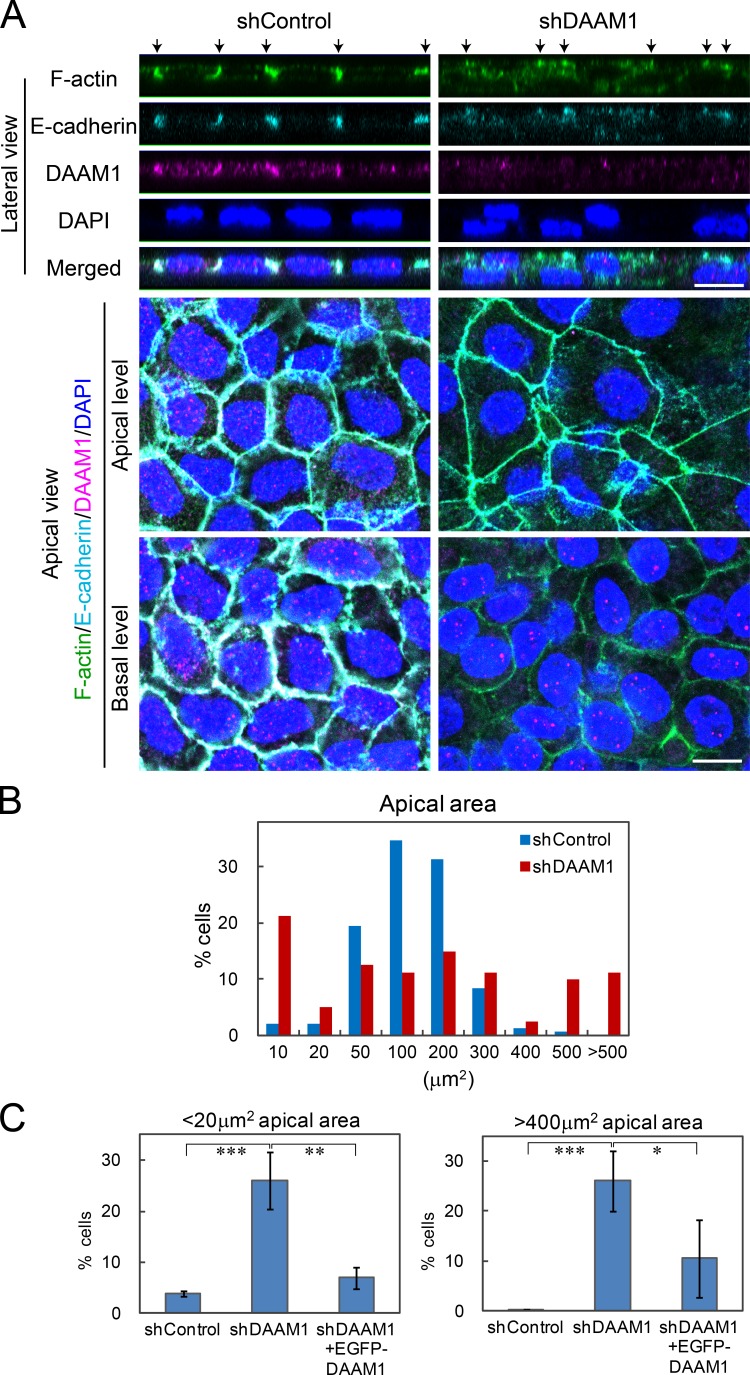
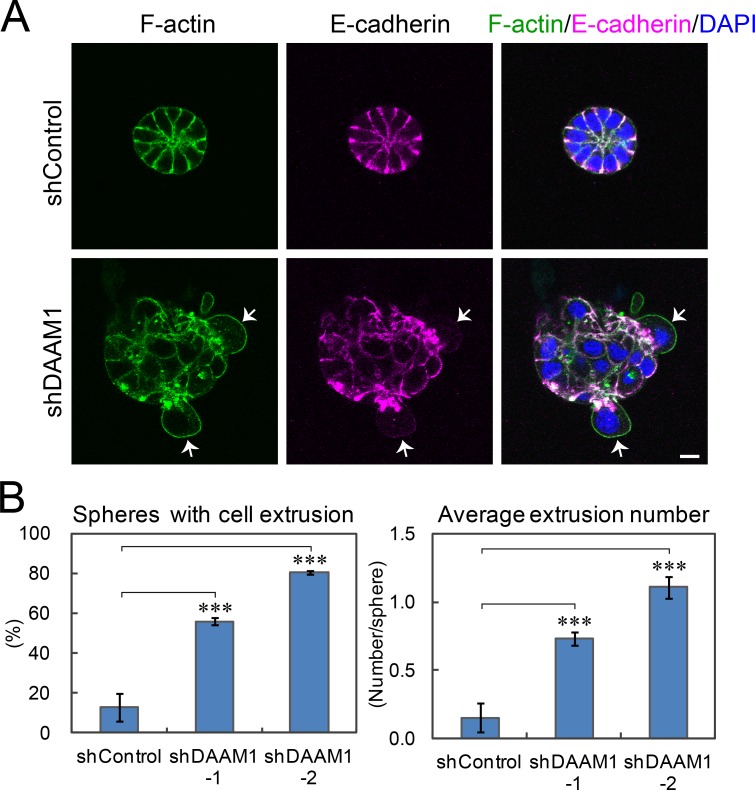
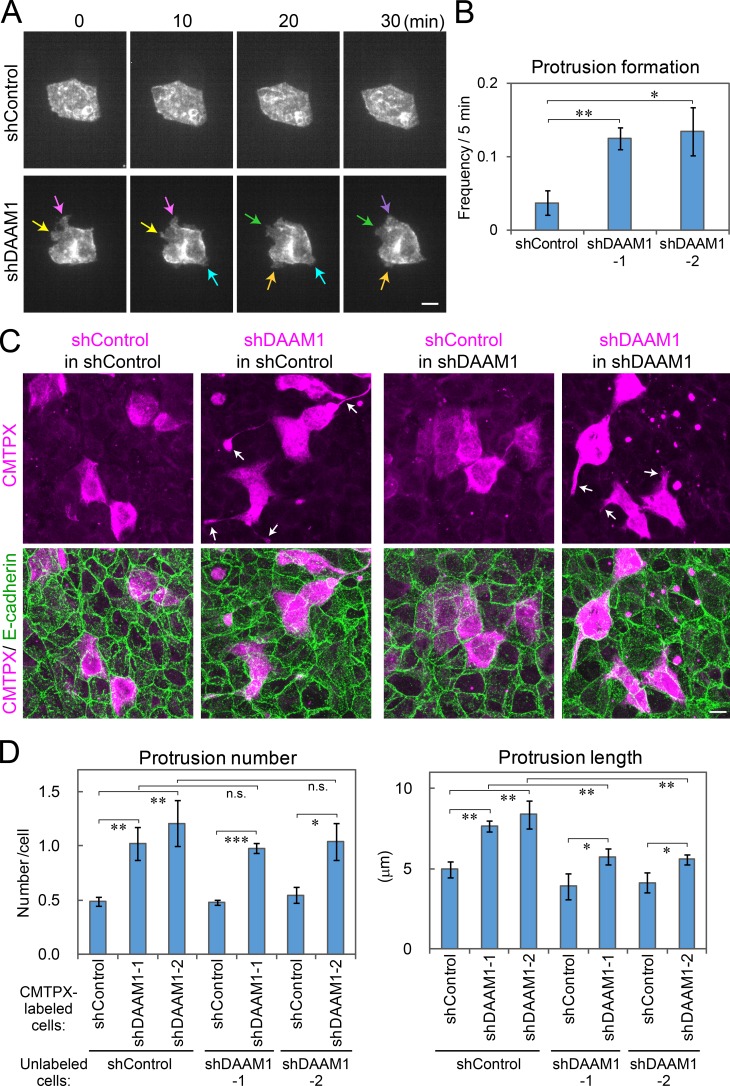
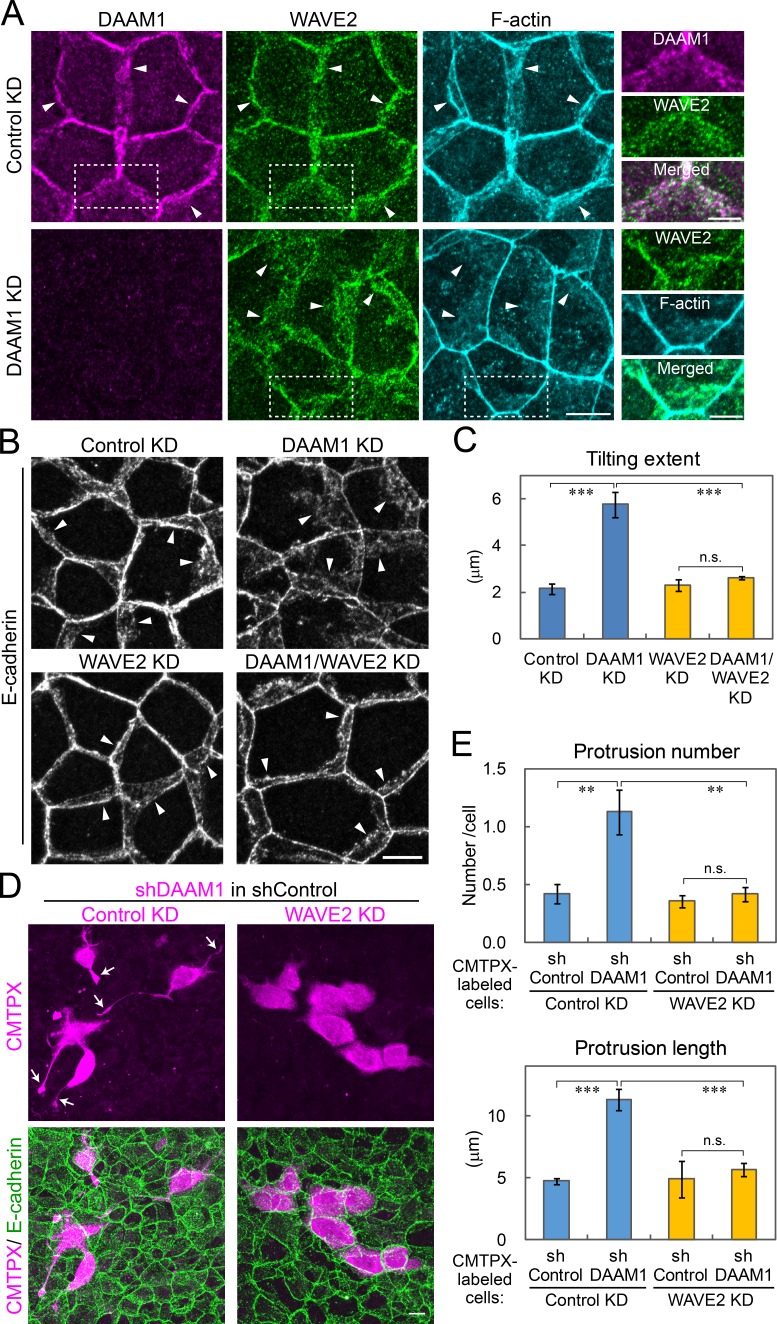
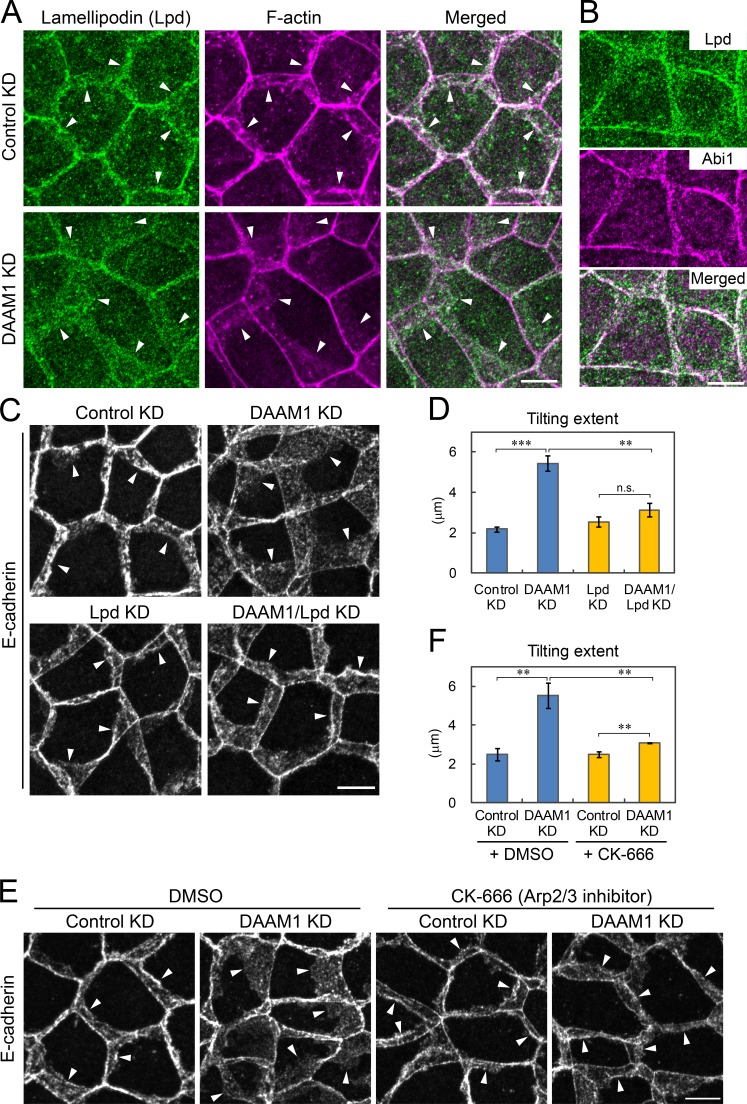
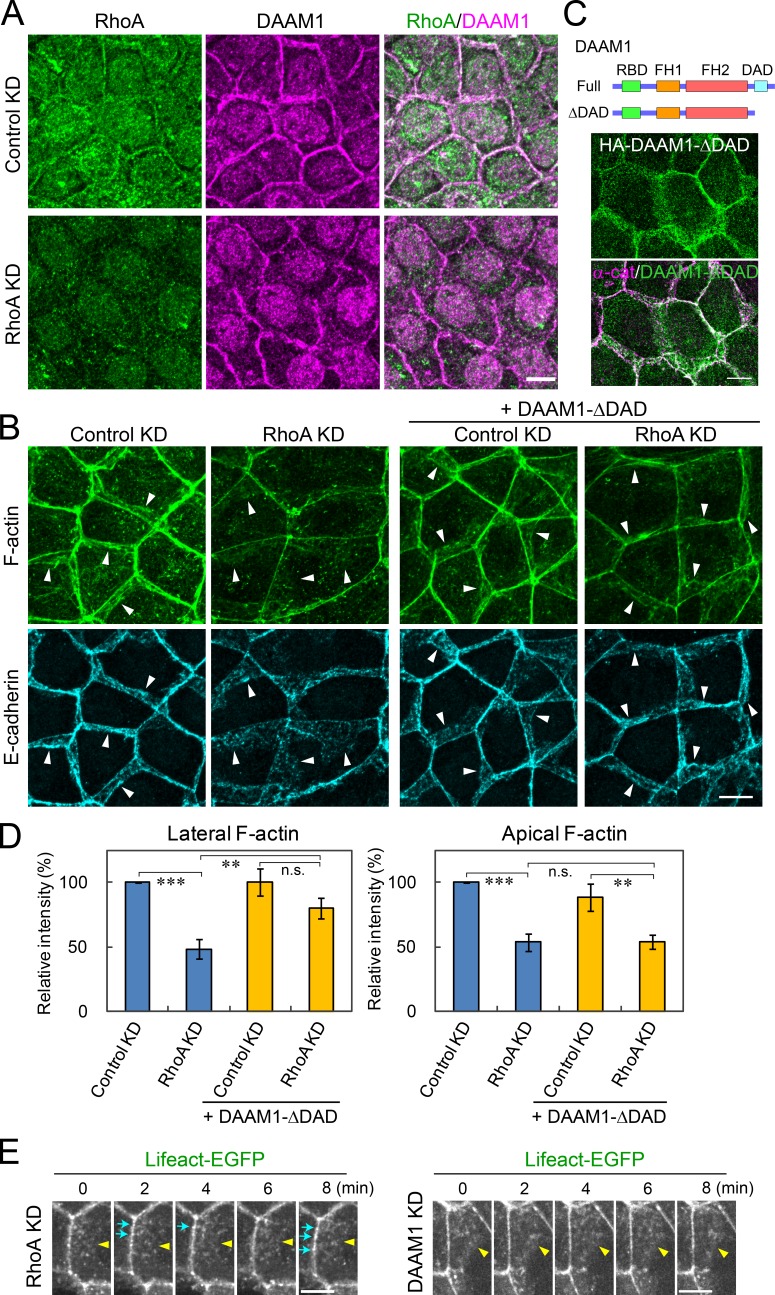
Epithelial junctions comprise two subdomains, the apical junctional complex (AJC) and the adjacent lateral membrane contacts (LCs), that span the majority of the junction. The AJC is lined with circumferential actin cables, whereas the LCs are associated with less-organized actin filaments whose roles are elusive. We found that DAAM1, a formin family actin regulator, accumulated at the LCs, and its depletion caused dispersion of actin filaments at these sites while hardly affecting circumferential actin cables. DAAM1 loss enhanced the motility of LC-forming membranes, leading to their invasion of neighboring cell layers, as well as disruption of polarized epithelial layers. We found that components of the WAVE complex and its downstream targets were required for the elevation of LC motility caused by DAAM1 loss. These findings suggest that the LC membranes are motile by nature because of the WAVE complex, but DAAM1-mediated actin regulation normally restrains this motility, thereby stabilizing epithelial architecture, and that DAAM1 loss evokes invasive abilities of epithelial cells.


Figures

Figure 1.
Figure 1.
DAAM1 localizes at the lateral contacts in EpH4 cells. (A) Cells were co-stained for DAAM1 and F-actin (top) or E-cadherin (bottom). Z-stack images are shown. Arrows and arrowheads indicate the apical and basal edge, respectively, of cell junctions. Densitometric traces along the dotted lines (a and b) are also shown. Tracing starts from the apical side. (B) Top (left) and lateral (right) views of cells immunostained for the indicated molecules. Z-stacked confocal images were subjected to super-resolution mode processing. The lateral views were taken along the dashed lines. Arrows indicate AJC positions. Bars: (A) 10 µm; (B, top view) 5 µm; (B, lateral view) 2 µm.
Figure 2.
Figure 2.
DAAM1 interacts with the CCC. (A) DAAM1 localizes at cell contacts via its N-terminal region. (Top) Schematic representation of the deletion mutants of DAAM1. (Bottom) HA-tagged full-length or deletion mutants of DAAM1 were transiently expressed in EpH4 cells and immunostained for HA and α-catenin. (B) Interaction of DAAM1 with the endogenous CCC. Lysates of HA-tagged DAAM1-expressing or parental EpH4 cells were subjected to immunoprecipitation with anti-HA antibody, followed by immunoblotting with antibodies against E-cadherin, α-catenin, β-catenin, or HA. (C) Interaction of DAAM1 with E-cadherin. HEK293T cells were transfected with FLAG-tagged E-cadherin with or without HA-tagged DAAM1. Cell lysates were subjected to immunoprecipitation using anti-HA antibody, followed by immunoblotting with antibodies against FLAG or HA. (D) Interaction between endogenous DAAM1 and E-cadherin. EpH4 cell lysates were subjected to immunoprecipitation by anti-DAAM1 antibody or normal rabbit IgG, followed by immunoblotting with anti–E-cadherin antibody. (E) Interaction of DAAM1-N with the cytoplasmic region of E-cadherin (E-cad–cyto). Lysates of EpH4 cells expressing DAAM1-N were incubated with purified GST-tagged proteins as indicated and subjected to pull-down assays. Note that only GST–E-cad–cyto specifically interacted with DAAM1-N. (F) Distribution of DAAM1 to cell junctions depends on E-cadherin. EpH4 cells were treated with an E-cadherin–specific siRNA for 2 d and then immunostained. Arrows indicate Nectin-1α–positive cell–cell contacts in E-cadherin–depleted cells. (A and F) Bars, 10 µm.
Figure 3.
Figure 3.
DAAM1 depletion causes dispersion of lateral F-actin and E-cadherin, not affecting their apical moieties. (A) EpH4 cells were transfected with DAAM1 siRNA (DAAM1 KD) or control siRNA (Control KD) for 3 d and co-stained for E-cadherin and F-actin. DAAM1 depletion caused dispersion of F-actin and E-cadherin at LCs without affecting their apical distribution. Densitometric traces were performed along the dotted lines (a and b) in an apical to basal direction. Arrowheads point to the basal edges of the junctions. (B) Quantification of apical and lateral F-actin intensity (top), as well as tilting extent of LCs and cell height (bottom), which are defined in the diagram at the right and also in Materials and methods. Histograms represent the mean of three experiments. In each experiment, 50–100 junctions were examined. Two independent DAAM1 siRNAs (KD#1 and #2) were used. Error bars indicate SD. **, P < 0.01; ***, P < 0.001; n.s., not significant. (C) Still images of Videos 1 and 2 taken for Lifeact-EGFP at the indicated intervals. On the right, the images at 0, 2, and 4 min are merged after coloring Lifeact-EGFP signals red, green, and blue, respectively. The boxed portion is enlarged for the merged images. Note that the majority of F-actin clusters change their positions every 2 min, especially in DAAM1-depleted cells. Yellow arrowheads point to the basal edges of the junctions. (D) Still images of Videos 3 and 4 taken for E-cadherin–EGFP at the indicated intervals. Note that the basal edges, outlined in green, move more dynamically in DAAM1-depleted cells than in controls. Blue, yellow, and pink arrowheads indicate the basal edge of the junction at different points. Bars: (A, C [left], and D) 10 µm; (C, right) 5 µm.
Figure 4.
Figure 4.
DAAM1 is important for epithelial integrity. (A) EpH4 cells stably expressing DAAM1-specific (shDAAM1-1 cells) or control (shControl cells) shRNA were cultured for 2 wk in Transwells and stained for the indicated molecules. (Top) Lateral views. Nuclei are mispositioned in DAAM1-depleted cells. (Bottom) Top views focused on an apical or basal focal plane. Abnormally large or small apical areas are detectable. Arrows indicate AJC positions. Bars, 10 µm. (B) Distribution of the apical area in shControl and shDAAM1 cells. Apical area was defined as the area encircled by ZO-1 immunostaining. 144 shControl and 80 shDAAM1 cells from three and four microscopic fields, respectively, were examined. (C) Rescue of the DAAM1 depletion phenotypes. shDAAM1 cells were additionally transfected with RNAi-resistant EGFP-DAAM1 plasmid and cultured for 2 wk in Transwells; the apical area variation was quantified. We examined 35–144 cells from three or four microscopic fields for each experiment. Histograms represent the mean of three experiments. Error bars indicate SD. *, P < 0.05; **, P < 0.01; ***, P < 0.001.
Figure 5.
Figure 5.
DAAM1 depletion causes extrusion of cells from spherical cysts. (A) Sphere cultures of shControl or shDAAM1 cells. Cells were cultured in Matrigel Matrix for 6 d. Control cells formed cysts with a radial cell arrangement, whereas DAAM1-depleted cells aggregated in disordered fashions with some cells being extruded from the sphere. Arrows indicate extruded cells. The results obtained using the shDAAM1-2 line are shown. Bar, 10 µm. (B) Quantification of cell extrusion from the sphere. Cells with a nucleus whose center stuck out of the sphere surface were regarded as extruded cells. Histograms represent the mean of three experiments. Error bars indicate SD. ***, P < 0.001.
Figure 6.
Figure 6.
DAAM1 depletion promotes protrusion of cell edges. (A) Live imaging of membrane-EGFP introduced into shControl or shDAAM1 cells in confluent cultures. Cells were transfected with membrane-EGFP, leaving the majority of them untransfected, and cultured for 1 d on collagen gels. Representative still images were chosen from Video 5 (for shControl) and Video 6 (for shDAAM1). The labeled cell is surrounded with nonlabeled cells. Arrows indicate representative protrusions. The results obtained using the shDAAM1-2 line are shown. (B) Quantification of the frequency of protrusion per 5 min in two independent lines of shDAAM1 cells or an shControl line. 6–21 cells were examined for each experiment. (C) Mixed cultures of shControl or shDAAM1 cells. Cells were labeled with CMTPX and mixed with nonlabeled cells to culture on collagen gels for 2 d. shDAAM1 cells form longer and more protrusions than shControl cells, especially when mixed with control cells. Arrows indicate representative protrusions. The results obtained using the shDAAM1-2 line are shown. (A and C) Bars, 10 µm. (D) Quantification of protrusion number and length in CMTPX-labeled cells as indicated in Materials and methods. (B and D) Histograms represent the mean of three experiments. Error bars indicate SD. *, P < 0.05; **, P < 0.01; ***, P < 0.001; n.s., not significant.
Figure 7.
Figure 7.
WAVE2 is required for lateral membrane motility. (A) Co-staining for DAAM1, WAVE2, and F-actin in EpH4 cells treated with control or DAAM1 siRNA. Enlarged views of the boxed regions are shown at the right. DAAM1 and WAVE2 showed distinct distributions, and WAVE2 overlapped with F-actin. (B) Immunostaining for E-cadherin in EpH4 cells treated with DAAM1 and/or WAVE2 siRNAs. WAVE2 KD tended to cause the sharpening of E-cadherin signals at the basal edges of LCs in both control and DAAM1-depleted cells. (A and B) Arrowheads point to the basal edges of the junctions. (C) Quantification of the tilting extent of LCs. (D) DAAM1-depleted cells were treated with control or WAVE2 siRNAs for 1 d and then labeled with CMTPX. After mixing them with nonlabeled shControl cells, they were cultured on collagen gels for 2 d. Protrusion in DAAM1-depleted cells was suppressed by WAVE2 KD. Arrows indicate representative protrusions. Bars: (A [left], B, and D) 10 µm; (A, right) 5 µm. (E) Quantification of protrusion number and length in the experiment shown in D. (C and E) Histograms represent the mean of three experiments. Error bars indicate SD. **, P < 0.01; ***, P < 0.001; n.s., not significant.
Figure 8.
Figure 8.
Lamellipodin and Arp2/3 are involved in lateral membrane motility. (A) Co-staining for lamellipodin (Lpd) and F-actin in EpH4 cells treated with control or DAAM1 siRNA. Lpd overlapped with F-actin at LCs. (B) Co-staining for Lpd and Abi1. (C) Immunostaining for E-cadherin in EpH4 cells treated with DAAM1 and/or Lpd siRNAs. Depletion of Lpd suppressed the diffused distribution of E-cadherin induced by DAAM1 KD. (D) Quantification of the tilting extent in C. (E) Immunostaining for E-cadherin in control or DAAM1-depleted EpH4 cells treated with 150 µM of the Arp2/3 inhibitor CK-666 in DMSO or DMSO only (0.15% in final concentration) for 30 min. Diffused distribution of E-cadherin induced by DAAM1 KD was partially suppressed. (A–C and E) Arrowheads point to the basal edges of the junctions. Bars, 10 µm. (F) Quantification of the tilting extent in E. (D and F) Histograms represent the mean of three experiments. Error bars indicate SD. **, P < 0.01; ***, P < 0.001; n.s., not significant.
Figure 9.
Figure 9.
RhoA regulates cell junctions upstream of DAAM1. (A) Co-immunostaining for RhoA and DAAM1 in EpH4 cells treated with control or RhoA siRNA. Nuclear signals are caused by nonspecific reaction of the primary antibodies. (B) Effects of RhoA depletion and DAAM1-ΔDAD (shown in C) expression on junctional integrity. EpH4 cells or EpH4 cells stably expressing DAAM1-ΔDAD were treated with control or RhoA-specific siRNAs and co-stained for F-actin or E-cadherin. RhoA KD down-regulated not only the lateral but also apical F-actin, and DAAM1-ΔDAD expression restored a nearly normal level of lateral F-actin but not that of apical F-actin in Rho-depleted cells. Arrowheads point to the basal edges of the junctions. (C) The constitutively active DAAM1 mutant DAAM1-ΔDAD. (Top) Schematic representation of the mutant construct. (Bottom) Distribution of HA-tagged DAAM1-ΔDAD in EpH4 cells. α-cat, α-catenin. (D) Quantification of lateral and apical F-actin intensity in the experiments shown in B. Histograms represent the mean of three experiments. Error bars indicate SD. **, P < 0.01; ***, P < 0.001; n.s., not significant. (E) Still images of Video 9, in which Lifeact-EGFP–expressing cells were transfected with RhoA siRNA (left). The distribution of Lifeact-EGFP signals at the AJC changed dynamically. Blue arrows indicate examples of Lifeact-EGFP clusters that were only transiently detectable. Yellow arrowheads point to the basal edges of the junctions. For comparison, still images of Video 2, in which Lifeact-EGFP–expressing cells were transfected with DAAM1 siRNA, are also shown (right). Lifeact-EGFP signals were more stable in DAAM1-depleted than in RhoA-depleted cells at the AJC. (A–C and E) Bars, 10 µm.

Similar articles

Cited by

References

    1. Amano M., Mukai H., Ono Y., Chihara K., Matsui T., Hamajima Y., Okawa K., Iwamatsu A., and Kaibuchi K.. 1996. Identification of a putative target for Rho as the serine-threonine kinase protein kinase N. Science. 271:648–650. 10.1126/science.271.5249.648 - DOI - PubMed
    1. Ang S.F., Zhao Z.S., Lim L., and Manser E.. 2010. DAAM1 is a formin required for centrosome re-orientation during cell migration. PLoS One. 5:e13064 10.1371/journal.pone.0013064 - DOI - PMC - PubMed
    1. Carmona G., Perera U., Gillett C., Naba A., Law A.L., Sharma V.P., Wang J., Wyckoff J., Balsamo M., Mosis F., et al. . 2016. Lamellipodin promotes invasive 3D cancer cell migration via regulated interactions with Ena/VASP and SCAR/WAVE. Oncogene. 35:5155–5169. 10.1038/onc.2016.47 - DOI - PMC - PubMed
    1. Carramusa L., Ballestrem C., Zilberman Y., and Bershadsky A.D.. 2007. Mammalian diaphanous-related formin Dia1 controls the organization of E-cadherin-mediated cell-cell junctions. J. Cell Sci. 120:3870–3882. 10.1242/jcs.014365 - DOI - PubMed
    1. Chesarone M.A., DuPage A.G., and Goode B.L.. 2010. Unleashing formins to remodel the actin and microtubule cytoskeletons. Nat. Rev. Mol. Cell Biol. 11:62–74. 10.1038/nrm2816 - DOI - PubMed

LinkOut - more resources