. 2016 Nov 15;113(46):13098-13103.
doi: 10.1073/pnas.1604088113. Epub 2016 Nov 2.

The correlations and sequence of plant stomatal, hydraulic, and wilting responses to drought

Affiliations

The correlations and sequence of plant stomatal, hydraulic, and wilting responses to drought

Megan K Bartlett et al. Proc Natl Acad Sci U S A. .

Abstract

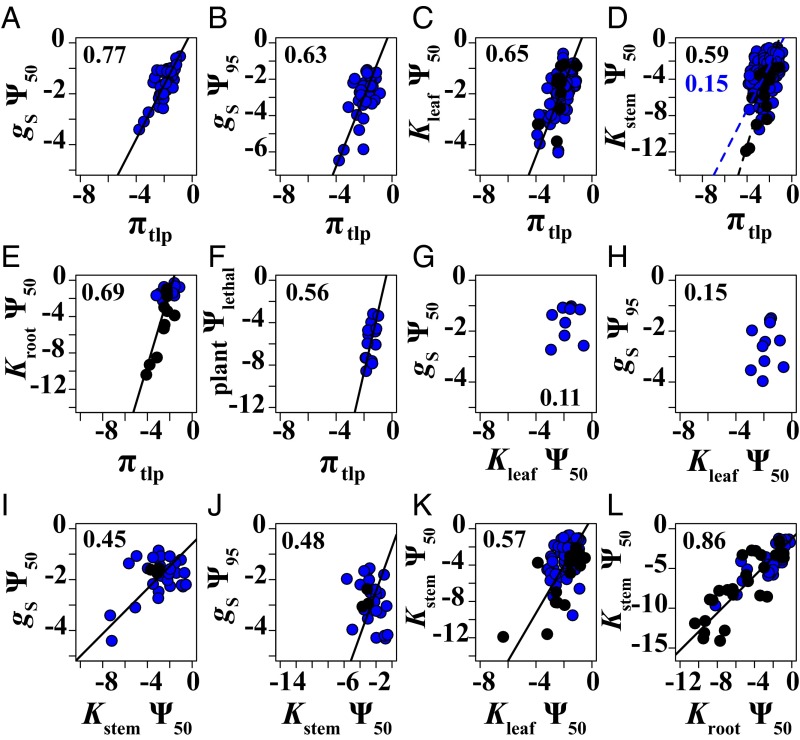
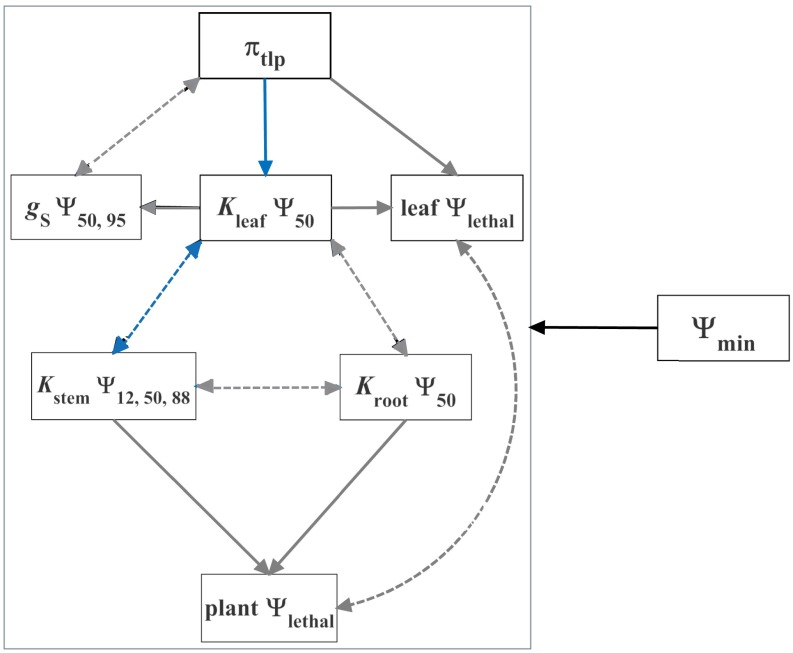
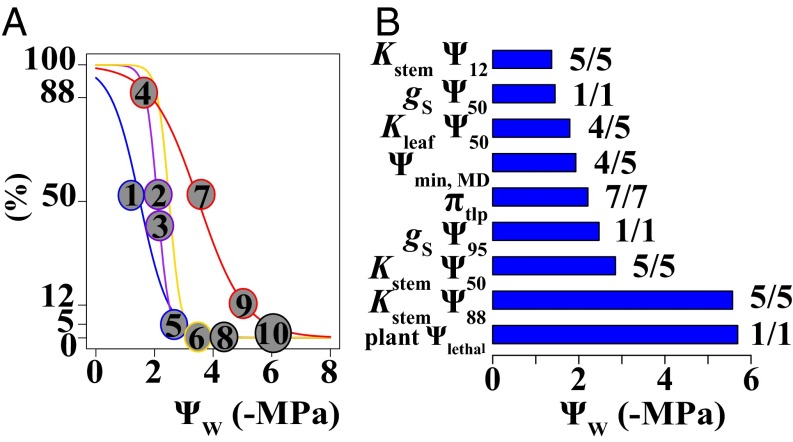
Climate change is expected to exacerbate drought for many plants, making drought tolerance a key driver of species and ecosystem responses. Plant drought tolerance is determined by multiple traits, but the relationships among traits, either within individual plants or across species, have not been evaluated for general patterns across plant diversity. We synthesized the published data for stomatal closure, wilting, declines in hydraulic conductivity in the leaves, stems, and roots, and plant mortality for 262 woody angiosperm and 48 gymnosperm species. We evaluated the correlations among the drought tolerance traits across species, and the general sequence of water potential thresholds for these traits within individual plants. The trait correlations across species provide a framework for predicting plant responses to a wide range of water stress from one or two sampled traits, increasing the ability to rapidly characterize drought tolerance across diverse species. Analyzing these correlations also identified correlations among the leaf and stem hydraulic traits and the wilting point, or turgor loss point, beyond those expected from shared ancestry or independent associations with water stress alone. Further, on average, the angiosperm species generally exhibited a sequence of drought tolerance traits that is expected to limit severe tissue damage during drought, such as wilting and substantial stem embolism. This synthesis of the relationships among the drought tolerance traits provides crucial, empirically supported insight into representing variation in multiple traits in models of plant and ecosystem responses to drought.

Keywords: drought tolerance; leaf hydraulics; stem hydraulics; stomatal closure; turgor loss point.


Conflict of interest statement

The authors declare no conflict of interest.

Figures

Fig. 1.
Fig. 1.
Correlations among drought tolerance traits across species. Symbols follow Table 1. Blue points represent angiosperms, and black points represent gymnosperms. Solid black lines are standard major axis relationships that are significant across all species. Dashed lines are correlations that are significantly different between the gymnosperms (black lines) and angiosperms (blue lines). All significant correlations remained significant after correcting for multiple tests (46). The r values are shown on each graph, and P values and sample sizes are in SI Appendix, Table S2. All of the traits were significantly correlated (A–F and I–L), except for Kleaf Ψ50 and gS Ψ50 (G) and gS Ψ95 (H). For graphical clarity, correlations with Kstem Ψ12 and Ψ88 are not shown. All of the stem hydraulic traits showed the same correlations, except that Kstem Ψ12 was not significantly correlated with gS Ψ50 and Kleaf Ψ50 was not significantly correlated with Kstem Ψ88 (SI Appendix, Table S2). Kstem Ψ12 was significantly correlated with Kleaf Ψ50 in the gymnosperms but not the angiosperms, whereas the two functional types showed significantly different slopes for the correlations of Kstem Ψ50 with πtlp (D) and with Kstem Ψ12 (SI Appendix, Table S4). We did not compile variation in plant Ψlethal from the literature, because most published studies use different definitions for plant death, but instead show this correlation from the largest study of these traits (11) for comparison with the other correlations with πtlp (F).
Fig. 2.
Fig. 2.
Testing hypotheses for the drivers of the correlations among the drought tolerance traits. Most of the trait correlations are predicted to be driven by concerted convergence, wherein the selective pressure of water stress (Ψmin, MD or Ψmin, PD) acts independently on each trait to optimize overall plant function during drought (10, 17, 28). These hypotheses are indicated with dashed lines. Additionally, πtlp was hypothesized to influence Kleaf Ψ50 mechanistically (20). Kleaf Ψ50, in turn, would influence gS Ψ50 and Ψ95 and the threshold Ψleaf for leaf death (leaf Ψlethal) (30, 31), and the stem and root hydraulic traits would influence the plant mortality threshold (plant Ψlethal) (19). These hypotheses are indicated with solid lines. As predicted, πtlp and Kleaf Ψ50 were more correlated than expected from water stress and relatedness alone. Functionally coordinated traits are indicated with blue lines. Other correlations were best explained by the independent relationship of each trait with water stress. Concerted convergence is indicated with black lines. Conversely, Kstem Ψ50 was also more strongly correlated with Kleaf Ψ50 and, when characterizing water stress with Ψmin, MD, with πtlp than expected from concerted convergence, consistent with strong functional coordination within the hydraulic system across organs (SI Appendix, Tables S5 and S6). The remaining hypotheses had insufficient data to test (indicated with gray lines).
Fig. 3.
Fig. 3.
The hypothesized (A) and observed (B) sequence of water potential values for the drought tolerance traits within individual plants. A shows the relationship between organ water potential (ΨW) and the percent decline in stomatal conductance (gS, blue), hydraulic conductivity in the leaves, roots and stems (Kleaf and Kroot, purple; Kstem, red), and turgor pressure (ΨP, yellow). The numbered circles show the order in which given declines in function will occur if plants generally follow a trait sequence that is expected to limit tissue damage during drought. In this sequence, 50% declines in stomatal conductance (gS Ψ50, #1) are expected to occur at the least negative water potentials to slow transpiration (37), followed by moderate (50%) declines in Kleaf and Kroot (Kleaf and Kroot Ψ50) and minor (12%) declines in Kstem (Kstem Ψ12), if leaf and root dysfunction protects the stem from embolism, as predicted by vulnerability segmentation (17). (These traits are labeled #2–4 but shown in the same position, because their order is not hypothesized). Stomatal closure, or gS Ψ95 (#5), would occur before potentially major damage, including loss of turgor pressure in the leaf cells, or wilting (πtlp, #6), and 50% declines in Kstem (Kstem Ψ50, #7) (6, 10). Kstem Ψ50 is hypothesized to limit the water stress that plants tolerate, and thus, we expected the most negative Ψleaf values plants reach under natural growing conditions (Ψmin, MD, #8) to be near Kstem Ψ50 (4). Eighty-eight percent declines in Kstem (Kstem Ψ88, #9) have been hypothesized to induce irreversible xylem damage and, thus, to occur somewhat before plant death (plant Ψlethal, #10) (19), which we estimated as the Ψleaf at which all leaves showed tissue damage (11). The sequence is determined from pairwise comparisons between all of the traits (SI Appendix, Table S7), but, for clarity, B shows the mean of each trait from its pairwise comparison with the trait immediately after (i.e., more negative than) it in the sequence. The traits generally followed this sequence, with the order of Kstem Ψ12 > Kleaf Ψ50 & Ψmin, MD > πtlp > Kstem Ψ50 > Kstem Ψ88 supporting the hypothesized sequence, with the exception that Kleaf Ψ50 and Ψmin, MD were not significantly different. πtlp occurred after gS Ψ50, as hypothesized, but before gS Ψ95, contrary to prediction. There were insufficient data to test Kroot Ψ50, or to compare the stomatal traits to any other trait. For each trait, the number to the left is the number of other traits it was significantly different from, and the number to the right is the total number of trait comparisons with sufficient data to test. Notably, the sequence is shown with respect to organ-specific water potentials; in the transpiring plant, the high resistance of the hydraulic pathway produces a gradient of increasingly negative water potentials from the root to the leaf. Thus, the stem may undergo less embolism than suggested by this sequence.

References

    1. Sheffield J, Wood EF. Characteristics of global and regional drought, 1950–2000: Analysis of soil moisture data from off-line simulation of the terrestrial hydrologic cycle. J Geophys Res. 2007;112(D17):115.
    1. Anderegg WR, et al. Meta-analysis reveals that hydraulic traits explain cross-species patterns of drought-induced tree mortality across the globe. Proc Natl Acad Sci USA. 2016;113(18):5024–5029. - PMC - PubMed
    1. Maherali H, Pockman WT, Jackson RB. Adaptive variation in the vulnerability of woody plants to xylem cavitation. Ecology. 2004;85(8):2184–2199.
    1. Choat B, et al. Global convergence in the vulnerability of forests to drought. Nature. 2012;491(7426):752–755. - PubMed
    1. Blackman CJ, Brodribb TJ, Jordan GJ. Leaf hydraulic vulnerability influences species’ bioclimatic limits in a diverse group of woody angiosperms. Oecologia. 2012;168(1):1–10. - PubMed

Publication types