Review
. 2017 Jan;97(1):89-134.
doi: 10.1152/physrev.00008.2016.

Molecular Pathophysiology of Congenital Long QT Syndrome

Affiliations
Review

Molecular Pathophysiology of Congenital Long QT Syndrome

M S Bohnen et al. Physiol Rev. 2017 Jan.

Abstract

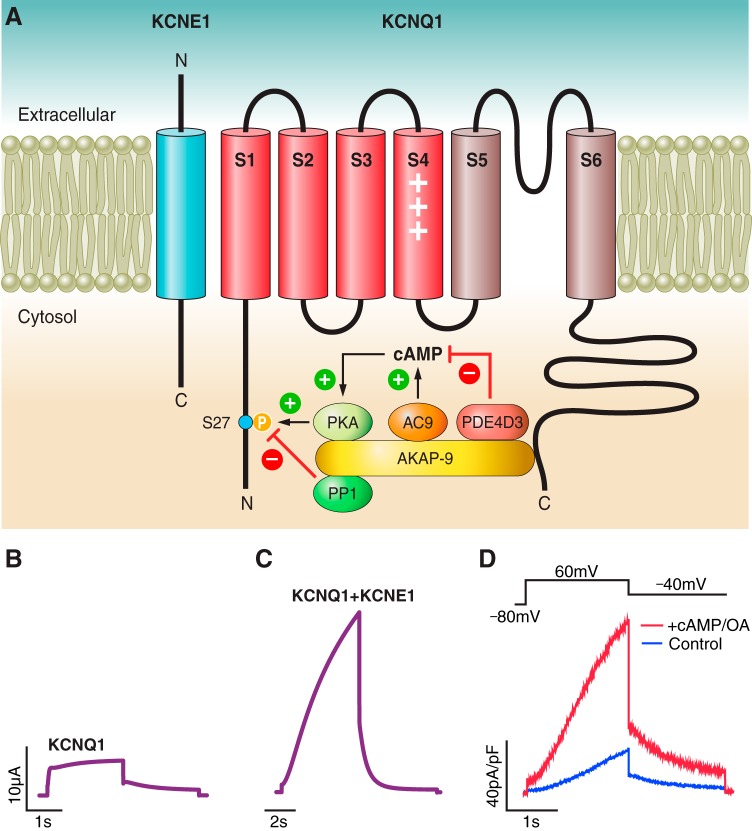
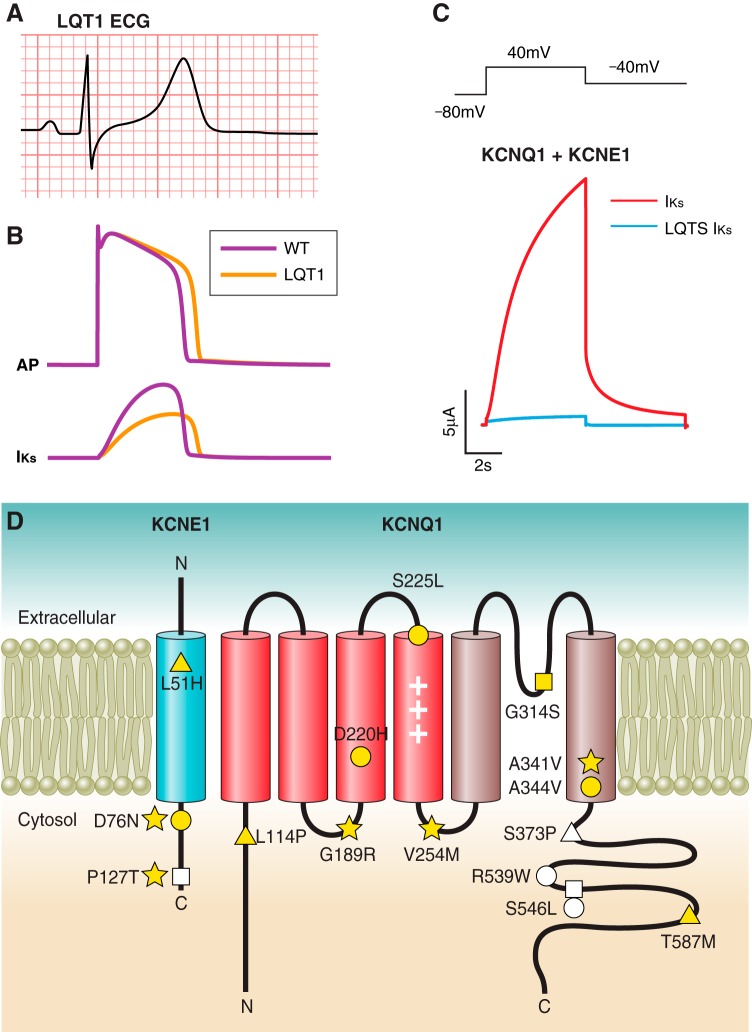
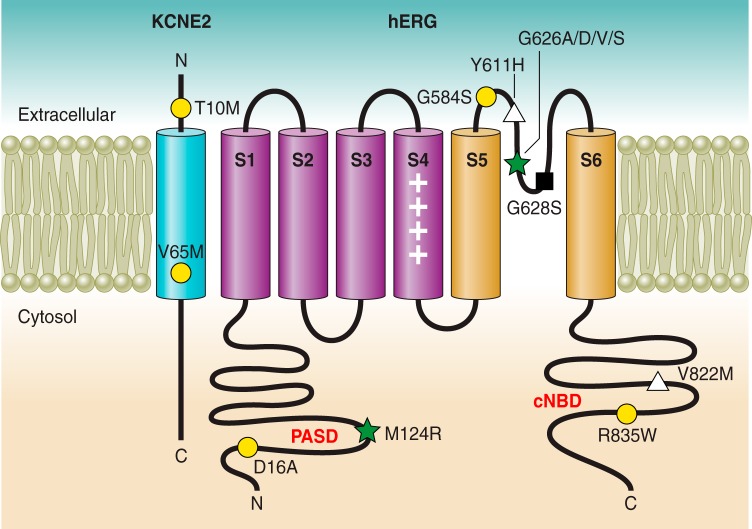
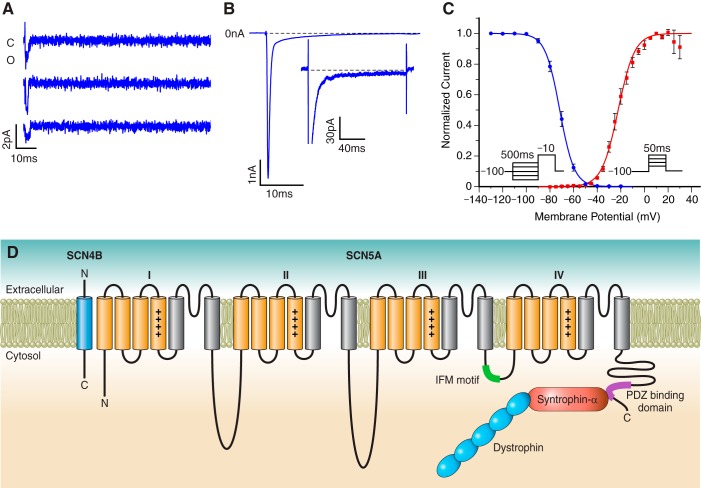
Ion channels represent the molecular entities that give rise to the cardiac action potential, the fundamental cellular electrical event in the heart. The concerted function of these channels leads to normal cyclical excitation and resultant contraction of cardiac muscle. Research into cardiac ion channel regulation and mutations that underlie disease pathogenesis has greatly enhanced our knowledge of the causes and clinical management of cardiac arrhythmia. Here we review the molecular determinants, pathogenesis, and pharmacology of congenital Long QT Syndrome. We examine mechanisms of dysfunction associated with three critical cardiac currents that comprise the majority of congenital Long QT Syndrome cases: 1) IKs, the slow delayed rectifier current; 2) IKr, the rapid delayed rectifier current; and 3) INa, the voltage-dependent sodium current. Less common subtypes of congenital Long QT Syndrome affect other cardiac ionic currents that contribute to the dynamic nature of cardiac electrophysiology. Through the study of mutations that cause congenital Long QT Syndrome, the scientific community has advanced understanding of ion channel structure-function relationships, physiology, and pharmacological response to clinically employed and experimental pharmacological agents. Our understanding of congenital Long QT Syndrome continues to evolve rapidly and with great benefits: genotype-driven clinical management of the disease has improved patient care as precision medicine becomes even more a reality.


Figures

FIGURE 1.
FIGURE 1.
ECG to cellular ionic currents. A: membrane depolarization and the rapid upstroke of the ventricular action potential give rise to the QRS complex. The duration of the QT-interval corresponds to the time to ventricular repolarization. The relatively stable membrane potential during the plateau phase of the action potential gives rise to a brief isoelectric period. Ventricular repolarization gives rise to the T-wave. B: time course of several ionic currents that underlie ventricular action potential morphology (currents not to scale). The rapidly activating and inactivating INa drives membrane depolarization. Two K+ currents, IKs and IKr, contribute most to the repolarizing current necessary to drive membrane potential back to rest.
FIGURE 2.
FIGURE 2.
Schematic of a generic K+ and Na+ ion channel. Ion channels allow for selective permeation of ions through the plasma membrane down their electrochemical gradient. The classic K+ channel consists of four identical pore-forming subunits, whereas each Na+ channel is formed by a single polypeptide with four homologous domains.
FIGURE 3.
FIGURE 3.
Molecular biology of IKs and regulation by PKA-mediated signaling. A: the IKs macromolecular complex, including KCNQ1, KCNE1, and associated scaffolding and signaling proteins. B and C: single pulse voltage-clamp recordings of KCNQ1 expressed alone or coexpressed with KCNE1 in Xenopus oocytes. D: dialysis with 200 μM cAMP and 0.2 μM okadaic acid (OA) increases IKs amplitude and slows deactivation when heterologously expressed in CHO cells. [From Chen et al. (78).]
FIGURE 4.
FIGURE 4.
IKs dysfunction leading to congenital LQTS. A: ECG from a LQT1 patient demonstrates a characteristic broad-based T wave (unpublished data). B: simulated action potential (top) and IKs (bottom) in WT (black) and heterozygous LQT1 (gray) conditions, demonstrating the effect of 50% reduction in IKs. C: single pulse voltage-clamp IKs recording in Xenopus oocytes demonstrating loss of channel function in an IKs-associated LQTS mutation. D: topology of KCNQ1 and KCNE1 in the plasma membrane. Several examples of LQT1- and LQT5-associated mutations are highlighted in blue and teal, respectively. These mutations represent a variety of mechanisms of loss-of-function including disruption of permeation (yellow-filled square), gating (yellow-filled circle), trafficking (yellow-filled triangle), PKA-mediated signaling (yellow-filled star), KCNQ1-KCNE1 interaction (white-filled square), PIP2 affinity (white-filled circle), and calmodulin affinity (white-filled triangle).
FIGURE 5.
FIGURE 5.
hERG structure and electrophysiology. A: schematic of the IKr channel complex. Four hERG1 subunits tetramerize to comprise the pore-forming alpha subunit of IKr. hERG1 contains a voltage-sensing domain (purple), including the S4 helix which contains positively charged gating residues, and a pore domain (gray). KCNE2, an accessory subunit of the IKr channel complex, consists of a single transmembrane helix (blue). B: voltage-clamp protocol (top panel) and heterologously expressed hERG1 ionic currents (bottom panel) recorded from a Xenopus oocyte. Currents were recorded at potentials that ranged from −70 to +50 mV; deactivating (“tail”) currents were measured at −70 mV. C: current-voltage (I-V) relationship for hERG1 currents measured at the end of test pulses, as indicated by red circle in B. D: voltage dependence of hERG1 current activation. The peak of tail currents measured at −70 mV (indicated by blue square in B) were normalized to the largest value and plotted as a function of the test potential. E: voltage dependence of hERG1 inactivation. Channel availability is decreased at positive potentials, resulting in a decreased magnitude of peak outward currents and the bell-shaped I-V relationship depicted in C. [B–E from Sanguinetti (356), with permission of Springer.]
FIGURE 6.
FIGURE 6.
IKr dysfunction leading to congenital LQTS. A: ECG from a LQT2 patient demonstrates a characteristic “notched,” or bifid, T wave with QTc prolongation (unpublished data). B: simulated action potential (top) and IKr (bottom) in WT (black) and heterozygous LQT2 (gray) conditions, demonstrating the effect of 50% reduction in IKr.
FIGURE 7.
FIGURE 7.
Topology of hERG and KCNE1 in the plasma membrane, representative LQT2- and LQT6-associated mutations highlighted. Different mechanisms of loss of function in hERG or KCNE2, including gating (yellow-filled circle), K+ permeation (black-filled square), trafficking (white-filled triangle), or combined defects (green-filled star) are categorized.
FIGURE 8.
FIGURE 8.
Physiology and molecular biology of INa. A: consecutive recordings of single Na+ channels recorded under cell-attached conditions in HEK293 cells transfected with Nav1.5 cDNA (unpublished data). B: WT Na+ currents recorded under whole cell patch-clamp conditions and obtained by depolarizations from −120 to −30 mV (unpublished data). At high gain (inset), whole cell currents return nearly to 0 nA. C: voltage dependence of activation (red-filled square) and inactivation (blue-filled circle) (unpublished data). D: topology of Nav1.5 in the plasma membrane with accessory proteins implicated in LQTS.
FIGURE 9.
FIGURE 9.
INa dysfunction leading to congenital LQTS. A: topology of Nav1.5 in the plasma membrane. Several representative LQT3-associated mutations were selected because there is strong evidence that they induce INaL by channel bursting (red-filled triangle) or by late reopening (red-filled circle), or prolong the action potential without INaL (red-filled square). B: ECG from a LQT3 patient (unpublished data). C: simulated action potential (top) and INa (bottom) in WT (green) and heterozygous LQT3 (purple) conditions. INa peak current was truncated to enhance view of INaL. D: representative current recordings from WT (purple) and F1473C (orange) Nav1.5 expressed in HEK293 cells at low and high gain (inset) elicited by depolarization to −10 mV (35). E: steady-state channel availability for WT (green triangle) and F1473C (purple square). [D and E from Bankston et al. (35).]
FIGURE 10.
FIGURE 10.
Representative recordings at low and high (insets) gain of F1473C inhibition by 50 μM mexiletine (A), 50 μM ranolazine (B), and 10 μM flecainide (C). D: mexiletine, ranolazine, and flecainide inhibit INa with preference for INaL. [From Bankston et al. (35).]

References

    1. Abbott GW. Biology of the KCNQ1 potassium channel. New J Sci 2014: 1–26, 2014.
    1. Abbott GW, Sesti F, Splawski I, Buck ME, Lehmann MH, Timothy KW, Keating MT, Goldstein SA. MiRP1 forms IKr potassium channels with HERG and is associated with cardiac arrhythmia. Cell 97: 175–187, 1999. - PubMed
    1. Abbott GW, Xu X, Roepke TK. Impact of ancillary subunits on ventricular repolarization. J Electrocardiol 40: S42–46, 2007. - PMC - PubMed
    1. Abi-Gerges N, Small BG, Lawrence CL, Hammond TG, Valentin JP, Pollard CE. Evidence for gender differences in electrophysiological properties of canine Purkinje fibres. Br J Pharmacol 142: 1255–1264, 2004. - PMC - PubMed
    1. Abitbol I, Peretz A, Lerche C, Busch AE, Attali B. Stilbenes and fenamates rescue the loss of I(KS) channel function induced by an LQT5 mutation and other IsK mutants. EMBO J 18: 4137–4148, 1999. - PMC - PubMed

Publication types