Review
. 2017 Jan;97(1):135-187.
doi: 10.1152/physrev.00033.2015.

Estrogens and Androgens in Skeletal Physiology and Pathophysiology

Affiliations
Review

Estrogens and Androgens in Skeletal Physiology and Pathophysiology

Maria Almeida et al. Physiol Rev. 2017 Jan.

Abstract

Estrogens and androgens influence the growth and maintenance of the mammalian skeleton and are responsible for its sexual dimorphism. Estrogen deficiency at menopause or loss of both estrogens and androgens in elderly men contribute to the development of osteoporosis, one of the most common and impactful metabolic diseases of old age. In the last 20 years, basic and clinical research advances, genetic insights from humans and rodents, and newer imaging technologies have changed considerably the landscape of our understanding of bone biology as well as the relationship between sex steroids and the physiology and pathophysiology of bone metabolism. Together with the appreciation of the side effects of estrogen-related therapies on breast cancer and cardiovascular diseases, these advances have also drastically altered the treatment of osteoporosis. In this article, we provide a comprehensive review of the molecular and cellular mechanisms of action of estrogens and androgens on bone, their influences on skeletal homeostasis during growth and adulthood, the pathogenetic mechanisms of the adverse effects of their deficiency on the female and male skeleton, as well as the role of natural and synthetic estrogenic or androgenic compounds in the pharmacotherapy of osteoporosis. We highlight latest advances on the crosstalk between hormonal and mechanical signals, the relevance of the antioxidant properties of estrogens and androgens, the difference of their cellular targets in different bone envelopes, the role of estrogen deficiency in male osteoporosis, and the contribution of estrogen or androgen deficiency to the monomorphic effects of aging on skeletal involution.


Figures

FIGURE 1.
FIGURE 1.
Micro-CT images of 6- and 24-month-old murine femurs depicting the cortical and cancellous envelopes. Higher resolutions of the distal epiphyses, the areas contained in the red boxes, are provided next to the images of the whole femurs. Please note the thinning of the cortex, the virtual disappearance of the cancellous bone, and the extensive cortical porosity in the 24-month-old femur as compared with the 6-month-old femur.
FIGURE 2.
FIGURE 2.
Schematic representation of the remodeling process and the effects of estrogens and androgens. Osteoclasts and osteoblasts are derived from hematopoietic and mesenchymal precursors, respectively. During bone remodeling, bone matrix excavated by osteoclasts is replaced with new matrix produced by osteoblasts. Both estrogens and androgens influence the generation and lifespan of osteoclasts and osteoblasts, as well as the lifespan of osteocytes. Negative and positive effects of sex steroids on the generation and survival of the cells are depicted, by bookends and arrowheads.
FIGURE 3.
FIGURE 3.
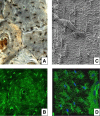
Osteocytes and their lacunar-canalicular network. A: human cortical bone section stained with India ink (courtesy of Robert S. Weinstein). B: bovine cortical bone section stained with fluorescein isothiocyanate (FITC) (from the laboratory of C. A. O'Brien). In both A and B, please note the cylindrical concentric organization of the osteocyte bodies, corresponding to the lamellar structures of osteonal bone with the blood vessel in the middle. C: electron microscopy images depicting reliefs of osteocytes and their canalicular network, following acid-etching of murine bone sections. Please note multiple attachments of the osteocyte processes to the vessels depicted in the center of the image. [From Manolagas (326).] D: confocal 3D imaging of phalloidin (green) and DAPI (blue) stained osteocytes in adult mouse long bone. Please note the intricate dendritic network and an intracortical blood vessel visible at the right of the image. [From Kamel-ElSayed et al. (241), with permission from Elsevier.]
FIGURE 4.
FIGURE 4.
Photomicrograph of a basic multicellular unit (BMU), in a section of vertebral murine cancellous bone (×630 magnification). Please note the osteoclasts, identified by their discrete tartrate-resistant acid phosphatase-positive red granules and the osteoblasts, identified by their large nuclei with multiple nucleoli and underlying light blue osteoid. Two capillaries containing erythrocytes are also seen. Several osteocytes (blue stained cells) can be seen embedded individually within the mineralized bone (beige) surrounding the BMU. [Republished with permission of The Endocrine Society from Weinstein et al. (555); permission conveyed through Copyright Clearance Center, Inc.]
FIGURE 5.
FIGURE 5.
Mechanisms of estrogen receptor action. A: classical genomic signaling in which the ligand-activated receptor dimer attaches to estrogen response elements (ERE) on DNA, and activates or represses transcription. B: ERE-independent genomic signaling pathway in which the ligand-activated receptor binds to other transcription factors (e.g., p50 and p65 subunits of NF-κB) and prevents them from binding to their response elements. C and D: nongenotropic mode of action in which the ligand-activated receptor (in the plasma membrane) activates cytoplasmic kinases which in turn cause the phosphorylation of substrate proteins and transcription factors (e.g., Elk-1 and c-jun) that positively (C) or negatively (D) regulate transcription. [From Manolagas et al. (333).]
FIGURE 6.
FIGURE 6.
Mean height velocity (in cm/yr) in non-African American children according to age and sex [from the U.S. Bone Mineral Density in Childhood Study (252).] The growth spurt starts ∼2 yr later in boys (9 vs. 11 yr). The striped area under the height velocity curve indicates the effect of delayed growth spurt onset on ultimate height in boys compared with girls. Peak height velocity (PHV) is also somewhat greater in boys on average, and growth velocity may be better maintained (and growth plate closure delayed) in late puberty (225). However, the latter factors play only a minor role in the sex difference in ultimate height, as indicated by the size of the two respective gray areas under the height velocity curve. [Based on results from Kelly et al. (252), with permission from the Endocrine Society.]
FIGURE 7.
FIGURE 7.
Schematic representation of the differences in cortical bone structure and density for girls (G) and boys (B) across puberty [by Tanner (T) stage]. Boys acquire higher estimated bone strength (failure load) due to their greater cortical bone diameter. The medullary cavity is also wider in boys, resulting in only mildly greater cortical thickness. Volumetric bone mineral density (vBMD) is higher in girls (whither cortex). Trabecular bone volume and cortical porosity (Ct.Po) are also higher in boys (differences not depicted). [From Nishiyama et al. (375), with permission from John Wiley & Sons, Inc.]
FIGURE 8.
FIGURE 8.
Proposed biphasic regulation of longitudinal bone growth and epiphyseal closure by sex steroids. Early in puberty, rising sex steroid concentrations stimulate longitudinal growth via indirect effects on growth hormone (GH) and insulin-like growth factor I (IGF-I), which both stimulate growth plate chondrocytes. In late puberty, higher estrogen concentrations exert an overruling inhibitory effect via ERα in chondrocytes. Androgens have effects mainly on GH while peripheral and central aromatization are believed to be more important for circulating IGF-I. AR is also expressed in chondrocytes, but whether this contributes to sex differences in longitudinal growth remains unclear. [Adapted from Börjesson et al. (65), with permission from John Wiley & Sons, Inc.]
FIGURE 9.
FIGURE 9.
Schematic representation of sex differences around the age of peak bone mass (20 yr) and subsequent lifetime changes at the endosteal and periosteal surface at the tibia [based on the longitudinal QCT findings from Lauretani et al. (294)]. The black interrupted circumferences represent the lower endosteal expansion in women and greater periosteal expansion in men, as compared with the other sex. Changes in cortical thickness are shown as bars in the inset; differences become progressively greater with age. The yellow circles represent the average degree of endosteal bone resorption (and cortical trabecularization) at the tibia in both genders (greater in women). The outer gray circles represent ongoing periosteal expansion in adulthood, which is particularly greater in men between the ages of 20 and 50. The black outer circles indicate ongoing periosteal expansion in old age, which is similar or even slightly greater in women at the tibia (but lower at the radius). [Adapted from Lauretani et al. (294), with permission from John Wiley & Sons, Inc.]
FIGURE 10.
FIGURE 10.
Microphotograph of a human trabecula perforated by osteoclastic resorption. The image is taken from an iliac crest biopsy specimen. Please note that resorption from either side of the trabecula has left only a thin thread of bone. [From Weinstein (553a).]
FIGURE 11.
FIGURE 11.
A: percent changes in urinary NTx excretion in men made acutely hypogonadal, treated with an aromatase inhibitor, and replaced with estrogen, testosterone, both, or neither. *P < 0.05, **P < 0.01, and ***P < 0.001 for change from baseline. The estrogen and testosterone effects were analyzed using a 2-factor ANOVA model: E effect, P = 0.0002; T effect, P = 0.085. B: data from A but now depicting postulated changes in cancellous bone resorption (testosterone effect) and in cortical bone resorption (estrogen effect) based on the mouse genetic studies of Ucer and colleagues. [From Khosla et al. (255), with permission from John Wiley & Sons, Inc.]
FIGURE 12.
FIGURE 12.
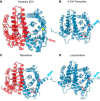
Cartoon representations of the 3D crystal structure of ERα ligand-binding domain (LBD) homodimers (red-blue or blue-blue) in complex with estradiol (E2) (75) (A), 4-OH-tamoxifen (459) (B), raloxifene (75) (C), and lasofoxifene (509) (D). In A, occupancy of the ligand-binding pocket by E2 stabilizes helix 12 in a folded position (red arrow), revealing an interaction surface (AF-2) for coactivators (yellow star). In B–D, SERMs occupy the ligand-binding pocket but additionally contain a bulky side chain (underlined in red) which pushes helix 12 (light blue arrows) in front of AF-2, rendering it unavailable (red stars). Note that the crystal structure of ERα in complex with bazedoxifene is not yet available. Created using JSmol using structural data from the Protein Data Bank.

References

    1. National Institute of Health Consensus Development Panel on Osteoporosis Prevention, Diagnosis, and Therapy. JAMA 285: 785–795, 2001. - PubMed
    1. Osteoporosis in Men: The Effects of Gender on Skeletal Health. London: Elsevier, 2010.
    1. Aarden EM, Burger EH, Nijweide PJ. Function of osteocytes in bone. J Cell Biochem 55: 287–299, 1994. - PubMed
    1. Adams GB, Scadden DT. The hematopoietic stem cell in its place. Nat Immunol 7: 333–337, 2006. - PubMed
    1. Aguirre JI, Plotkin LI, Gortazar AR, Millan MM, O'Brien CA, Manolagas SC, Bellido T. A novel ligand-independent function of the estrogen receptor is essential for osteocyte and osteoblast mechanotransduction. J Biol Chem 282: 25501–25508, 2007. - PubMed

Publication types

LinkOut - more resources