. 2016 Nov 2;8(363):363ra149.
doi: 10.1126/scitranslmed.aag1974.

Resolving TYK2 locus genotype-to-phenotype differences in autoimmunity

Affiliations

Resolving TYK2 locus genotype-to-phenotype differences in autoimmunity

Calliope A Dendrou et al. Sci Transl Med. .

Abstract

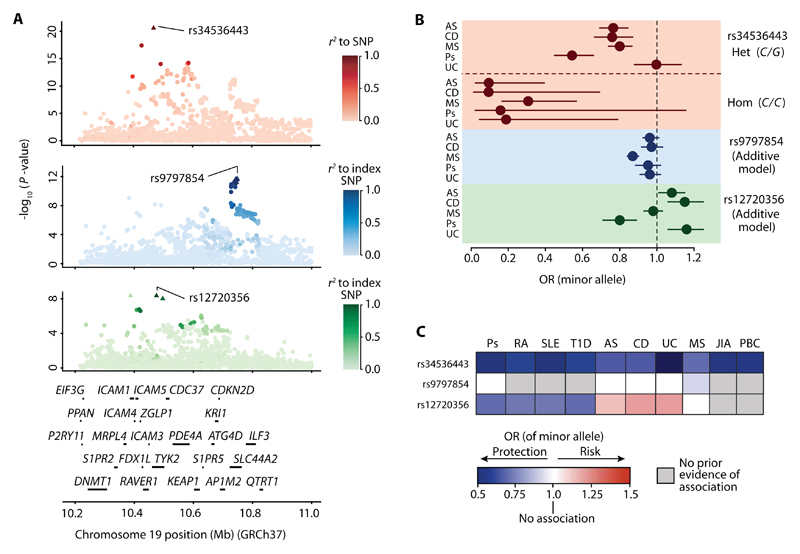
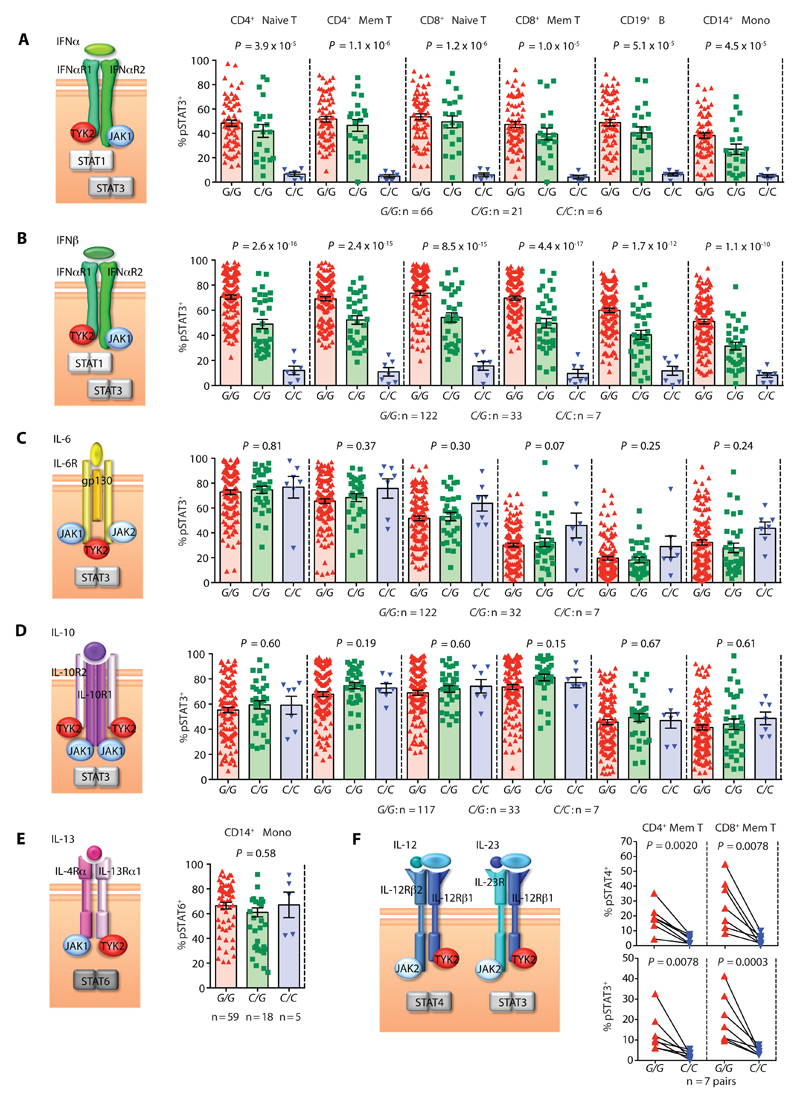
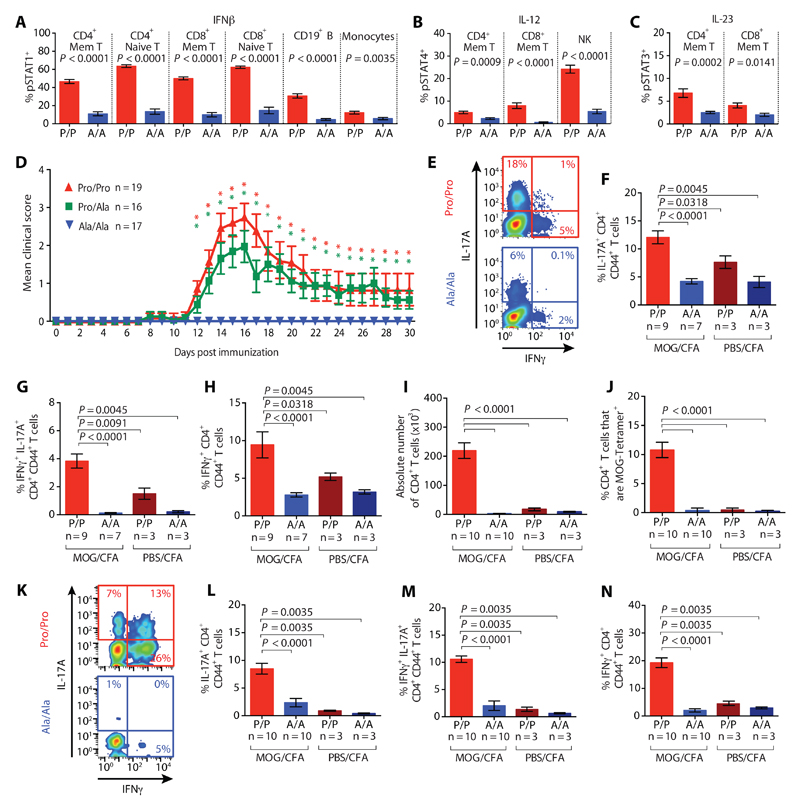
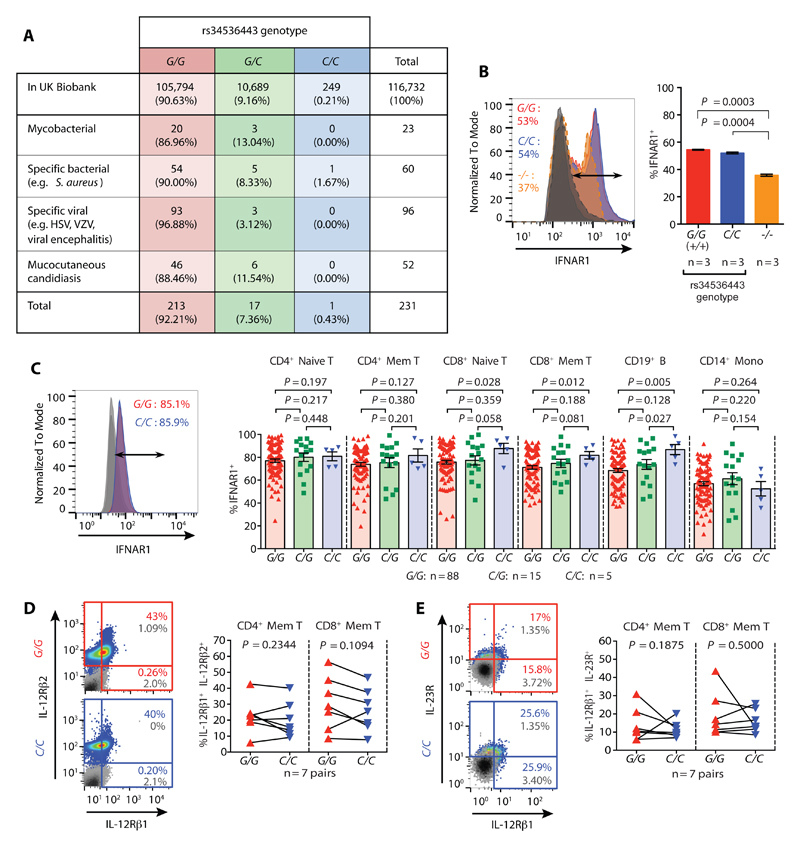
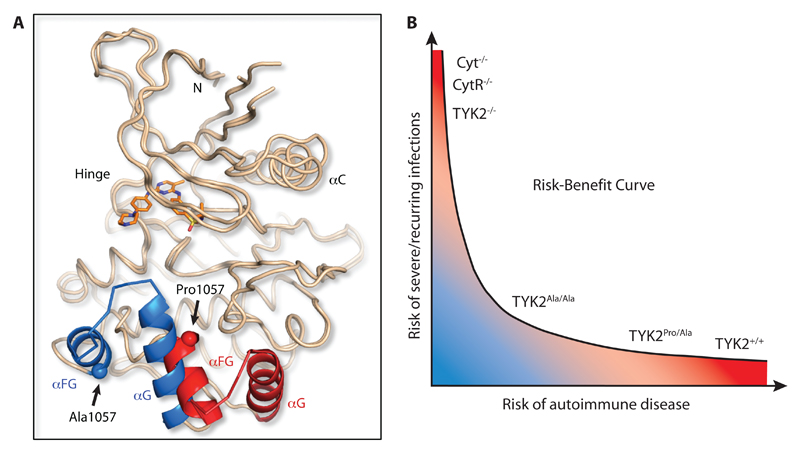
Thousands of genetic variants have been identified, which contribute to the development of complex diseases, but determining how to elucidate their biological consequences for translation into clinical benefit is challenging. Conflicting evidence regarding the functional impact of genetic variants in the tyrosine kinase 2 (TYK2) gene, which is differentially associated with common autoimmune diseases, currently obscures the potential of TYK2 as a therapeutic target. We aimed to resolve this conflict by performing genetic meta-analysis across disorders; subsequent molecular, cellular, in vivo, and structural functional follow-up; and epidemiological studies. Our data revealed a protective homozygous effect that defined a signaling optimum between autoimmunity and immunodeficiency and identified TYK2 as a potential drug target for certain common autoimmune disorders.


Conflict of interest statement

Competing interests. L. Jostins is a consultant to Genomics plc. M. Ultsch, A. R. Johnson, C. Everett and C. Eigenbrot hold equities in Roche Holdings. J. I. Bell is on the board of Roche and holds equities in Roche Holdings. G. McVean is co-founder, holder of shares in and consultant to Genomics plc. The other authors declare no competing financial interests.

Figures

Fig. 1
Fig. 1. Genetic associations in the TYK2 gene region across autoimmune disorders.
(A) Joint association signal plots generated through multinomial logistic regression analysis. Primary association with the signal at rs34536443 (red). Secondary association with the rs9797854 index SNP (blue). Tertiary association with the rs12720356 index SNP. Scale bars indicate degree of LD (r2) relative to each index SNP (green). Triangles indicate SNPs in the associated SNP cluster (90% credible set). The genes in the region are shown below the signal plots. (B) Odds ratios (ORs) for index SNPs for each of the five diseases and 95% confidence intervals (horizontal bars). For rs34536443, a non-additive effect was observed and ORs are shown separately for C/G heterozygosity (Het.) and C/C homozygosity (Hom.). For rs9797854 and rs12720356, the ORs fit an additive model. (C) Summary of associations of the minor alleles at rs34536443, rs9797854 and rs12720356 with psoriasis (Ps), rheumatoid arthritis (RA), systemic lupus erythematosus (SLE), type 1 diabetes (T1D), ankylosing spondylitis (AS), Crohn’s disease (CD), ulcerative colitis (UC), multiple sclerosis (MS), juvenile idiopathic arthritis (JIA), and primary biliary cirrhosis (PBC). The rs34536443 association for UC is shown for the homozygous state; for all other associations the allelic OR is depicted.
Fig. 2
Fig. 2. Cytokine-induced STAT phosphorylation by rs34536443 genotype in primary human immune cells.
Percentage of pSTAT+ cells by rs34536443 genotype for CD4+ naïve T cells, CD4+ memory (Mem) T cells, CD8+ naïve T cells, CD8+ memory T cells, CD19+ B cells and CD14+ monocytes (Mono) upon stimulation with (A) IFNα, (B) IFNβ, (C) IL-6 and (D) IL-10. CD14+ monocytes were stimulated with (E) IL-13. CD4+ memory T cells and CD8+ memory T cells were stimulated with (F) IL-12 (top graph) and IL-23 (bottom graph). For each cytokine a schematic of its receptor chains and the TYK2, JAK and STAT molecules that mediate its signaling are shown to the left of the respective graphs. For panels A-E, P-values provided are for a non-additive genetic model. For panels E and F, Wilcoxon matched-pairs rank tests were used. Error bars = ±SEM.
Fig. 3
Fig. 3. Tyk2 Ala-1124 homozygous mice have impaired cytokine signaling and are protected against EAE.
Phosphorylation of STAT (pSTAT) in splenic immune cells from Tyk2 Pro-1124 (red, denoted by P/P; n = 8) and Ala-1124 (blue, denoted by A/A; n = 8) homozygous mice after stimulation with (A) IFNβ, (B) IL-12, and (C) IL-23. (D) EAE disease course shown as mean clinical score following immunization of Pro/Pro (red triangles), Pro/Ala (green squares) and Ala/Ala-1124 (blue triangles) mice. *denotes P<0.05 comparing Pro/Pro-1124 and Pro/Ala-1124 to Ala/Ala-1124 mice, respectively. (E) Representative intracellular IL-17A and IFNγ staining, and proportion of (F) IL-17A+, (G) IFNγ+ IL-17A+, and (H) IFNγ+ CD4+ memory T cells in draining lymph nodes at peak EAE (or equivalent time-point in mice without disease) following immunization with MOG/CFA or PBS/CFA (negative control). (I) Absolute CD4+ T cell numbers in the central nervous system (CNS) at peak EAE. (J) Proportion of MOG-responsive CD4+ T cells in the CNS at peak EAE. (K) Representative intracellular IL-17A and IFNγ staining, and proportion of (L) IL-17A+, (M) IFNγ+ IL-17A+, and (N) IFNγ+ CD4+ memory T cells in the CNS at peak EAE following immunization with MOG/CFA or PBS/CFA. P-values were calculated using Mann-Whitney U tests. Error bars = ±SEM.
Fig. 4
Fig. 4. Rs34536443 genotype does not lead to immunodeficiency based on UK Biobank health record analysis and cell surface cytokine receptor expression.
(A) Frequency of individuals in the UK Biobank hospitalized due to TYK2 immunodeficiency-relevant infections and categorized by rs34536443 genotype. (B) Cell surface type I IFN receptor chain 1 (IFNAR1) expression on HEK 293T cell lines genetically modified at the TYK2 locus using CRISPR-Cas9. (C) Cell surface expression of IFNAR1 according to rs34536443 genotype. Representative surface expression shown for CD4+ naïve T cells (left), and quantification of IFNAR1 expression across subsets (right). (D) Cell surface expression of the IL-12 receptor chains (IL-12Rβ1 and IL-12Rβ2) on pre-activated T cells by rs34536443 genotype. Representative cytokine receptor expression shown for CD4+ memory T cells (left), with corresponding quantification in CD4+ and CD8+ memory T cells (right). (E) Cell surface expression of the IL-23 receptor chains (IL-12Rβ1 and IL-23R) on pre-activated T cells according to rs34536443 genotype. Representative cytokine receptor expression shown for CD8+ memory T cells (left), with corresponding quantification in CD4+ and CD8+ memory T cells (right). The grey histogram (panel B) and plots (panels D and E) show isotype control staining. For panels B and C, P-values were calculated using Mann-Whitney U tests. For panel D, P-values were calculated using Wilcoxon matched-pairs rank tests. Error bars = ±SEM.
Fig. 5
Fig. 5. JAK2 kinase domain Pro➔Ala substitution confers conformational change.
(A) Crystal structure of the TYK2-homologous JAK2-Ala-1057 kinase domain superimposed onto the JAK2-Pro-1057 kinase domain structure (PDB accession 4JI9). Both domains were complexed with the JAK2 inhibitor TG101209 (orange molecule) to stabilize the crystal structures. When the alanine residue is present at position 1057 a 15Å shift is observed in the αFG-αG helices (shown in blue) relative to their conformation when the proline residue is present (helices shown in red). (B) Relationship between genetically determined differences in TYK2-relevant cytokine signaling and risk for autoimmune disease versus severe and recurring infections. The kinase domain Pro➔Ala substitution likely confers a conformational change such that TYK2Ala/Ala mediates an optimal degree of cytokine signaling that may be low enough to prevent autoimmunity but high enough to prevent immunodeficiency. Cyt, cytokine; CytR, cytokine receptor.

References

    1. Manolio TA. Bringing genome-wide association findings into clinical use. Nat Rev Genet. 2013;14:549–558. - PubMed
    1. Hay M, Thomas DW, Craighead JL, Economides C, Rosenthal J. Clinical development success rates for investigational drugs. Nat Biotechnol. 2014;32:40–51. - PubMed
    1. Nelson MR, Tipney H, Painter JL, Shen J, Nicoletti P, Shen Y, Floratos A, Sham PC, Li MJ, Wang J, Cardon LR, et al. The support of human genetic evidence for approved drug indications. Nat Genet. 2015;47:856–860. - PubMed
    1. Plenge RM, Scolnick EM, Altshuler D. Validating therapeutic targets through human genetics. Nat Rev Drug Discov. 2013;12:581–594. - PubMed
    1. International Genetics of Ankylosing Spondylitis Consortium (IGAS) Cortes A, Hadler J, Pointon JP, Robinson PC, Karaderi T, Leo P, Cremin K, Pryce K, Harris J, Lee S, et al. Identification of multiple risk variants for ankylosing spondylitis through high-density genotyping of immune-related loci. Nat Genet. 2013;45:730–738. - PMC - PubMed

Publication types

MeSH terms