. 2016 Oct 19:7:472.
doi: 10.3389/fphys.2016.00472. eCollection 2016.

Cancer and Chemotherapy Contribute to Muscle Loss by Activating Common Signaling Pathways

Affiliations

Cancer and Chemotherapy Contribute to Muscle Loss by Activating Common Signaling Pathways

Rafael Barreto et al. Front Physiol. .

Abstract

Cachexia represents one of the primary complications of colorectal cancer due to its effects on depletion of muscle and fat. Evidence suggests that chemotherapeutic regimens, such as Folfiri, contribute to cachexia-related symptoms. The purpose of the present study was to investigate the cachexia signature in different conditions associated with severe muscle wasting, namely Colon-26 (C26) and Folfiri-associated cachexia. Using a quantitative LC-MS/MS approach, we identified significant changes in 386 proteins in the quadriceps muscle of Folfiri-treated mice, and 269 proteins differentially expressed in the C26 hosts (p < 0.05; -1.5 ≥ fold change ≥ +1.5). Comparative analysis isolated 240 proteins that were modulated in common, with a large majority (218) that were down-regulated in both experimental settings. Interestingly, metabolic (47.08%) and structural (21.25%) proteins were the most represented. Pathway analysis revealed mitochondrial dysfunctions in both experimental conditions, also consistent with reduced expression of mediators of mitochondrial fusion (OPA-1, mitofusin-2), fission (DRP-1) and biogenesis (Cytochrome C, PGC-1α). Alterations of oxidative phosphorylation within the TCA cycle, fatty acid metabolism, and Ca2+ signaling were also detected. Overall, the proteomic signature in the presence of both chemotherapy and cancer suggests the activation of mechanisms associated with movement disorders, necrosis, muscle cell death, muscle weakness and muscle damage. Conversely, this is consistent with the inhibition of pathways that regulate nucleotide and fatty acid metabolism, synthesis of ATP, muscle and heart function, as well as ROS scavenging. Interestingly, strong up-regulation of pro-inflammatory acute-phase proteins and a more coordinated modulation of mitochondrial and lipidic metabolisms were observed in the muscle of the C26 hosts that were different from the Folfiri-treated animals. In conclusion, our results suggest that both cancer and chemotherapy contribute to muscle loss by activating common signaling pathways. These data support the undertaking of combination strategies that aim to both counteract tumor growth and reduce chemotherapy side effects.

Keywords: C26; Folfiri; cachexia; inflammation; mitochondria; mitochondrial fusion and fission; muscle; proteomics.


Figures

Figure 1
Figure 1
Cancer and chemotherapy promote the down-regulation of 235 and 345 muscle proteins, respectively. (A) Pie charts showing the number of proteins that are down-regulated (green) or up-regulated (red) following tumor growth (C26, left) or chemotherapy (Folfiri, right). (B) Comparative analysis between C26 and Folfiri biosets (Bs 1 and Bs 2, respectively). The Venn diagram (left) shows the number of proteins that are modulated in common or in the presence of either C26 or Folfiri. The overlap p-value, indicating the statistically significant overlap between the two datasets, is also reported. Analogously, the significance of the overlap between different protein subsets within the group of proteins modulated in both subsets is also presented (right). (C) The proteins detected in the C26 (left) and Folfiri (middle) datasets, or modulated in common (right) were classified based on their function and/or pathway and distributed as shown in the pie charts. The percentage is expressed over the total number in proteins in each dataset.
Figure 2
Figure 2
Pathway analysis of muscle proteomic profiling in cancer or chemotherapy-induced cachexia. By utilizing the IPA software, the C26 and Folfiri datasets were subjected to pathway analysis. The pathways were ranked based on their overlap p-value (bars). Top-20 pathways are reported in the diagram, along with the number of proteins modulated within each pathway (triangles).
Figure 3
Figure 3
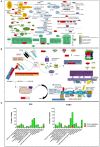
Major pathways affected in cancer- and drug-induced cachexia. (A) Proteins belonging to any metabolic pathway are indicated and classified as shown in color legend (right). Proteins up-regulated in almost one comparison (C26 vs. control or Folfiri vs. vehicle) are shown in red. All other proteins reported are down-regulated. (B) Structural proteins, calcium- and proteasome-associated proteins affected by either cancer or chemotherapy. (C) Number of proteins taking part to any of the major pathways affected in cancer- and chemotherapy-induced cachexia. Up-regulated proteins are reported in red, down-regulated proteins are shown in green.
Figure 4
Figure 4
The expression of markers of mitochondrial fusion, fission and biogenesis is affected by tumor and drug-induced cachexia. (A) Representative western blotting for OPA-1, Mitofusin-2, DRP-1, Cytochrome-C (Cyt-C), and PGC-1α in the muscle of C26 hosts or mice exposed to Folfiri. (B,C) Quantification of the bands (n = 4). Significance of the differences: *p < 0.05, **p < 0.01, ***p < 0.001 vs. Control or Vehicle.
Figure 5
Figure 5
Upstream regulators in C26- and Folfiri-induced cachexia. The IPA-mediated analysis identified several upstream regulators ranked based on their overlap p-value, whose activation (z-score > 2) or inhibition (z-score < −2) is associated with the phenotype observed. Top panel: Top-20 upstream regulators activated (A) or inhibited (B) in C26 cachexia. Bottom panel: Top-20 upstream regulators activated (C) or inhibited (D) in Folfiri-associated cachexia.
Figure 6
Figure 6
Diseases and functions associated with C26- and Folfiri-induced cachexia. The IPA software identified diseases and functions, ranked based on their overlap p-value, expected to be activated (z-score > 2) or inhibited (z-score < −2) in the C26 and Folfiri datasets. Top panel: diseases and functions activated (A) or inhibited (B) in C26 cachexia. Bottom panel: diseases and functions activated (C) or inhibited (D) in Folfiri-associated cachexia. Only the Top-20 diseases and functions are reported in the diagram, along with the number of correlated proteins (triangles).

References

    1. American Cancer Society (2015). Cancer Statistics. Atlanta, GE: American Cancer Society.
    1. Antoun S., Baracos V. E., Birdsell L., Escudier B., Sawyer M. B. (2010). Low body mass index and sarcopenia associated with dose-limiting toxicity of sorafenib in patients with renal cell carcinoma. Ann. Oncol. 21, 1594–1598. 10.1093/annonc/mdp605 - DOI - PubMed
    1. Aoyagi T., Terracina K. P., Raza A., Matsubara H., Takabe K. (2015). Cancer cachexia, mechanism and treatment. World J. Gastrointest. Oncol. 7, 17–29. 10.4251/wjgo.v7.i4.17 - DOI - PMC - PubMed
    1. Argilés J. M., López-Soriano F. J., Busquets S. (2015). Muscle wasting in cancer: the role of mitochondria. Curr. Opin. Clin. Nutr. Metab. Care 18, 221–225. 10.1097/MCO.0000000000000164 - DOI - PubMed
    1. Bapuji S. B., Sawatzky J. A. (2010). Understanding weight loss in patients with colorectal cancer: a human response to illness. Oncol. Nurs. Forum 37, 303–310. 10.1188/10.ONF.303-310 - DOI - PubMed