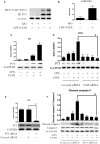
. 2016 Oct 19:6:133.
doi: 10.3389/fcimb.2016.00133. eCollection 2016.

Lipopolysaccharide Induces Human Pulmonary Micro-Vascular Endothelial Apoptosis via the YAP Signaling Pathway

Affiliations

Lipopolysaccharide Induces Human Pulmonary Micro-Vascular Endothelial Apoptosis via the YAP Signaling Pathway

Lei Yi et al. Front Cell Infect Microbiol. .

Abstract

Gram-negative bacterial lipopolysaccharide (LPS) induces a pathologic increase in lung vascular leakage under septic conditions. LPS-induced human pulmonary micro-vascular endothelial cell (HPMEC) apoptosis launches and aggravates micro-vascular hyper-permeability and acute lung injury (ALI). Previous studies show that the activation of intrinsic apoptotic pathway is vital for LPS-induced EC apoptosis. Yes-associated protein (YAP) has been reported to positively regulate intrinsic apoptotic pathway in tumor cells apoptosis. However, the potential role of YAP protein in LPS-induced HPMEC apoptosis has not been determined. In this study, we found that LPS-induced activation and nuclear accumulation of YAP accelerated HPMECs apoptosis. LPS-induced YAP translocation from cytoplasm to nucleus by the increased phosphorylation on Y357 resulted in the interaction between YAP and transcription factor P73. Furthermore, inhibition of YAP by small interfering RNA (siRNA) not only suppressed the LPS-induced HPMEC apoptosis but also regulated P73-mediated up-regulation of BAX and down-regulation of BCL-2. Taken together, our results demonstrated that activation of the YAP/P73/(BAX and BCL-2)/caspase-3 signaling pathway played a critical role in LPS-induced HPMEC apoptosis. Inhibition of the YAP might be a potential therapeutic strategy for lung injury under sepsis.

Keywords: P73; Yes-associated protein; apoptosis; endothelial cells; lipopolysaccharide.


Figures
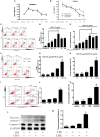
Figure 1
Figure 1
LPS induces HPMEC apoptosis in the presence of CHX. The viability of HPMECs was assessed after incubation with different concentrations of LPS (0, 0.01, 0.1, 1, 10, 100 μg/ml) for 24 h (A). HPMECs were further incubated with different concentrations of LPS (0, 0.1, 1 μg/ml) and CHX (0–20 μg/ml) for 24 h, and viability was determined using the CCK-8 assay. When concentration of CHX was 10 μg/ml, the combination of LPS and CHX induced obvious cells death (B). #P < 0.05 vs. the comparator group without LPS treatment. HPMECs were exposed to CHX (10 μg/ml) and different concentration of LPS (0, 0.01, 0.1, 1, 10, 100 μg/ml) for 24 h, and apoptosis was measured by Annexin V/PI staining. The total apoptosis rate is expressed as the sum of the right upper and right lower quadrants. The early apoptosis rate is expressed as the right lower quadrants. The peak of apoptosis occurred at a LPS concentration of 1 μg/ml (C). The results are presented as a histogram showing the percentage of total apoptosis cells and early apoptosis cells (D,E). #P < 0.05 vs. the comparator group treated only with CHX. HPMECs were incubated with CHX (10 μg/ml) and LPS (1 μg/ml) for the indicated times, and the apoptosis rate peaked at 24 h (F). The results are presented as a histogram showing the percentage of total apoptosis cells and early apoptosis cells (G,H). *P < 0.05 vs. the control group. The combination of LPS (1 μg/ml) and CHX (10 μg/ml), but not LPS or CHX alone, induced obvious HPMEC apoptosis after 24 h flow cytometry (I). The results are presented as a histogram showing the percentage of total apoptosis cells and early apoptosis cells (J,K). *P < 0.05 vs. the control group. Cleaved caspase-3 expression was detected in HPMECs incubated with LPS (1 μg/ml) and CHX (10 μg/ml) for 24 h (L,M). Cells treated with medium alone were used as a negative control. *P < 0.05 vs. the negative control group.
Figure 2
Figure 2
YAP is activated during LPS-induced HPMEC apoptosis. Expression of YAP and P-YAP (Y357) in HPMECs at the indicated time points after stimulation with LPS (1 μg/ml) and CHX (10 μg/ml) (A,B). Cells treated with medium alone were used as the negative control. *P < 0.05 vs. the negative control group. HPMECs were exposed to LPS (1 μg/ml) and CHX (10 μg/ml) before fixation and staining with anti-P-YAP (Y357) antibody as described in Materials and Methods (C). P-YAP (Y357) (red) and nuclear staining with DAPI (blue) were visualized by immunofluorescence microscopy. Simultaneously, P-YAP (Y357) (brown) was detected by immunocytochemistry after incubation with LPS (1 μg/ml) and CHX (10 μg/ml). White arrows represent the expression of P-YAP (357) in the nucleus in HPMECs.
Figure 3
Figure 3
YAP protein accelerates LPS-induced HPMEC apoptosis. Western blot analysis of YAP depletion in HPMECs (A,B). #P < 0.05 vs. the control siRNA group. After transfection with YAP siRNA or control siRNA for 6 h, HPMECs were treated with LPS (1 μg/ml) and CHX (10 μg/ml) for the indicated times, and apoptotic cells was detected by Annexin V/PI staining (C). The percentage of total apoptotic cells and early apoptotic cells are presented as a histogram showing results obtained by flow cytometry (D,E). *P < 0.05 vs. the control group. #P < 0.05 vs. the corresponding LPS and CHX treatment group. HPMECs were transfected with YAP siRNA or control siRNA for 6 h and then stimulated with medium alone, LPS, CHX, or the combination of LPS and CHX for 24 h. The levels of cleaved PARP were determined by Western blot analysis (F). The Western blotting results are presented as a histogram showing the band intensity values (G). Cells treated with medium alone were used as the negative control. *P < 0.05 vs. the negative control group. #P < 0.05 vs. the corresponding LPS and CHX treatment groups.
Figure 4
Figure 4
YAP interacts with P73 during LPS-induced HPMEC apoptosis. P73 and phosphor-YAP (Y357) formed the signaling complex. Co-IP was performed to detect the P73-YAP complex at the indicated times after stimulation with LPS and CHX. Western blotting was performed to detect P-YAP (Y357) in the IP complexes (A). The expression of phosphor-YAP (Y357) in IP complexes is presented as a histogram showing the band intensity values (B). *P < 0.05 vs. the untreated group. HPMECs were incubated with LPS (1 μg/ml) and CHX (10 μg/ml) for 24 h, and P73 protein was detected by Western blot analysis (C). *P < 0.05 vs. the control group. HPMECs were transferred with YAP siRNA or control siRNA for 6 h and then stimulated with medium alone, LPS, CHX, or the combination of LPS and CHX for 24 h. The levels of P73 were determined by Western blot analysis (D). Cells treated with medium alone were used as the negative control. *P < 0.05 vs. the negative control group. #P < 0.05 vs. the corresponding LPS and CHX treatment group. Western blot analysis of P73 depletion in HPMECs (E). #P < 0.05 vs. the control siRNA group. After transfection with P73 siRNA or control siRNA for 6 h, HPMECs were treated with LPS (1 μg/ml) and CHX (10 μg/ml) for the indicated times, and cleaved caspase-3 was detected by Western blot analysis (F). Cells treated with medium alone were used as the negative control. *P < 0.05 vs. the negative control group. #P < 0.05 vs. the corresponding LPS and CHX treatment group.
Figure 5
Figure 5
YAP/P73 signaling is involved in LPS-induced HPMEC apoptosis via regulation of BAX and BCL-2. The HPMECs were exposed to the combination of LPS (1 μg/ml) and CHX (10 μg/ml) for 24 h, and BAX and BCL-2 expression levels were measured by Western blot analysis (A,B). After transfection with YAP siRNA or control siRNA, HPMECs were treated with LPS (1 μg/ml) and CHX (10 μg/ml) for the indicated times, and BAX and BCL-2 were detected by Western blot analysis (C). The Western blotting results are presented as a histogram showing the band intensity values (D). Cells treated with medium alone were used as the negative control. *P < 0.05 vs. the negative control group. #P < 0.05 vs. the corresponding LPS and CHX treatment group. HPMECs were transfected with P73 siRNA or control siRNA for 6 h and were then stimulated with medium alone, LPS, CHX, or the combination of LPS and CHX for 24 h. The levels of BAX and BCL-2 protein were determined by Western blot analysis (E). The Western blotting results are presented as a histogram showing the band intensity values (F). Cells treated with medium alone were used as the negative control. *P < 0.05 vs. the negative control group. #P < 0.05 vs. the corresponding LPS and CHX treatment groups.

References

    1. Adrain C., Martin S. J. (2001). The mitochondrial apoptosome: a killer unleashed by the cytochrome seas. Trends Biochem. Sci. 26, 390–397. 10.1016/S0968-0004(01)01844-8 - DOI - PubMed
    1. Bannerman D. D., Eiting K. T., Winn R. K., Harlan J. M. (2004). FLICE-like inhibitory protein (FLIP) protects against apoptosis and suppresses NF-κB activation induced by bacterial lipopolysaccharide. Am. J. Pathol. 165, 1423–1431. 10.1016/S0002-9440(10)63400-1 - DOI - PMC - PubMed
    1. Bannerman D. D., Goldblum S. E. (2003). Mechanisms of bacterial lipopolysaccharide-induced endothelial apoptosis. Am. J. Physiol. Lung Cell. Mol. Physiol. 284, L899–L914. 10.1152/ajplung.00338.2002 - DOI - PubMed
    1. Bannerman D. D., Tupper J. C., Ricketts W. A., Bennett C. F., Winn R. K., Harlan J. M. (2001). A constitutive cytoprotective pathway protects endothelial cells from lipopolysaccharide-induced apoptosis. J. Biol. Chem. 276, 14924–14932. 10.1074/jbc.M100819200 - DOI - PubMed
    1. Basu S., Totty N. F., Irwin M. S., Sudol M., Downward J. (2003). Akt phosphorylates the Yes-associated protein, YAP, to induce interaction with 14-3-3 and attenuation of p73-mediated apoptosis. Mol. Cell 11, 11–23. 10.1016/S1097-2765(02)00776-1 - DOI - PubMed