. 2016 Nov 3:6:35976.
doi: 10.1038/srep35976.

HnRNP L is important for the expression of oncogene SRSF3 and oncogenic potential of oral squamous cell carcinoma cells

Affiliations

HnRNP L is important for the expression of oncogene SRSF3 and oncogenic potential of oral squamous cell carcinoma cells

Rong Jia et al. Sci Rep. .

Abstract

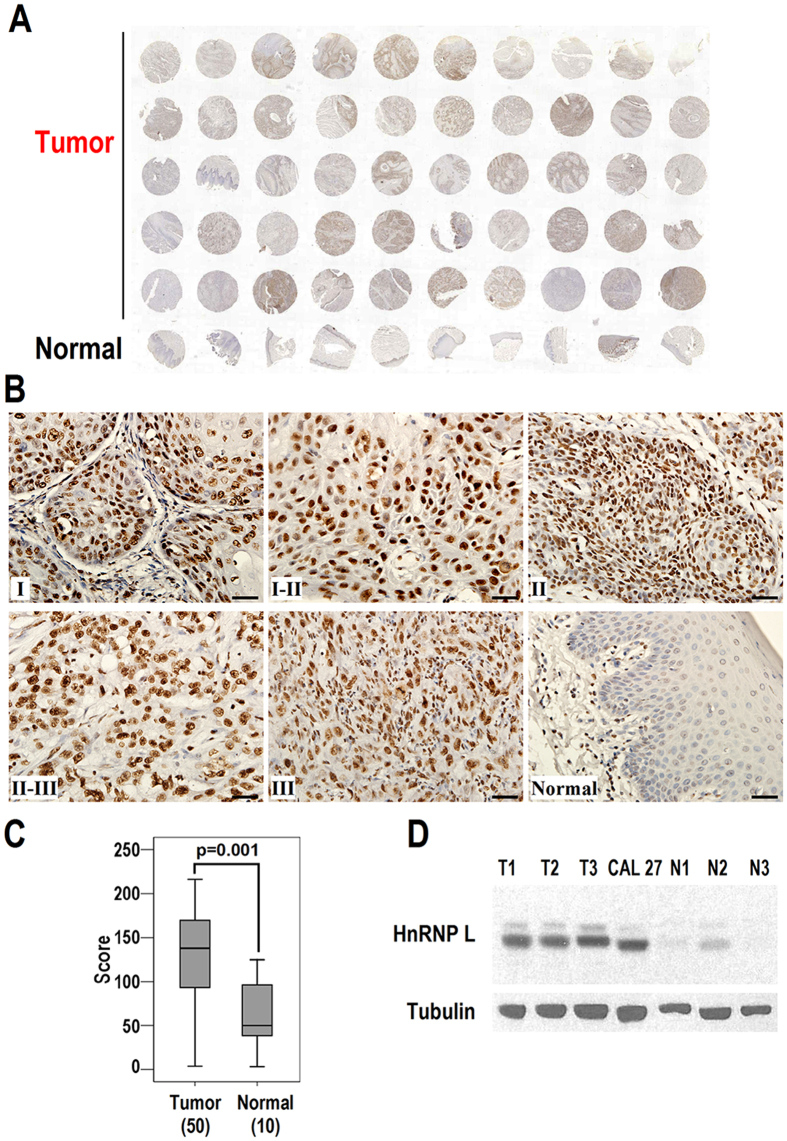
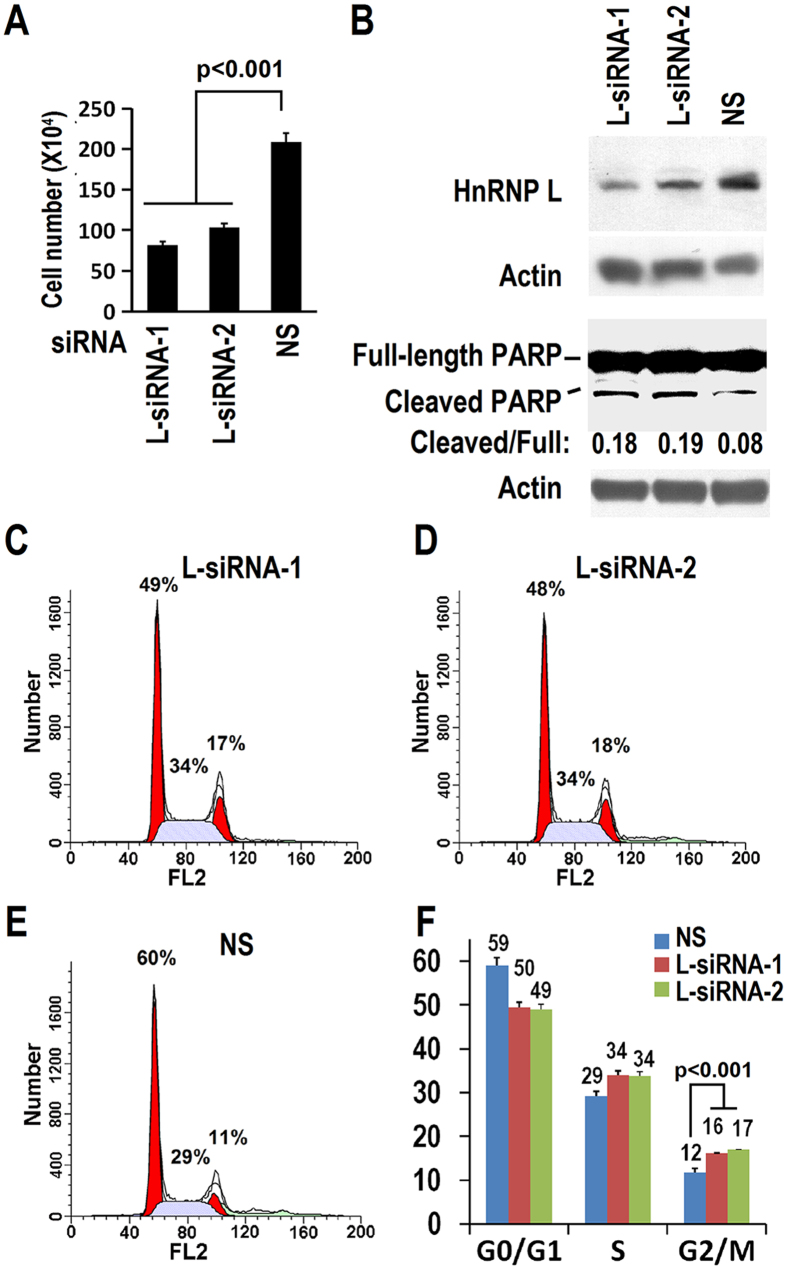
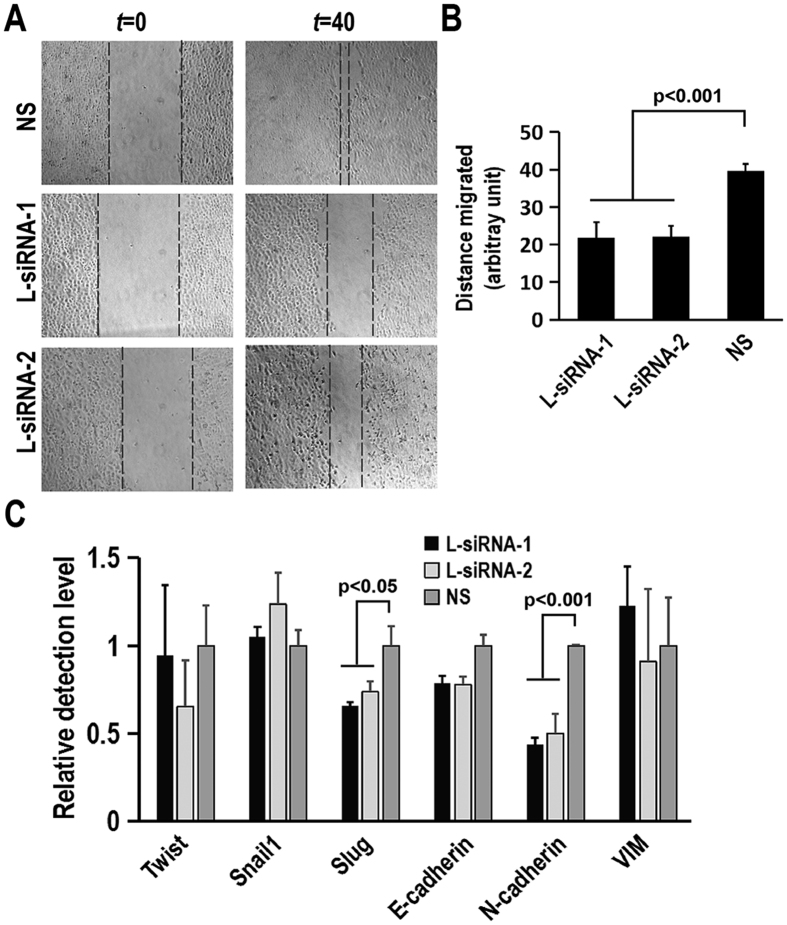
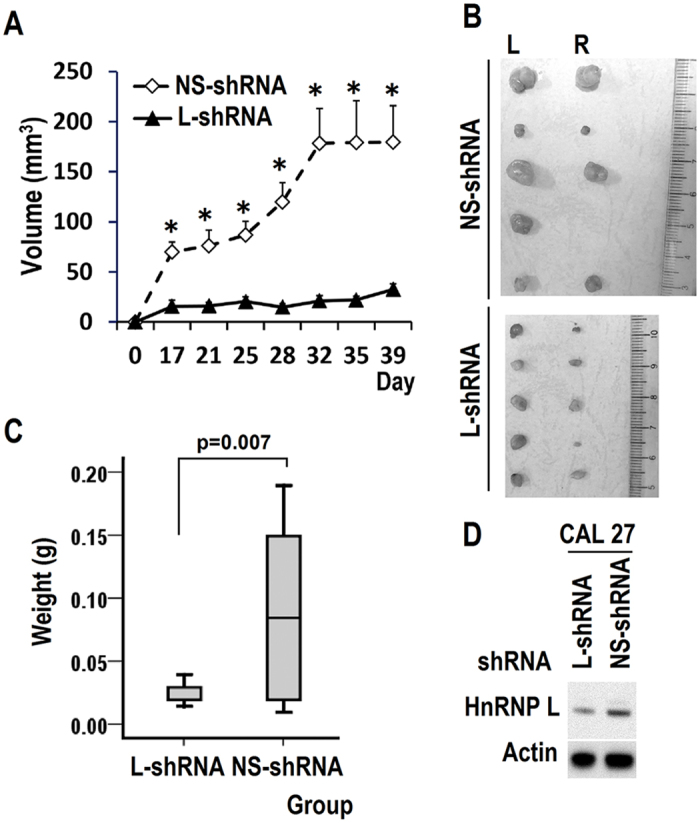
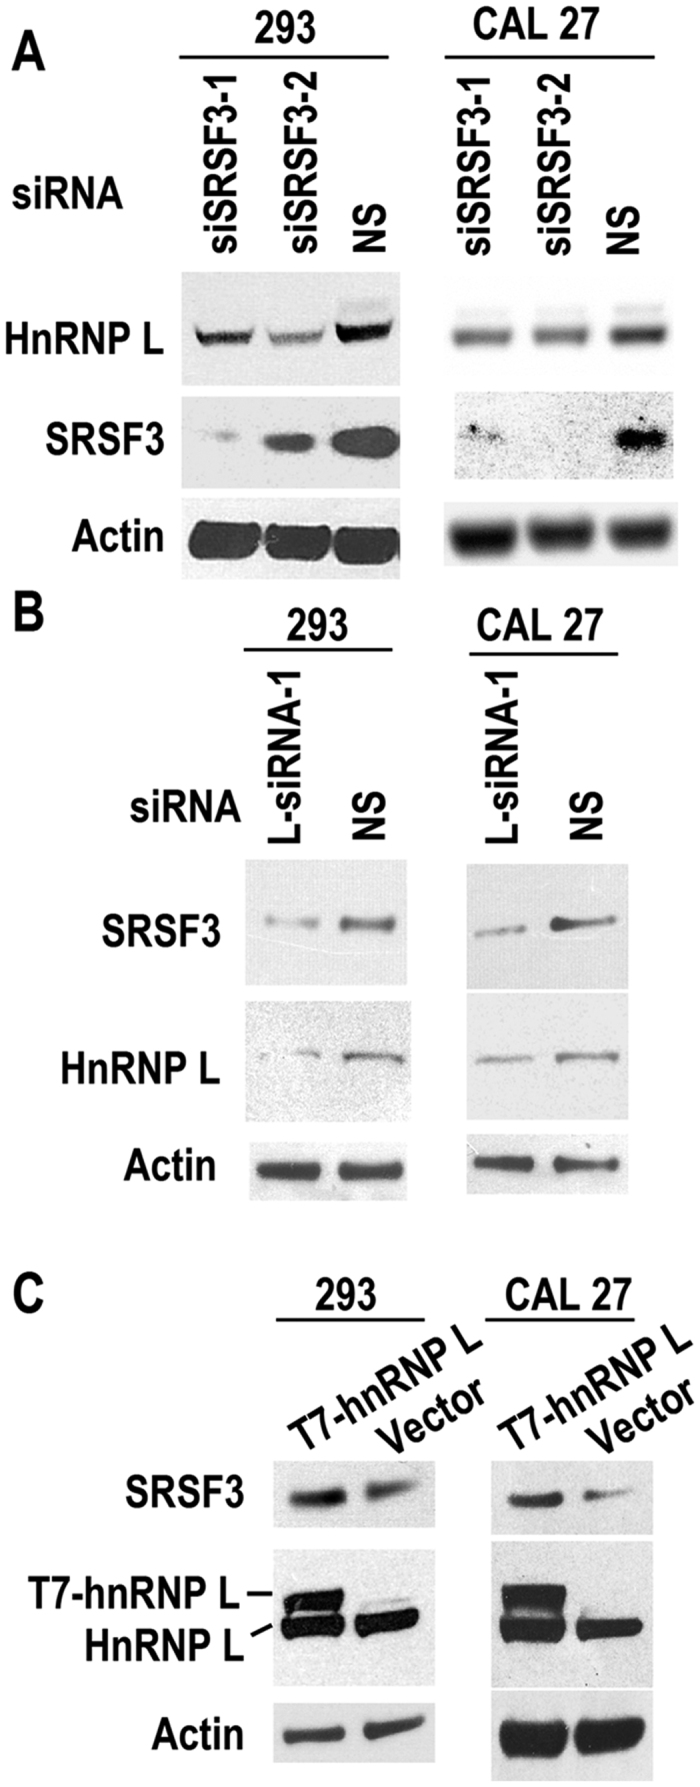
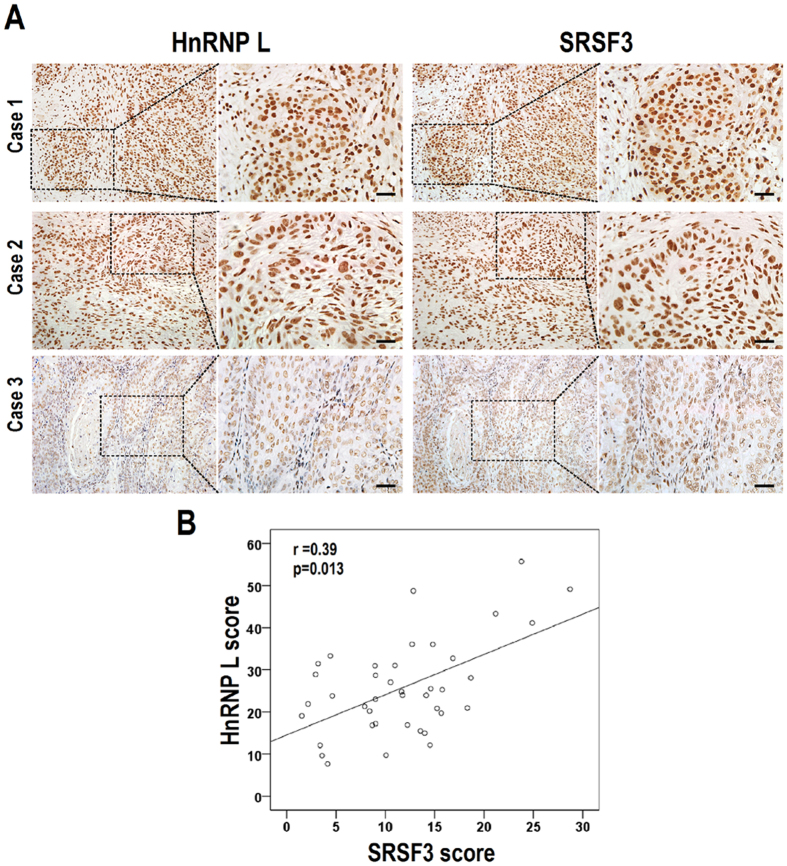
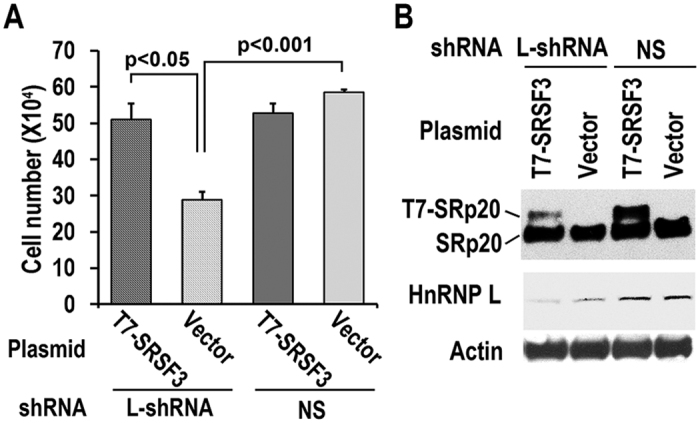
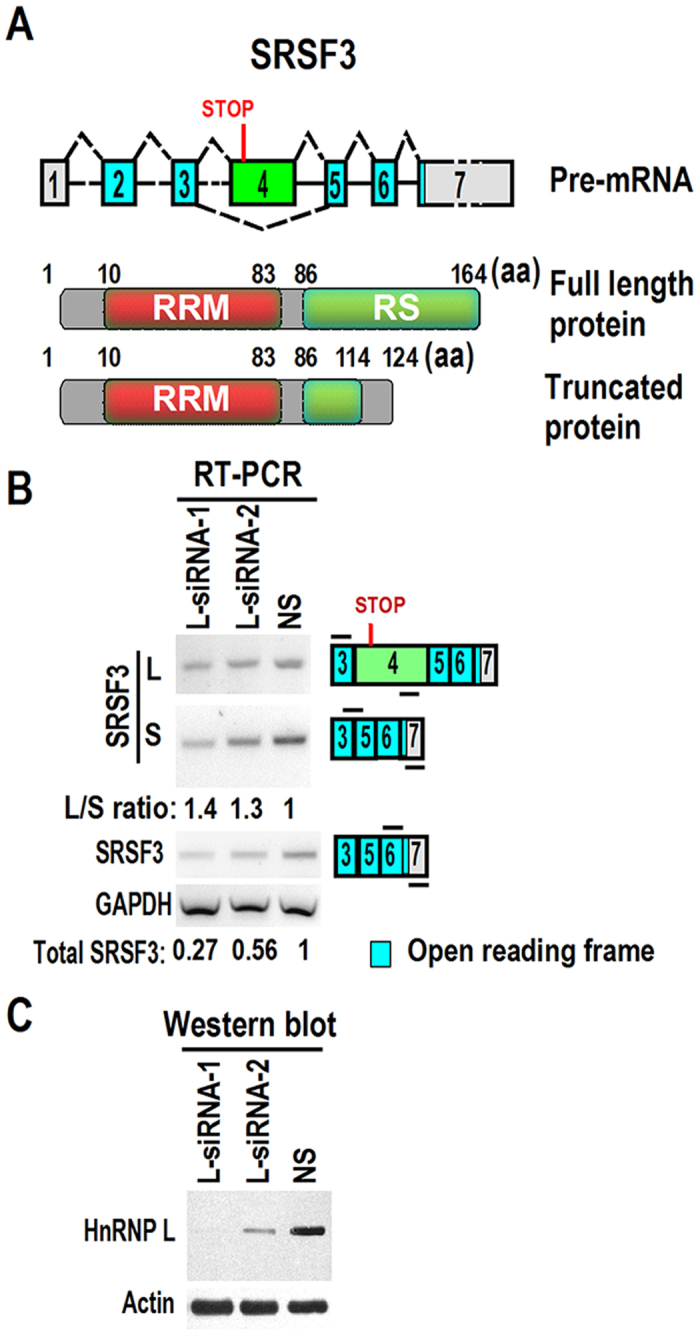
Oral squamous cell carcinoma (OSCC) is the leading cause of death related to oral diseases. The mechanisms of OSCC development remain largely unknown. Heterogeneous nuclear ribonucleoprotein L (HnRNP L) is a multi-functional splicing factor. It has been reported to be an important regulator of apoptosis. However, the functions of hnRNP L in cancer need to be further explored. In the present study, we found that OSCC tissues expressed significantly higher levels of hnRNP L than normal tissues. Depletion of hnRNP L retarded cell growth, cell migration, and tumorigenesis of OSCC cells. HnRNP L regulates both the expression of oncogenic splicing factor SRSF3 and the alternative splicing of SRSF3 exon 4. Expression of hnRNP L is correlated with SRSF3 expression in OSCC tissues. These findings suggest that hnRNP L is important for the pathogenesis of OSCC and may be a novel potential therapeutic target of OSCC.


Figures

Figure 1
Figure 1. Overexpression of hnRNP L in OSCCs.
Immunohistochemical analysis of hnRNP L expression in a commercial OSCC tissue array (including 50 OSCC tumor samples and 10 normal oral mucosa samples). (A) Tissue array stained with anti-hnRNP L antibody. The specificity of anti-hnRNP L antibody is confirmed by a negative controls (Figure S1A) and positive control (Figure S1B). (B) Representative immunohistochemical staining of hnRNP L in OSCCs with different grades, or normal oral mucosal epithelium. Scale bar is 20 μm. (C) Box plot comparing immunostaining scores of hnRNP L between tumor and normal tissues in the tissue array. (D) Western blot analysis of the expression of hnRNP L in primary human oral squamous cancer cells, CAL 27 cells, or normal primary oral mucosal epithelial cells. β-tubulin served as loading control.
Figure 2
Figure 2. HnRNP L is required for CAL 27 proliferation.
(A) Knockdown of hnRNP L inhibited CAL 27 cell growth. CAL 27 cells (2 × 105 cells/well) were seeded into 12 well plates and transfected by 20 nM hnRNP L siRNAs or non-specific siRNA (NS) on Day 0. Cells were passed and transfected again on Day 2. Cell numbers were counted on Day 4. Values represent means ± SE. (B) Western blot displayed knockdown efficiency of hnRNP L and the cleavage of PARP. The ratio PARP cleaved/full is an index of apoptosis, which was calculated based on the ratio of band intensities of cleaved vs full length PARP. β-actin served as loading control. (C–F) HnRNP L is involved in cell cycle progression. (C–E) Cell cycle analysis of CAL 27 cells treated with L-siRNA-1 (C), L-siRNA-2 (D), or non-specific (NS) siRNA (E). Cells were transfected twice as in (A). Results show one representative experiment of four. Data were analyzed by Modfit LT software and drawn as column charts by EXCEL. (F) Summary and statistical analysis of four independent experiments. Data are means ± SE.
Figure 3
Figure 3. Involvement of hnRNP L in cell migration.
CAL 27 cells were treated with siRNA twice and grew to 95-100% confluence. The monolayer of cells were wounded and washed thrice with PBS on 0 h (t = 0). Wound healing was photographed at 40 h (t = 40). The cell migration was expressed as distance (arbitrary unit) traveled by cells. (A) Representative images of CAL 27 cell migration affected by siRNA treatment. (B) Summary and statistical analysis of three independent experiments. Data are means ± SE. (C) HnRNP L regulates the expression of epithelial-mesenchymal transition (EMT) related-genes. CAL 27 cells were transfected with siRNA twice in an interval of 48 hours. The expression levels of Twist, Snail1, Slug, E-cadherin, N-cadherin and Vimentin (VIM) were analyzed by real-time quantitative RT-PCR.
Figure 4
Figure 4. HnRNP L is required for tumorigenesis of OSCC cells in vivo.
(A) 1.5 × 106 CAL 27 cells stably transfected with hnRNP L shRNA (L-shRNA) or non-specific (NS) shRNA were implanted by dorsal subcutaneous inoculation at both sides of nude mice (5 mice per group). Tumor sizes were monitored every 3 to 4 days. Tumor volume was calculated as (length × width2) π/6. Data are means ± SE. *p < 0.01. (B,C) Tumors were dissected out (L, left; R, right) and weighed on day 39. The boxplot represents the distribution of tumor weight in each group of mice. (D) The total protein samples of cells were collected at the time of injection. Western blot displayed knockdown efficiency of hnRNP L. β-actin served as loading control.
Figure 5
Figure 5. Oncogene SRSF3 is the target of hnRNP L.
There is a mutual regulation between SRSF3 and hnRNP L. (A) CAL 27 or 293 cells were treated with siSRSF3-1, siSRSF3-2 or none-specific (NS) siRNA. Knockdown of SRSF3 reduced the expression of hnRNP L in both CAL 27 and 293 cells. (B) CAL 27 or 293 cells were treated with hnRNP L or none-specific (NS) siRNA. Knockdown of hnRNP L reduced the expression of SRSF3 in both CAL 27 and 293 cells. (C) CAL 27 or 293 cells were transfected with T7 tagged hnRNP L or vector plasmid. Overexpression of hnRNP L promotes the expression of SRSF3 in both CAL 27 and 293 cells.
Figure 6
Figure 6. SRSF3 protein expression correlates positively with hnRNP L expression in OSCC tissues.
(A) Representative immunohistochemical staining of hnRNP L and SRSF3 in the serial sections from the same patients. Case 1 and 2 express high levels of both hnRNP L and SRSF3; case 3 expresses low level of both proteins. Scale bar is 20 μm. (B) A significant positive correlation was observed between hnRNP L and SRSF3 expression levels (Spearman’s correlation coefficients: r = 0.39, p = 0.013). Each dot represents a single tumor.
Figure 7
Figure 7. Overexpression of SRSF3 rescued cell growth inhibition induced by hnRNP L knockdown in CAL 27 cells.
(A) CAL 27 cells stably transfected with hnRNP L shRNA (L-shRNA) or non-specific (NS) shRNA were seeded into 12 well plates (1.5 × 105 cells per well) and transfected by T7-SRSF3 expression plasmid or vector control plasmid. Forty-eight hours later, cell number was counted. Values represent means ± SE. (B) Western blot displayed knockdown efficiency of hnRNP L and overexpression of exogenous T7 tagged SRSF3. β-actin served as loading control.
Figure 8
Figure 8. HnRNP L regulates both alternative splicing and transcription of SRSF3 mRNA.
(A) Schematic diagram of the alternative splicing of exon 4 and functional domains of SRSF3. Inclusion of exon 4, which contains an in-frame stop codon, will cause degradation of SRSF3 transcript or encode a truncated SRSF3. The transcript without exon 4 encodes the full-length SRSF3. Note: aa, amino acids. RRM: RNA recognition motif. RS: arginine/serine-rich domain. (B) CAL 27 cells were treated with anti-hnRNP L or none-specific (NS) siRNA twice in a 48-hour interval. Alternative splicing of SRSF3 exon 4 was analyzed by RT-PCR. L/S ratio represents the inclusion levels of exon 4 in mature mRNAs, which was calculated based on the ratio of band intensities of long vs short isoforms. Whole transcriptional level of SRSF3 was analyzed by a pair of primers located at exon 6 and 7, respectively. GAPDH served as the loading control. Diagrams on the right of (B) show the structures of SRSF3 pre-mRNA and spliced products. Short lines above or below exons represent primer positions. (C) Western blot displayed knockdown efficiency of hnRNP L. β-actin served as loading control.

Similar articles

Cited by

References

    1. Bagan J., Sarrion G. & Jimenez Y. Oral cancer: clinical features. Oral Oncol. 46, 414–417 (2010). - PubMed
    1. Siegel R., Ma J., Zou Z. & Jemal A. Cancer statistics, 2014. CA Cancer J. Clin. 64, 9–29 (2014). - PubMed
    1. Zhang J. & Manley J. L. Misregulation of pre-mRNA alternative splicing in cancer. Cancer Discov. 3, 1228–1237 (2013). - PMC - PubMed
    1. Karni R. et al.. The gene encoding the splicing factor SF2/ASF is a proto-oncogene. Nat. Struct. Mol. Biol. 14, 185–193 (2007). - PMC - PubMed
    1. Jia R., Li C., McCoy J. P., Deng C. X. & Zheng Z. M. SRp20 is a proto-oncogene critical for cell proliferation and tumor induction and maintenance. Int. J. Biol. Sci. 6, 806–826 (2010). - PMC - PubMed

Publication types

MeSH terms

Substances