. 2016 Nov 3:6:35962.
doi: 10.1038/srep35962.

Improving virus production through quasispecies genomic selection and molecular breeding

Affiliations

Improving virus production through quasispecies genomic selection and molecular breeding

Francisco J Pérez-Rodríguez et al. Sci Rep. .

Abstract

Virus production still is a challenging issue in antigen manufacture, particularly with slow-growing viruses. Deep-sequencing of genomic regions indicative of efficient replication may be used to identify high-fitness minority individuals suppressed by the ensemble of mutants in a virus quasispecies. Molecular breeding of quasispecies containing colonizer individuals, under regimes allowing more than one replicative cycle, is a strategy to select the fittest competitors among the colonizers. A slow-growing cell culture-adapted hepatitis A virus strain was employed as a model for this strategy. Using genomic selection in two regions predictive of efficient translation, the internal ribosome entry site and the VP1-coding region, high-fitness minority colonizer individuals were identified in a population adapted to conditions of artificially-induced cellular transcription shut-off. Molecular breeding of this population with a second one, also adapted to transcription shut-off and showing an overall colonizer phenotype, allowed the selection of a fast-growing population of great biotechnological potential.


Figures

Figure 1
Figure 1. Genomic selection based on fragments belonging to IRES and VP1 regions.
(a) Predicted secondary structure of the HAV IRES. In red the second polypyrimidine tract (pY2). (b) RCDI of the capsid-coding region. (c) Percent of haplotypes detected in the IRES fragment of populations F0.05LA and F0.2LA. (d) Percent of haplotypes detected in the VP1 fragment of populations F0.05LA and F0.2LA. (e) Alternative secondary structure predicted in several IRES haplotypes. In red pY2. Blue circles indicate the replacements found in ɸ16 haplotype. (f) RCDI values of the VP1 haplotypes. Red line corresponds to the haplotype whose sequence coincides with the consensus. (g) IRES activity figured as the mean and standard error of the FLuc/RLuc ratio of different haplotype-derived vectors compared to the ancestor L0 type. Three different experiments, including two replicas each, for each haplotype were performed. Statistically significant differences (P < 0.05; Student’s t-test) between haplotypes are indicated by different letters: a ≠ b, a ≠ c, b ≠ c, ab = a, ab = b, ab ≠ c. (h) Translation efficiency of different VP1 haplotype-derived vectors under the control of the wild type IRES without or with mutations U359C, U590C and U726C. Values represent the mean and standard error of three different experiments, including two replicas each, for each haplotype. Statistically significant differences (P < 0.05; Student’s t-test) between haplotypes are indicated by different letters: a ≠ b, a ≠ c, b ≠ c, ab = a, ab = b, ab ≠ c. Statistically significant differences (P < 0.05; Student’s t-test) between the non-mutated and mutated IRES, for each haplotype, are indicated by different letters: A ≠ B.
Figure 2
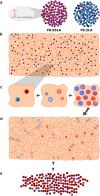
Figure 2. Schematic representation of the process of genomic selection and molecular breeding.
(a) Viral quasiespecies may contain low frequency high-fitness individuals suppressed by the ensemble of mutants (as the amplified genome from F0.05LA quasiespecies representing a ɸ16-λ5 individual). (b) Molecular breeding of quasispecies may be used to rescue these high-fitness variants. Using a moderate MOI, a proportion of cells will remain uninfected while another proportion will be coinfected with more than one virus particle. (c) In cells coinfected with two different colonizer viruses, a synchronization of their replicative cycles may occur. In our case, coinfection with F0.2LA and ɸ16-λ5 colonizer individuals, showing fast uncoating time and effective IRES/fast translation, respectively, may result in the emergence of fast chimeric viruses with interchanged capsids and genomes. (d) Some of these fast chimeric particles will be able to efficiently infect new cells. (e) Finally, the best competitor between both colonizers will be selected (ɸ16-λ5 individuals).
Figure 3
Figure 3. Selection of ɸ16-λ5 haplotype through molecular breeding between F0.05LA and F0.2LA populations.
(a) Correlation between the initial proportion of F0.2LA population and the virus titers produced. R is the correlation coefficient and P the level of significance. (b) Evolution of a genetic marker of F0.2LA population (1298U in VP0 gene) over passages in the molecular breeding experiments 100:1, 1:1 and 1:100. (c) Evolution of virus production and emergence of U359C (●), U590C (○) and U726C (▼) IRES replacements over passages in the molecular breeding experiments 100:1, 1:1 and 1:100. A non-linear logarithmic regression between virus production per cell and passages is shown; the black line represents the regression line and the blue lines represent the 95% confidence levels. R is the correlation coefficient and P the level of significance. (d) Proportion of haplotypes detected in the IRES fragment of the p30 of the 1:1 (F0.05LA:F0.2LA) breed. (e) Proportion of haplotypes detected in the VP1 fragment of the p30 of the 1:1 (F0.05LA:F0.2LA) breed.
Figure 4
Figure 4. Genomic and biological features of the HM175-HP population.
(a) Mutation landscape, of the 5′NCR and VP1 fragments under study, of populations F0.05LA (black) and HM175-HP (red). In the 5′NCR 3D plot, the X axis represents the 130 triplets contained in the fragment under analysis, the Y axis represents the 64 possible triplets and the Z axis the frequencies in each population. In the VP1 3D plot, the X axis represents the 139 codons contained in the fragment under analysis, the Y axis represents the 61 coding codons and the Z axis the frequencies in each population. (b) One-step growth curves of the HM175-HP, F0.05LA and F0.2LA (parental types) and L0 (ancestor) populations. Three different experiments, titrated in duplicated, were performed. Figures represent the mean and standard error. (c) Plaques of the L0, F0.05LA, F0.2LA and HM175-HP populations.

References

    1. Lemon S. M., Whetter L., Chang K. H. & Brown E. A. Why do human hepatitis viruses replicate so poorly in cell cultures. FEMS Microbiol. Lett. 79, 455–459 (1992). - PubMed
    1. Brown E. A., Zajac A. J. & Lemon S. M. In vitro characterization of an internal ribosomal entry site (IRES) present within the 5′ nontranslated region of hepatitis A virus RNA: comparison with the IRES of encephalomyocarditis virus. J. Virol. 68, 1066–1074 (1994). - PMC - PubMed
    1. Whetter L. E., Day S. P., Elroystein O., Brown E. A. & Lemon S. M. Low efficiency of the 5′ nontranslated region of hepatitis A virus RNA in directing cap-independent translation in permissive monkey kidney cells. J. Virol. 68, 5253–5263 (1994). - PMC - PubMed
    1. Ali I. K., McKendrick L., Morley S. J. & Jackson R. J. Activity of the Hepatitis A Virus IRES Requires Association between the Cap-Binding Translation Initiation Factor (eIF4E) and eIF4G. J. Virol. 75, 7854–7863 (2001). - PMC - PubMed
    1. Sánchez G., Bosch A. & Pintó R. M. Genome variability and capsid structural constraints of hepatitis A virus. J. Virol. 77, 452–459 (2003). - PMC - PubMed

Publication types