. 2016 Nov 3:6:36328.
doi: 10.1038/srep36328.

α-Synuclein enhances histone H3 lysine-9 dimethylation and H3K9me2-dependent transcriptional responses

Affiliations

α-Synuclein enhances histone H3 lysine-9 dimethylation and H3K9me2-dependent transcriptional responses

Naoto Sugeno et al. Sci Rep. .

Abstract

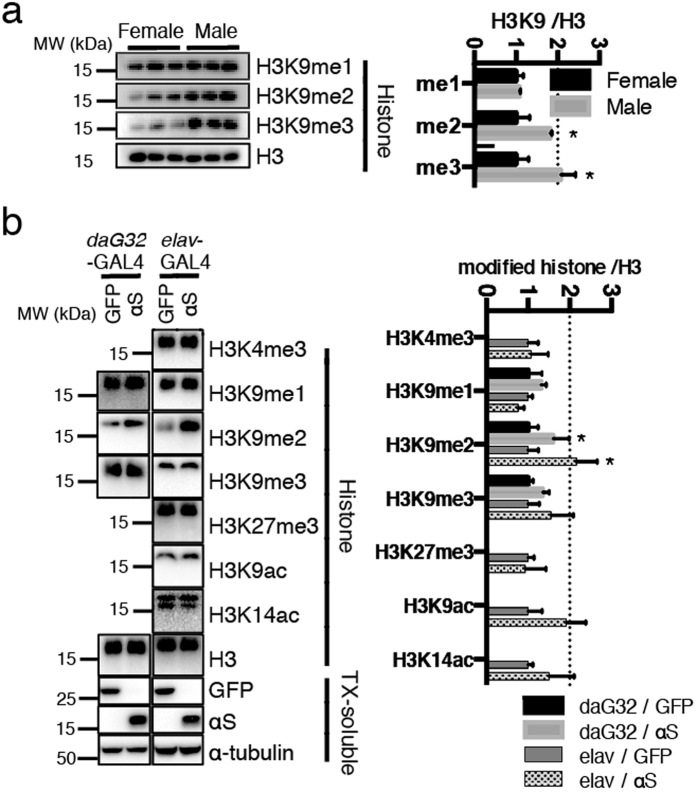
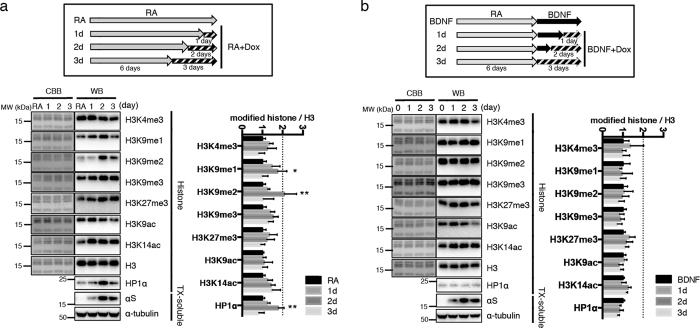
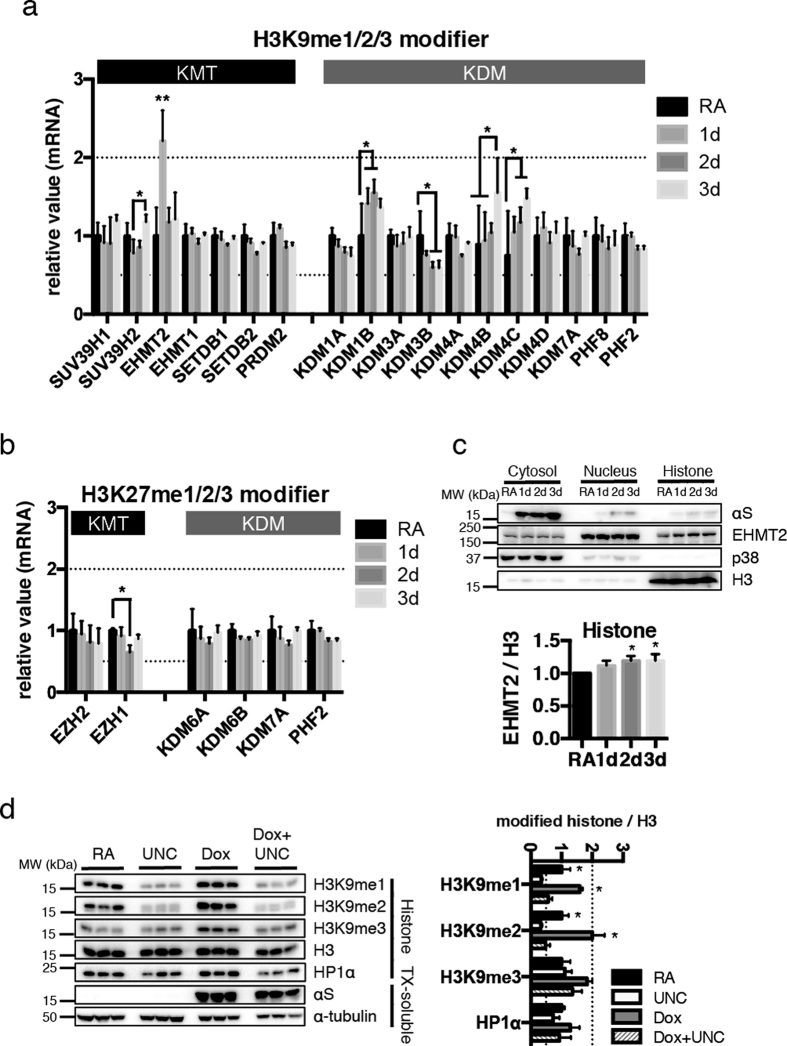
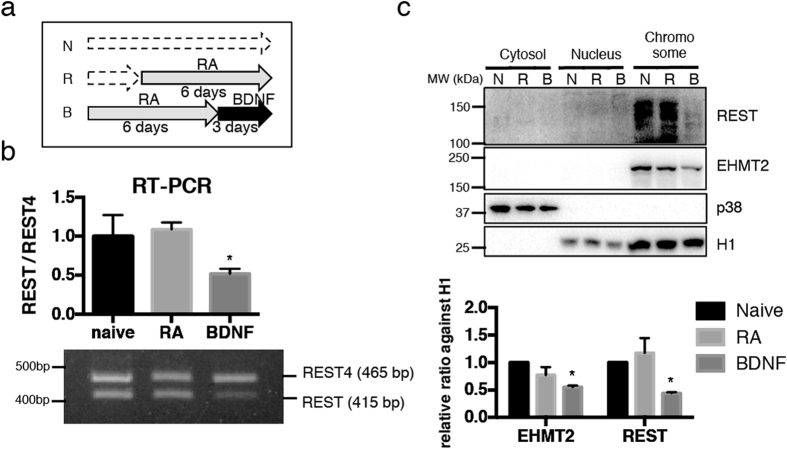
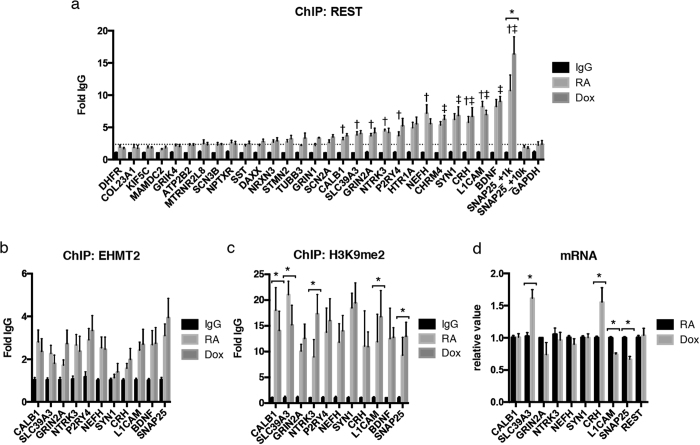
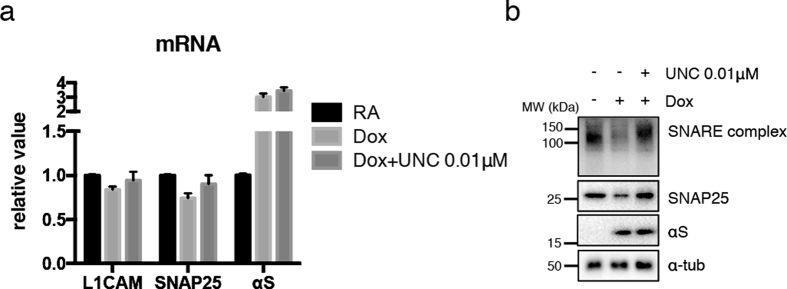
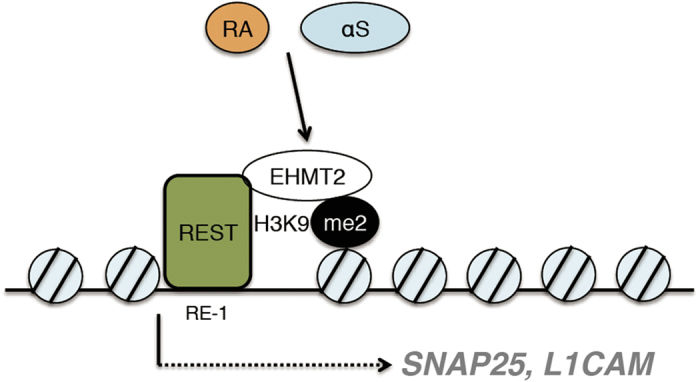
α-Synuclein (αS) is a protein linked to Parkinson's disease (PD) and related neurodegenerative disorders. It is mostly localized within synapses, but αS has also been suggested to play a role in the nucleus. We used transgenic Drosophila and inducible SH-SY5Y neuroblastoma cells to investigate the effects of αS on chromatin with a particular focus on histone modifications. Overexpression of αS in male flies as well as in retinoic acid pre-treated neuroblastoma cells led to an elevation of histone H3K9 methylations, mostly mono- (H3K9me1) and di- (H3K9me2). The transient increase of H3K9 methylation in αS-induced SH-SY5Y cells was preceded by mRNA induction of the euchromatic histone lysine N-methyltransferase 2 (EHMT2). EHMT2 and H3K9me2 can function within the REST complex. Chromatin immunoprecipitation (ChIP) analyses of selected candidate, REST regulated genes showed significantly increased H3K9me2 promoter occupancy of genes encoding the L1CAM cell adhesion molecule and the synaptosomal-associated protein SNAP25, whose reduced expression levels were confirmed by RT-qPCR in αS induced cells. Treatment with EHMT inhibitor UNC0638 restored the mRNA levels of L1CAM and SNAP25. Thus, αS overexpression enhances H3K9 methylations via ΕΗΜΤ2 resulting in elevated H3K9me2 at the SNAP25 promoter, possibly affecting SNARE complex assembly and hence synaptic vesicle fusion events regulated by αS.


Figures

Figure 1
Figure 1. Analyses of modified histones in Drosophila melanogaster.
Histones were extracted from 15 fly head tissues. Then, 3 different samples from each group were subjected to SDS-PAGE and Western blot analysis. (a) H3K9me2 and H3K9me3, representative marks of heterochromatin, were more prominent in males. *P < 0.05 by Sidak after Two-way ANOVA against female (n = 3). The result was shown as mean ± SEM. (b) Histones and Triton X-100 (TX) soluble fractions were analyzed by Western blotting. Green fluorescence protein (GFP) expressing flies are compared to αS transgenic Drosophila. Western blots from histone fractions of ubiquitous daG32-GAL4 driven transgenic male flies were probed for mono-methylated (H3K9me1), di-methylated (H3K9me2), tri-methylated (H3K9me3) as well as total histone H3. In addition to the aforementioned probings, the histone fractions from neuron-specific elav-GAL4 driven flies were probed for H3 tri-methylated at lysine-4 (H3K4me3) and lysine-27 (H3K27me3), as well as H3 acetylated at lysine-9 (H3K9ac) and lysine-14 (H3K14ac). Transgenic expressions of GFP and αS were confirmed in the whole lysates (TX-soluble), as well as α-tubulin as loading control. Band intensities were quantified by densitometric scanning; *P < 0.05 by Sidak after two-way ANOVA against GFP. The result was shown as mean ± SEM.
Figure 2
Figure 2. Histone modifications in SH-SY5Y cells.
Western blots are presented in ‘WB’ columns, and Coomassie Brilliant Blue stained gels after the transfer are shown in ‘CBB’ columns. (a) Inducible αS expressing cells were treated with 10 nM RA in medium supplemented with 3% fetal bovine serum for 6 days followed by the addition of doxycycline (Dox). After further incubation for 1–3 days, histones and Triton X-100 (TX)-soluble fractions were analyzed by Western blotting. After two days induction of αS, levels of H3K9me1, H3K9me2 and HP1α were significantly elevated. *P < 0.01 by Sidak after Two-way ANOVA against 0 day; **P < 0.001 against 0, 1 and 3 day (n = 9). The result was shown as mean ± SEM. The experiments were repeated six times. (b) Cells were treated with 10 nM RA for 6 days, then further incubated with 50 ng/ml BDNF for 3 days with αS induction (0–3 days). Histones and TX-soluble fractions were subjected to Western blotting. No significant changes were observed by Sidak after Two-way ANOVA (n = 7). The result was shown as mean ± SEM. The experiments were repeated three times.
Figure 3
Figure 3. Analyses for histone modifying enzymes.
(a,b) Cells were collected after RA pretreatment and doxycycline induction of αS for 1–3 days, as in Fig. 2a. Total mRNA was extracted, reverse transcribed and the obtained cDNA was analyzed by PCR using specific primer pairs (see Supplementary Table S1). (a) EHMT2 was significantly upregulated at the first day of αS induction. Less prominently, KDM1B, KDM4B, and KDM4C were increased and KDM3B was decreased, but mostly at later time points trailing the observed H3K9 methylation changes. *P < 0.05; **P < 0.005 by Sidak after Two-way ANOVA (n = 4). The result was shown as mean ± SEM. (b) EZH1 mRNA levels were mildly decreased after two days of αS induction. *P < 0.05 by Sidak after Two-way ANOVA (n = 4). The result was shown as mean ± SEM. (c) Cells were fractionated into cytosol, nucleus, and histone rich fraction, then EHMT2 protein levels were determined by Western blotting. p38 was used as a marker for cytosolic fraction, and H3 for histone. EHMT2 showed mild but significant increase in the histone fraction upon αS induction. *P < 0.01 against naive by Dunett after one-way ANOVA (n = 4). The result was shown as mean ± SEM. (d) After six days incubation with RA and αS induction by doxycycline, where indicated, some cells were further treated with 5 μM UNC0638, EHMT inhibitor. Histone and TX-soluble fractions were prepared and probed for the lysine-9 methylated forms and total H3 as well as HP1α. Induction of αS was confirmed in the TX-soluble fraction, as well as α-tubulin as loading control. *P < 0.005 against RA with UNC, or Dox with UNC by Sidak after Two-way ANOVA (n = 3 as shown). The result was shown as mean ± SEM. The experiments were repeated three times.
Figure 4
Figure 4. Alteration of REST expression levels during differentiation of SH-SY5Y cells.
(a) SH-SY5Y cells were treated with 10 nM RA supplemented with 3% FCS for 0 (N: naive) to 6 days (R: RA) followed by 50 ng/mL of BDNF (B: BDNF). (b) REST transcripts were analyzed using primer pairs, which amplify both full length REST (415 bp) and non-functional splicing variant REST4 (465 bp). REST levels against REST4 were significantly decreased after BDNF treatment. *P < 0.01 against naive by Dunett after one-way ANOVA (n = 5). The result was shown as mean ± SEM. (c) Cells were divided into cytosol, nucleus, and chromosome-rich fraction. REST and EHMT2 protein levels were determined by Western blotting. p38 was used as a marker for cytosolic fraction, and H1 was nucleus and chromosome. *P < 0.01 against 0d by Sidak after Two-way ANOVA (N = 3). The result was shown as mean ± SEM. The experiments were repeated three times.
Figure 5
Figure 5. Identification of H3K9me2 target genes.
(a) αS-inducible SH-SY5Y cells were treated with RA for 7 days, followed by αS induction with or without Doxycycline for two days (Dox or RA). Known REST-regulated genes were analyzed by chromatin immuoprecipitation (ChIP) using anti-REST antibodies. Eleven genes were significantly occupied with REST compared with GAPDH. P < 0.05, RA against RA of GAPDH, P < 0.05, Dox against Dox of GAPDH by Dunn’s multiple comparison test after non-parametric one-way ANOVA (n = 4). After induction of αS, binding property of REST to RE1 of SNAP25 (SNAP25_+1k) was significantly potentiated. *P < 0.05 by Sidak after two-way ANOVA (n = 4). IgG: IgG control; RA: cells treated with RA for 9 days. (b) ChIP analyses by EHMT2. Chromatin was obtained from same condition as (a). (c) ChIP analyses by H3K9me2. In the presence of αS, NTRK3, L1CAM, and SNAP25 genes were highly occupied with H3K9me2. *P < 0.05 by Sidak after two-way ANOVA (n = 4). (d) RT-PCR analysis of mRNA expression under the same conditions as above was performed. Transcripts levels of L1CAM and SNAP25 were significantly decreased after αS induction. *P < 0.05 by Sidak after two-way ANOVA (n = 5). The result was shown as mean ± SEM.
Figure 6
Figure 6. The effect of low dose EHMT inhibitior in αS-mediated mRNA and protein reduction.
(a) αS-inducible SH-SY5Y cells were treated with RA for 7 days, then further cultured with or without Dox for 2 days (Dox or RA). Additional treatment with 0.01 μM of UNC0638 (Dox+UNC 0.01 μM) alleviated the suppressed mRNA expression of L1CAM and SNAP25. (b) Samples for Western blotting were collected in same condition as (a). Decreased protein levels of SNAP25 were recovered after adding EHMT inhibitor, UNC0638. Higher molecular SNAP25-immunopositive bands representing SNARE complex went along with SNAP25 monomer bands.
Figure 7
Figure 7. Graphical abstract.
In the presence of RA, in part of EHMT2 level is positively regulated by αS. Cooperative with transcription factor REST, which directly binds to target gene promoter at RE-1, EHMT2 catalyzes di-methylation (me2) of H3K9 resulting in repression of SNAP25 and L1CAM transcription.

References

    1. Spillantini M. G. et al.. α-Synuclein in Lewy bodies. Nature 388, 839–840, doi: 10.1038/42166 (1997). - DOI - PubMed
    1. Polymeropoulos M. H. et al.. Mutation in the alpha-synuclein gene identified in families with Parkinson’s disease. Science 276, 2045–2047 (1997). - PubMed
    1. Eriksen J. L., Dawson T. M., Dickson D. W. & Petrucelli L. Caught in the act: alpha-synuclein is the culprit in Parkinson’s disease. Neuron 40, 453–456 (2003). - PubMed
    1. Satake W. et al.. Genome-wide association study identifies common variants at four loci as genetic risk factors for Parkinson’s disease. Nat Genet 41, 1303–1307, doi: 10.1038/ng.485 (2009). - DOI - PubMed
    1. Simon-Sanchez J. et al.. Genome-wide association study reveals genetic risk underlying Parkinson’s disease. Nat Genet 41, 1308–1312, doi: 10.1038/ng.487 (2009). - DOI - PMC - PubMed

Publication types