. 2016 Nov 3;7(11):e2445.
doi: 10.1038/cddis.2016.322.

Inhibition of autophagy increased AGE/ROS-mediated apoptosis in mesangial cells

Affiliations

Inhibition of autophagy increased AGE/ROS-mediated apoptosis in mesangial cells

Li Xu et al. Cell Death Dis. .

Abstract

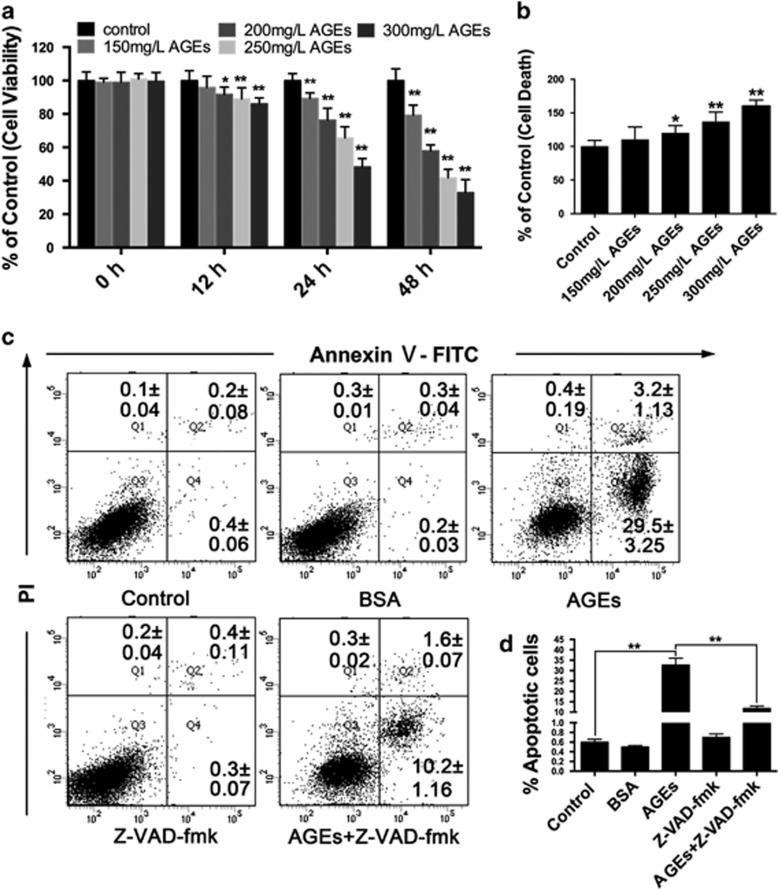
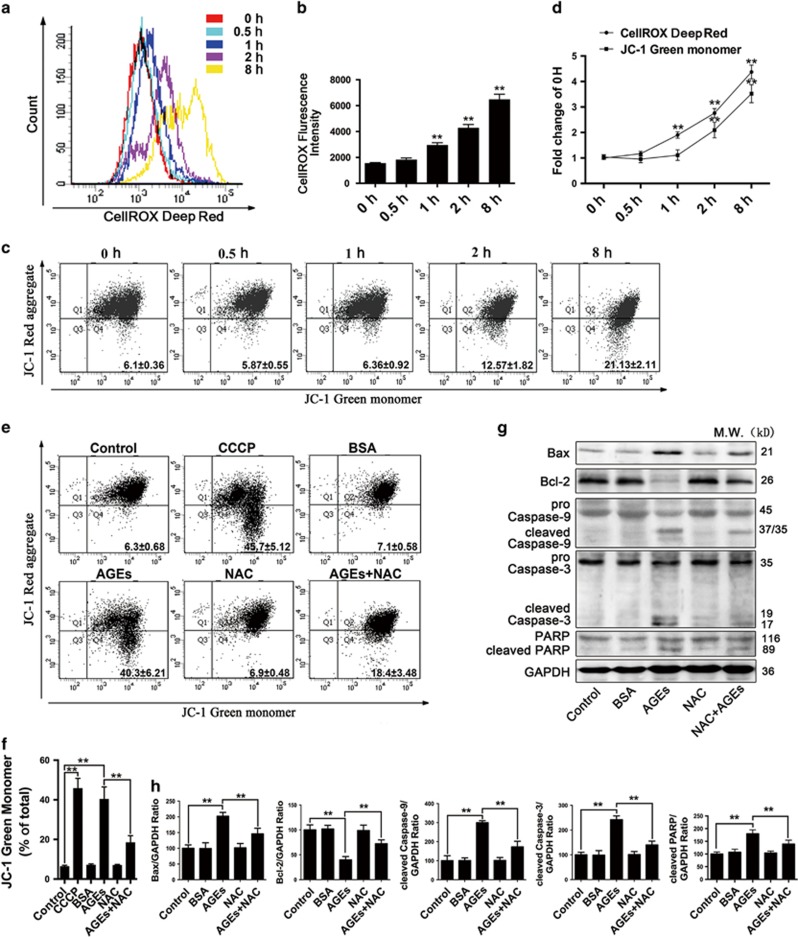
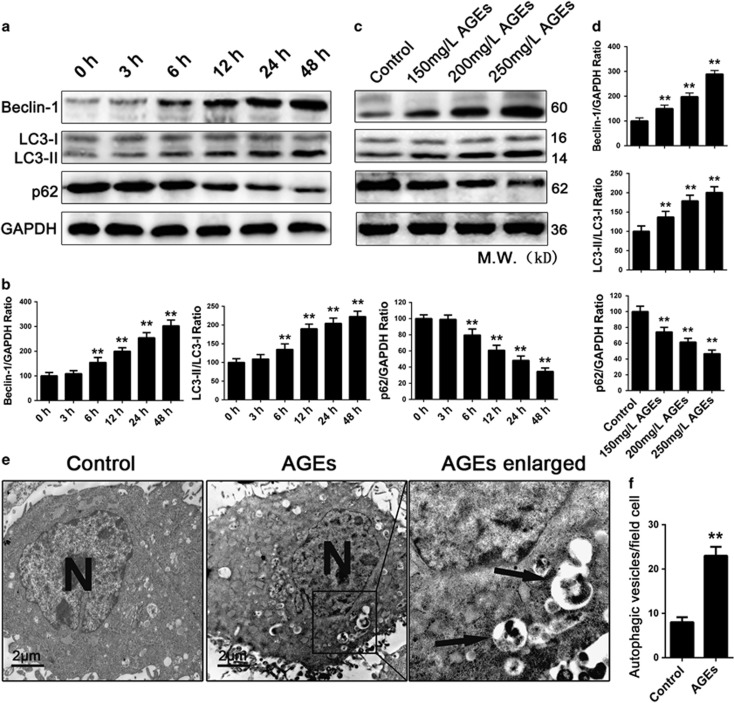
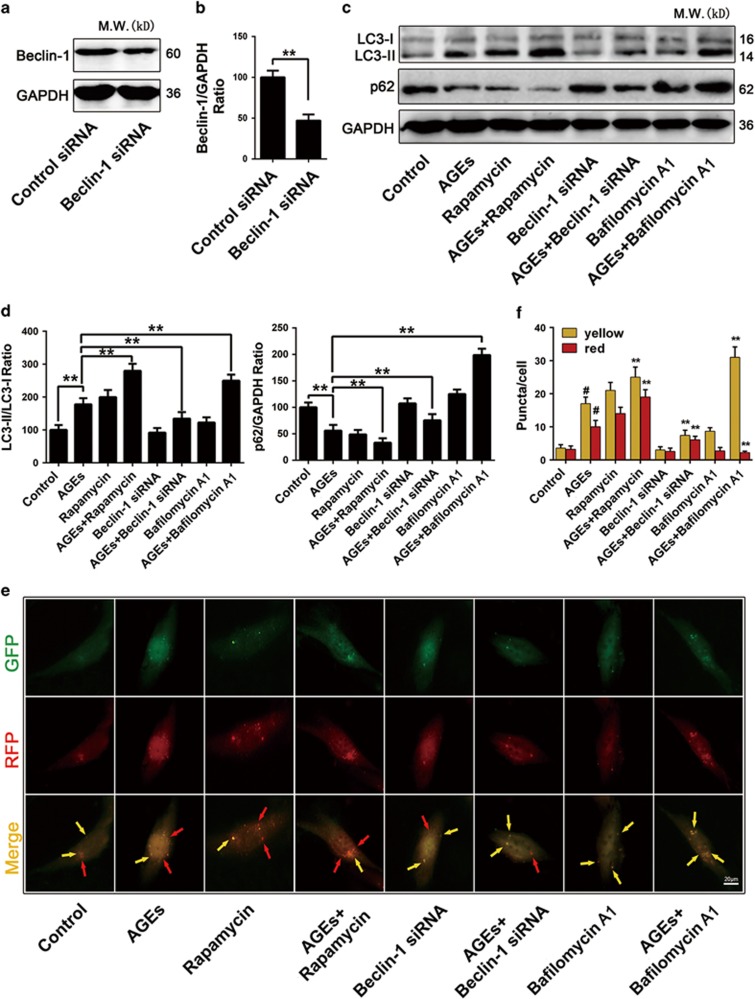
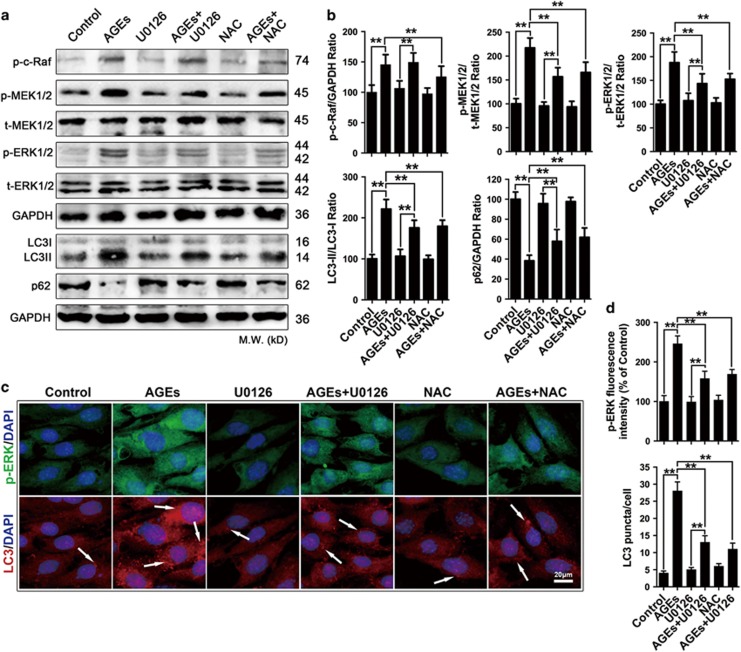
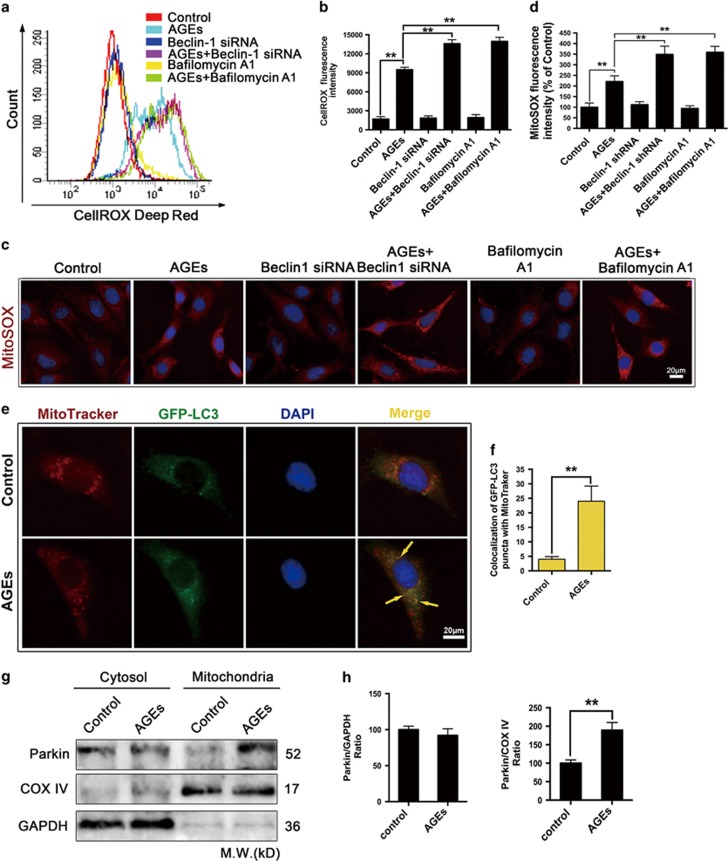
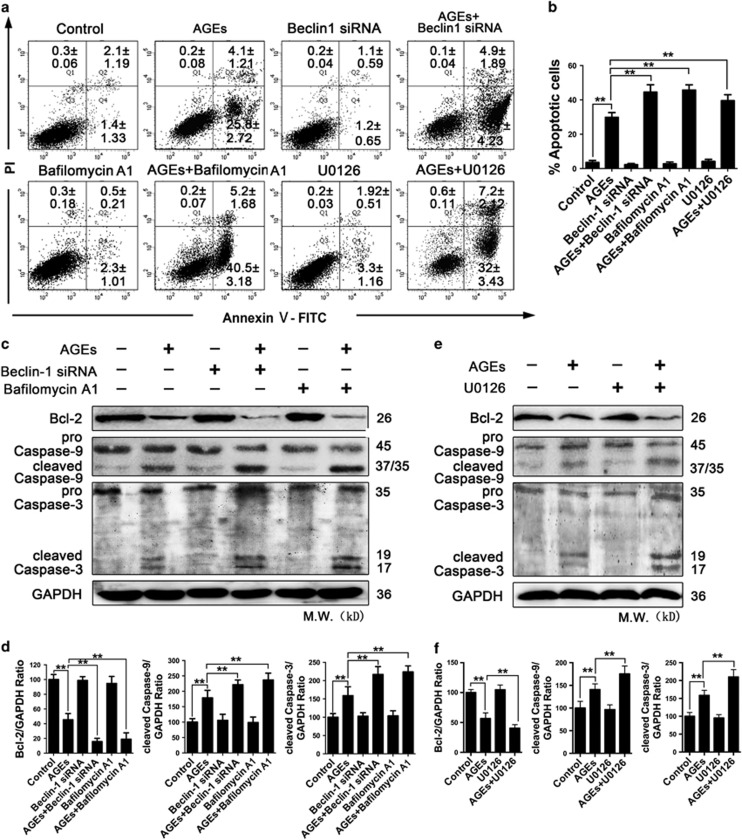
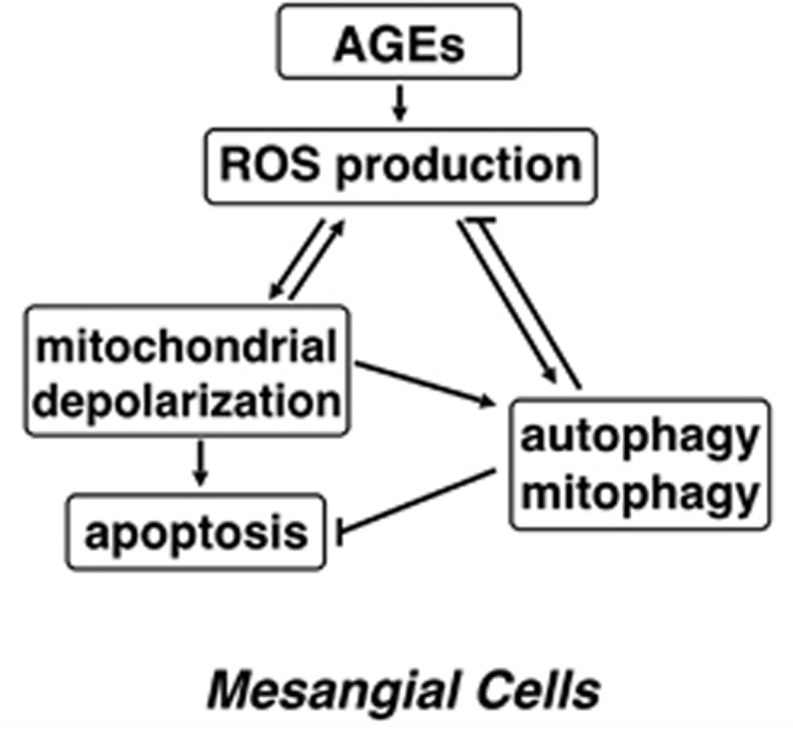
The aim of our study was to investigate the role of autophagy, a homeostatic process involved in the lysosomal degradation of damaged cell organelles and proteins, in regulating the survival of mesangial cells treated with advanced glycation end products (AGEs). In the present study, AGEs induced mitochondrial depolarization and led to mitochondrial-dependent apoptosis in mesangial cells, as shown by the loss of the mitochondrial membrane potential; increased Bax processing; increased Caspase-9, Caspase-3 and PARP cleavage; and decreased Bcl-2 expression. Meanwhile, AGEs also triggered autophagy flux in mesangial cells, as confirmed by the presence of autophagic vesicles, the conversion of LC3II/LC3I and the increase/decrease in Beclin-1/p62 expression. Interestingly, this study reported apparent apoptosis and autophagy that were dependent on reactive oxygen species (ROS) production. Scavenging ROS with N-acetyl-l-cysteine could prevent the appearance of the autophagic features and reverse AGE-induced apoptosis. Moreover, AGE-triggered mitophagy, which was confirmed by the colocalization of autophagosomes and mitochondria and Parkin translocation to mitochondria, played a potential role in reducing ROS production in mesangial cells. Additionally, inhibition of autophagy significantly enhanced AGE-induced cell apoptosis. Taken together, our data suggest that ROS were the mediators of AGE-induced mesangial cell apoptosis and that autophagy was likely to be the mechanism that was triggered to repair the ROS-induced damage in the AGE-treated cells and thereby promote cell survival. This study provides new insights into the molecular mechanism of autophagy involved in AGE-induced apoptosis in mesangial cells.


Figures

Figure 1
Figure 1
AGEs induced apoptosis in mesangial cells. (a) Cells were treated with various concentrations of AGEs (150–300 mg/l) for 0, 12, 24 or 48 h, and cell viability was estimated using the MTT assay. The data are presented as the mean±S.E.M. from at least three independent experiments. *P<0.05 versus Control, **P<0.01 versus Control. (b) Cells were treated with various concentrations of AGEs (150–300 mg/l) for 24 h. Cell death was estimated using a cell death detection ELISAPLUS assay. The data are presented as the mean±S.E.M. from at least three independent experiments. *P<0.05 versus Control, **P<0.01 versus Control. (c) Cells were pre-treated with or without Z-VAD-fmk (25 μM) and incubated with AGEs (250 mg/l) for 24 h. Cell apoptosis was detected using the annexin V-FITC/PI kit. Viable cells (annexin V/PI), early apoptotic cells (annexin V+/PI), late apoptotic cells and necrotic cells (annexin V+/PI+) are located in the bottom left, bottom right and top right quadrants, respectively. The numbers in each quadrant represent the percentage of cells. The data are presented as the mean±S.E.M. from at least three independent experiments. (d) Percentages of apoptotic cells in each group. The data are presented as the mean±S.E.M. from at least three independent experiments. **P<0.01
Figure 2
Figure 2
AGEs caused ROS-mediated mitochondrial depolarization and led to mitochondrial-dependent apoptosis in mesangial cells. (ad) Cells were treated with AGEs (250 mg/l) for 0, 0.5, 1, 2 and 8 h. (a) The ROS levels were assessed by determining CellROX Deep Red fluorescence intensity via flow cytometry. (b) Quantitative analysis of fluorescence intensity. The data are presented as the mean±S.E.M. from at least three independent experiments. **P<0.01 versus 0 h. (c) The level of MMP was determined by flow cytometric analysis of the JC-1 dye. The numbers in each quadrant represent the green (monomer) fluorescence ratio. The data are presented as the mean±S.E.M. from at least three independent experiments. (d) Time-kinetics analysis of (a) and (b). The data are presented as the mean±S.E.M. from at least three independent experiments. **P<0.01 versus 0 h. (eh) Cells were pre-treated with or without NAC (5 mM) and then incubated with AGEs (250 mg/l) for 24 h. (e) The level of MMP was determined by flow cytometric analysis of the JC-1 dye. CCCP, a mitochondrial membrane potential disrupter, was used as a positive control. The numbers in each quadrant represent the green (monomer) fluorescence ratio. The data are presented as the mean±S.E.M. from at least three independent experiments. (f) Quantification of JC-1 green fluorescence. The data are presented as the mean±S.E.M. from at least three independent experiments. **P<0.01. (g) Western blot analysis of Bax, Bcl-2, Caspase-9, Caspase-3 and PARP expression in each group. (h) Quantitative analysis of Bax, Bcl-2, cleaved Caspase-9, cleaved Caspase-3 and cleaved PARP protein expression. The data are presented as the mean±S.E.M. from at least three independent experiments. **P<0.01
Figure 3
Figure 3
AGEs affected the expression of autopaghy-related proteins and promoted the formation of autophagic vesicles in mesangial cells. (a) Western blot analysis of Beclin-1, LC3II/LC3I and p62 protein levels in mesangial cells treated with 250 mg/l AGEs for 0, 3, 6, 12, 24, 48 h. (c) Western blot analysis of Beclin-1, LC3II/LC3I and p62 protein levels in mesangial cells treated with various concentrations of AGEs (150–250 mg/l) for 24 h. (b and d) Quantitative analysis of Beclin-1, LC3II/LC3I and p62 protein expression. The data are presented as the mean±S.E.M. from at least three independent experiments. **P<0.01 versus 0 h or Control. (e) Transmission electron microscopy showed autophagic vesicles (bold arrows) in cells that had been treated with 250 mg/l AGEs for 24 h. Bar=2 μm. (f) Quantification of the autophagic vesicles in 10 randomly selected cells. The data are presented as the mean±S.E.M. **P<0.01 versus Control
Figure 4
Figure 4
Autophagy flux measurements in AGE-treated mesangial cells. (a) Western blot analysis of Beclin-1 protein levels in mesangial cells that were transiently transfected with control siRNA or Beclin-1 siRNA for 24 h. (b) Quantitative analysis of Beclin-1 protein expression. The data are presented as the mean±S.E.M. from at least three independent experiments. **P<0.01. (c) Western blot analysis of LC3II/LC3I and p62 protein levels in mesangial cells treated with or without Rapamycin (100 nM), Bafilomycin A1 (10 nM) or Beclin-1 siRNA and incubated with or without AGEs (250 mg/l) for 24 h. (d) Quantitative analysis of LC3II/LC3I and p62 protein expression. The data are presented as the mean±S.E.M. from at least three independent experiments. **P<0.01. (e) Mesangial cells were transiently transfected with the GFP-RFP-LC3 plasmid for 24 h and then further treated with or without Rapamycin (100 nM), Bafilomycin A1 (10 nM) or Beclin-1 siRNA and incubated with AGEs (250 mg/l) for 24 h. Arrowheads: yellow puncta (RFP+/GFP+-LC3 puncta), red puncta (RFP+/GFP-LC3 puncta). Bar=2 μm. (f) The yellow and red puncta were quantified (>20 cells were counted in each experiment, and at least three independent experiments were performed). The data are presented as the mean±S.E.M. #P<0.01 versus control, **P<0.01 versus AGE-treated cells
Figure 5
Figure 5
AGE-induced mesangial cell autophagy was mediated by the ROS/ERK signaling pathway. (ad) Cells were pre-treated with or without U0126 (30 μM) or NAC (5 mM) and incubated with AGEs (250 mg/l) for 24h. (a) Western blot analysis of p-c-Raf, p-MEK1/2, t-MEK1/2, p-ERK1/2 and t-ERK1/2 protein expression levels and autophagy-related protein (LC3II/I and p62) levels in mesangial cells. (b) Quantitative analysis of p-c-Raf, p-MEK1/2, p-ERK1/2, LC3II/I and p62 protein expression levels. The data are presented as the mean±S.E.M. from at least three independent experiments. **P<0.01. (c) LC3/p-ERK expression was assessed by fluorescent microscopy. Arrowhead: LC3 puncta accumulation. Bar=2 μm. (d) Quantitative analysis of p-ERK fluorescence intensity and LC3 puncta. The data are presented as the mean±S.E.M. from at least three independent experiments. **P<0.01
Figure 6
Figure 6
AGEs triggered autophagic clearance of ROS. (ad) Cells were pre-treated with or without Beclin-1 siRNA and Bafilomycin A1 (10 nM) and then incubated with AGEs (250 mg/l) for 24 h. (a) The ROS levels were assessed by determining CellROX Deep Red fluorescence intensity via flow cytometry. (b) Quantitative analysis of the fluorescence intensity. The data are presented as the mean±S.E.M. from at least three independent experiments. **P<0.01. (c) Mitochondrial superoxide accumulation was determined by measuring the MitoSOX Red fluorescent intensity. Bar=2 μm. (d) Quantitative analysis of the mean MitoSOX Red fluorescence (>20 cells were imaged in each experiment, and at least three independent experiments were performed). The data are presented as the mean±S.E.M. **P<0.01. (eh) Cells were treated with AGEs (250 mg/l) for 24 H. (e) Immunofluorescence analysis was used to determine the number of GFP-LC3-positive autophagosomes that colocalized with MitoTracker-labeled mitochondria. Arrowhead: yellow arrows indicate colocalization. Bar=2 μm. (f) Quantitative analysis of GFP-LC3/MitoTracker colocalization as an index of mitophagy (>20 cells were imaged in each experiment, and at least three independent experiments were performed). The data are presented as the mean±S.E.M. **P<0.01. (g) Cytosolic and mitochondrial fractions were isolated from the cells, and Parkin expression was analyzed by western blotting. GAPDH and COX IV were used as loading controls for the cytosolic and mitochondrial fractions, respectively. (h) Quantitative analysis of Parkin protein expression. The data are presented as the mean±S.E.M. from at least three independent experiments. **P<0.01
Figure 7
Figure 7
Inhibition of autophagy aggravated AGE-induced mesangial cell apoptosis. (ad) Cells were pre-treated with or without Beclin-1 siRNA and Bafilomycin A1 (10 nM) and then incubated with AGEs (250 mg/l) for 24h. (a) Cell apoptosis was detected using the annexin V-FITC/PI kit. The numbers in each quadrant represent the percentage of cells. The data are presented as the mean±S.E.M. from at least three independent experiments. (b) Percentages of apoptotic cells in each group. The data are presented as the mean±S.E.M. from at least three independent experiments. **P<0.01. (c) Western blot analysis of Bcl-2, Caspase-9 and Caspase-3 expression in each group. (d) Quantitative analysis of Bcl-2, cleaved Caspase-9 and cleaved Caspase-3 protein expression. The data are presented as the mean±S.E.M. from at least three independent experiments. **P<0.01. (e and f) Cells were pre-treated with or without U0126 (30 μM) and incubated with AGEs (250 mg/l) for 24 h. (e) Western blot analysis of Bcl-2, Caspase-9 and Caspase-3 expression in each group. (f) Quantitative analysis of Bcl-2, cleaved Caspase-9 and cleaved Caspase-3 protein expression. The data are presented as the mean±S.E.M. from at least three independent experiments. **P<0.01
Figure 8
Figure 8
Proposed model depicting the mechanism of action of AGEs in mesangial cells

References

    1. Shi Y, Hu FB. The global implications of diabetes and cancer. Lancet 2014; 383: 1947–1948. - PubMed
    1. Mishra R, Emancipator SN, Kern T, Simonson MS. High glucose evokes an intrinsic proapoptotic signaling pathway in mesangial cells. Kidney Int 2005; 67: 82–93. - PubMed
    1. Hornigold N, Johnson TS, Huang L, Haylor JL, Griffin M, Mooney A. Inhibition of collagen I accumulation reduces glomerulosclerosis by a Hic-5-dependent mechanism in experimental diabetic nephropathy. Lab Invest 2013; 93: 553–565. - PubMed
    1. Yao F, Li Z, Ehara T, Yang L, Wang D, Feng L et al. Fatty Acid-Binding Protein 4 mediates apoptosis via endoplasmic reticulum stress in mesangial cells of diabetic nephropathy. Mol Cell Endocrinol 2015; 411: 232–242. - PubMed
    1. Goh SY, Cooper ME. Clinical review: the role of advanced glycation end products in progression and complications of diabetes. J Clin Endocrinol Metab 2008; 93: 1143–1152. - PubMed

Substances