. 2016 Nov 4;16(1):841.
doi: 10.1186/s12885-016-2864-2.

The expression pattern of matrix-producing tumor stroma is of prognostic importance in breast cancer

Affiliations

The expression pattern of matrix-producing tumor stroma is of prognostic importance in breast cancer

Sofia Winslow et al. BMC Cancer. .

Abstract

Background: There are several indications that the composition of the tumor stroma can contribute to the malignancy of a tumor. Here we utilized expression data sets to identify metagenes that may serve as surrogate marker for the extent of matrix production and vascularization of a tumor and to characterize prognostic molecular components of the stroma.

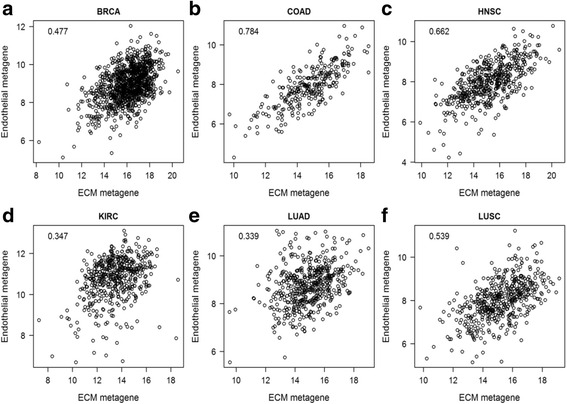
Methods: TCGA data sets from six cancer forms, two breast cancer microarray sets and one mRNA data set of xenografted tumors were downloaded. Using the mean correlation as distance measure compact clusters with genes representing extracellular matrix production (ECM metagene) and vascularization (endothelial metagene) were defined. Explorative Cox modeling was used to identify prognostic stromal gene sets.

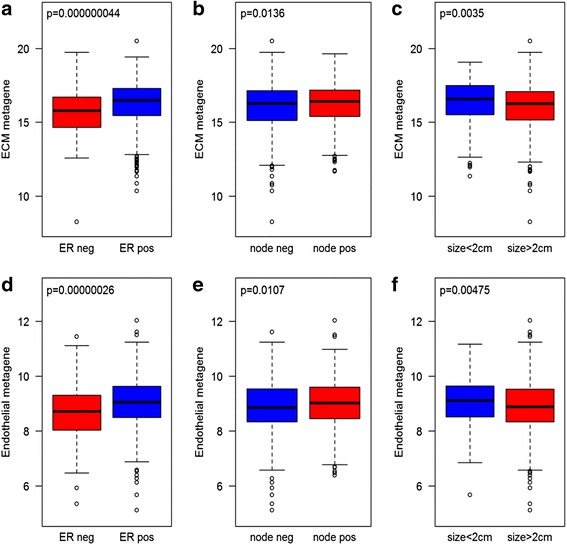
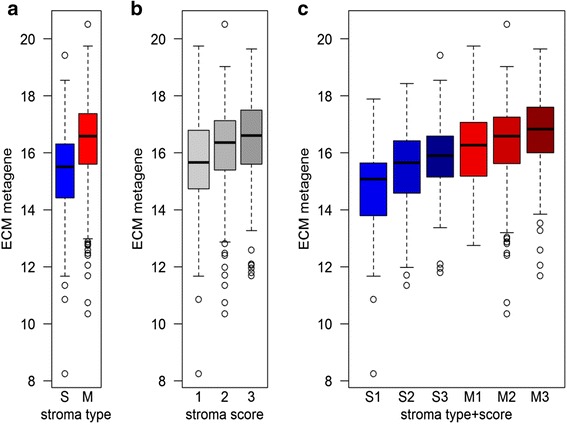
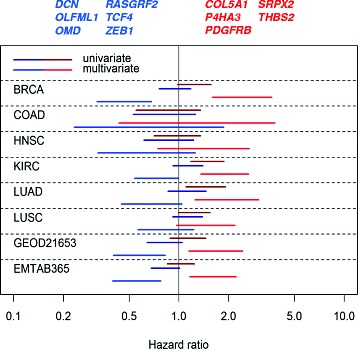
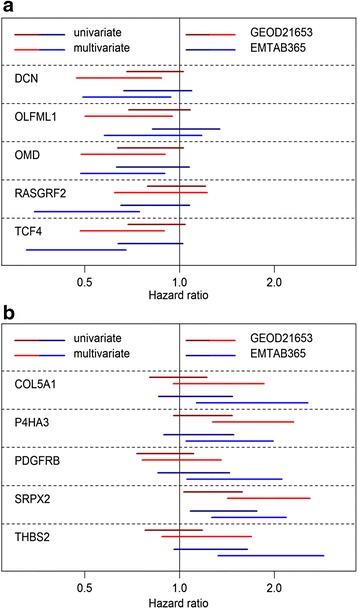
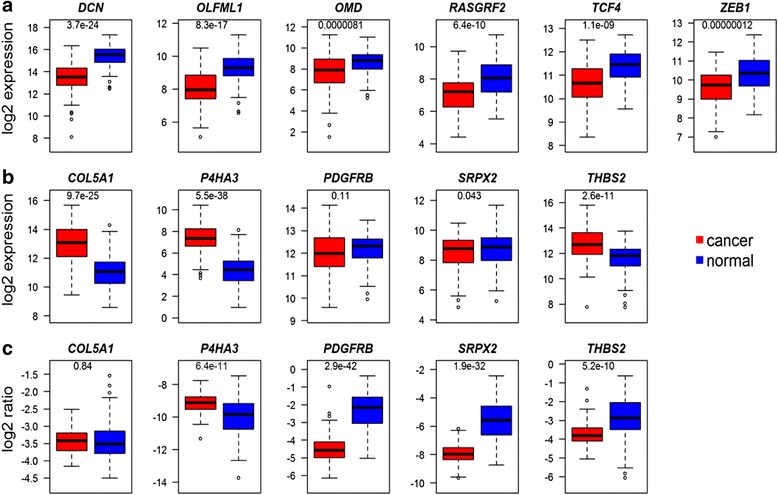
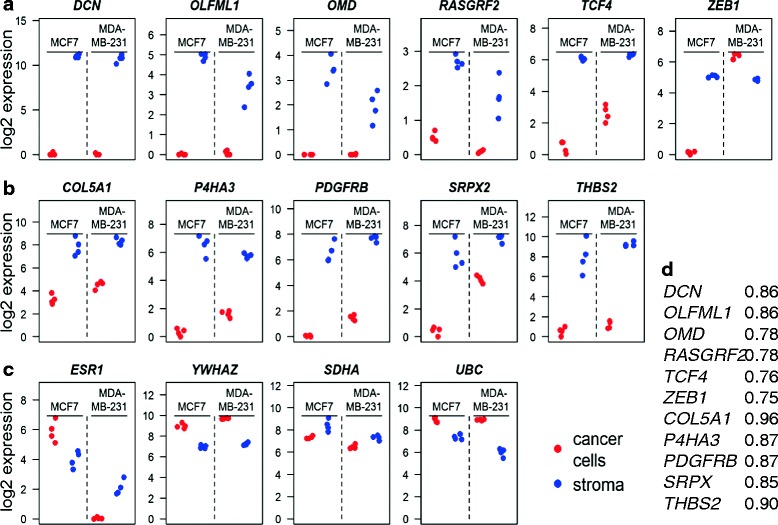
Results: Clustering of stromal genes in six cancer data sets resulted in metagenes, each containing three genes, representing matrix production and vascularization. The ECM metagene was associated with poor prognosis in renal clear cell carcinoma and in lung adenocarcinoma but not in other cancers investigated. Explorative Cox modeling using gene pairs identified gene sets that in multivariate models were prognostic in breast cancer. This was validated in two microarray sets. Two notable genes are TCF4 and P4HA3 which were included in the sets associated with positive and negative prognosis, respectively. Data from laser-microdissected tumors, a xenografted tumor data set and from correlation analyses demonstrate the stroma specificity of the genes.

Conclusions: It is possible to construct ECM and endothelial metagenes common for several cancer forms. The molecular composition of matrix-producing cells, rather than the extent of matrix production seem to be important for breast cancer prognosis.

Keywords: Breast cancer; ECM metagenes; Endothelial metagenes; P4HA3; TCF4; Tumor stroma.


Figures

Fig. 1
Fig. 1
Correlation of ECM and endothelial gene signatures in different cancers. Scatter plots demonstrate mean log2 expression of ECM and endothelial metagenes for individual tumors from the TCGA RNAseq data sets of a breast cancer, b colon cancer, c head and neck cancer, d kidney renal clear cell carcinoma, e lung adenocarcinoma and f lung squamous cell carcinoma. The correlation coefficient is shown in the figure for each data set
Fig. 2
Fig. 2
Expression levels of ECM and endothelial metagene in TCGA breast cancer tumors. Graphs demonstrate mean log2 expression levels of genes in the ECM and endothelial gene signatures in individual tumors grouped according to ER status (a and d), lymph node involvement (b and e), and tumor size (c and f)
Fig. 3
Fig. 3
Expression levels of the ECM metagene in breast cancer tumors related to stroma morphology. The mean log2 expression levels of genes in the ECM gene signature are shown for TCGA breast tumors categorized as predominantly having separated (S) or mixed (M) stromal pattern (a), or based on a score of the total amount of tumor stroma (b). c demonstrates the expression level with respect to both stroma type and stroma score
Fig. 4
Fig. 4
Hazard ratios of gene sets with opposing prognostic association in different cancer data sets. Lines represent confidence intervals (95 %) from multivariate Cox proportional hazard analyses using mean log2 expression of the genes in the prognostic ECM gene signatures (listed on top of the figure) stratifying for age and stage. Red lines and font represent the signature associated with poor prognosis and blue lines and font the signature associated with good prognosis when both signatures are evaluated in a multivariate Cox model. For the TCGA breast cancer (BRCA, which was used for training) and the breast cancer microarray sets (GEOD21653 and EMTAB365) the model was adjusted for node and ER status. The TCGA data sets are colon adenocarcinoma (COAD), head and neck squamous cell carcinoma (HNSC), kidney renal clear cell carcinoma (KIRC), lung adenocarcinoma (LUAD) and lung squamous cell carcinoma (LUSC)
Fig. 5
Fig. 5
Association of individual genes in the prognostic signatures with prognosis in breast cancer microarray sets. The association with prognosis of the expression of individual genes in the good (a) and poor (b) prognosis signatures was analyzed using Cox proportional hazards modeling. Figures demonstrate 95 % confidence interval of the hazard ratio for the standardized log2 mRNA expression of indicated genes in a univariate (dark colors) or multivariate (bright colors) model. In the latter case the aggregated value of the poor prognosis signature (a) or good prognosis signature (b) was used as additional variable in the model
Fig. 6
Fig. 6
Expression of genes in prognostic signatures in breast cancer versus normal tissue. The mRNA levels of the genes in the good (a) and poor (b) prognosis signatures in TCGA breast cancer tumors and normal breast tissue from the same patient. Since the ECM metagene is expressed at higher levels in cancer tissue the levels of the genes in (b) were normalized to the mean log2 value of the ECM metagene (c). The p-value of a t-test comparing the two groups is indicated in each figure
Fig. 7
Fig. 7
Expression of prognostic signature genes in tumor stroma. The mRNA expression data from the xenografted tumors in [22] were downloaded. The RPKM data of a gene was divided by the total sum of RPKM in the sample and multiplied by 100,000. The normalized value was log2 transformed following addition of 1. The resulting values for the genes in the good (a) or poor (b) prognosis in each tumor are depicted. As a comparison, values of selected house-keeping genes or cancer-related genes are shown in (c). The correlation coefficients for each gene in the prognostic signatures with the ECM metagene in TCGA breast cancers are shown in (d)
Fig. 8
Fig. 8
Expression and prognostic association of P4HA gene mRNAs. The expression of P4HA1 and P4HA2 was calculated in the stroma and cancer cells using the xenograft data (a) and in breast cancer and normal breast tissue normalized to the ECM metagene using the TCGA data (b). The P4HA3 data, also shown in Figs. 6 and 7 are included for comparison. Five breast cancer tumors were laser-microdissected and the mRNA levels of indicated genes were analyzed in the cancer cell and stroma compartments (c). The correlation coefficients of P4HA1, P4HA2, and P4HA3 with the ECM metagene in six different TCGA cancer sets were calculated (d). The hazard ratios of the standardized log2 mRNA expression of the P4HA genes were estimated using Cox proportional hazards model (e). The lines indicate 95 % confidence intervals of the hazard ratios in univariate models (dark colors) or multivariate models (bright colors) in which the standardized ECM metagene was included as variable. All models were stratified for node and ER status

Similar articles

Cited by

References

    1. Kumar S, Weaver VM. Mechanics, malignancy, and metastasis: the force journey of a tumor cell. Cancer Metastasis Rev. 2009;28:113–27. doi: 10.1007/s10555-008-9173-4. - DOI - PMC - PubMed
    1. Lu P, Weaver VM, Werb Z. The extracellular matrix: a dynamic niche in cancer progression. J Cell Biol. 2012;196:395–406. doi: 10.1083/jcb.201102147. - DOI - PMC - PubMed
    1. Seewaldt V. ECM stiffness paves the way for tumor cells. Nat Med. 2014;20:332–3. doi: 10.1038/nm.3523. - DOI - PubMed
    1. Walker RA. The complexities of breast cancer desmoplasia. Breast Cancer Res. 2001;3:143–5. doi: 10.1186/bcr287. - DOI - PMC - PubMed
    1. Tlsty TD, Hein PW. Know thy neighbor: stromal cells can contribute oncogenic signals. Curr Opin Genet Dev. 2001;11:54–9. doi: 10.1016/S0959-437X(00)00156-8. - DOI - PubMed

Publication types