

Immunological profiling of patients with ulcerative colitis leads to identification of two inflammatory conditions and CD1a as a disease marker
- PMID: 27809916
- PMCID: PMC5094062
- DOI: 10.1186/s12967-016-1048-9
Immunological profiling of patients with ulcerative colitis leads to identification of two inflammatory conditions and CD1a as a disease marker
Abstract
Background: Conventional approaches to understand mechanisms underlying the development of pathological manifestations in ulcerative colitis (UC) mostly rely on identification of certain cell types and cytokines followed by verification of their roles in vitro and in vivo. In light of the highly dynamic processes in UC, requiring the cross talk of immune cells, epithelial-, endothelial-, muscle cells and fibrocytes, this approach might neglect temporal and spatial connectivity of individually differing inflammatory responses.
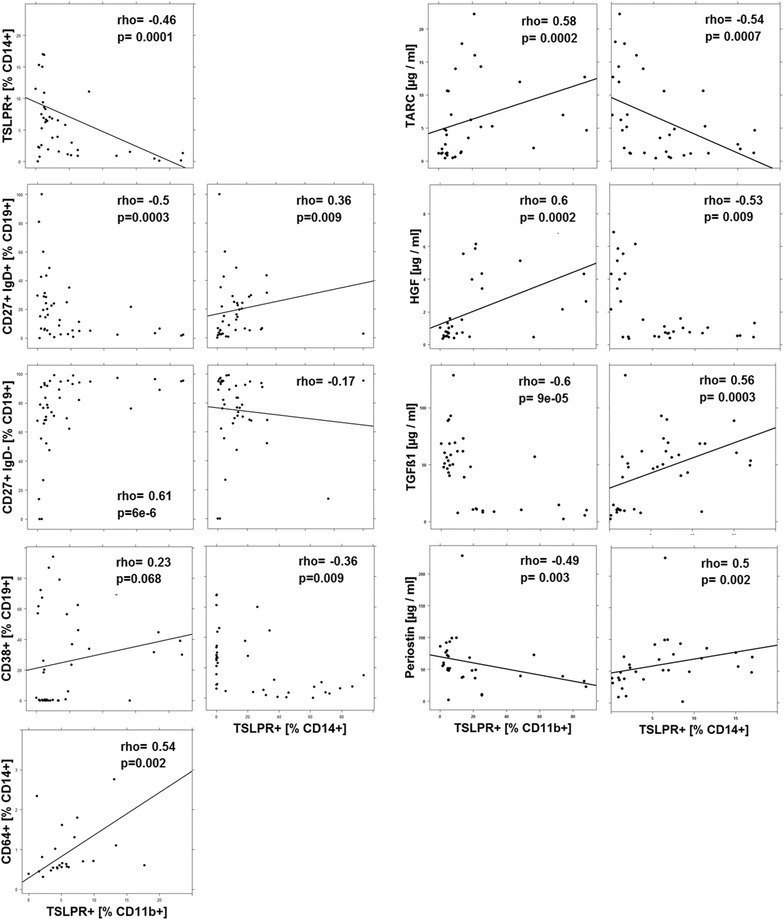
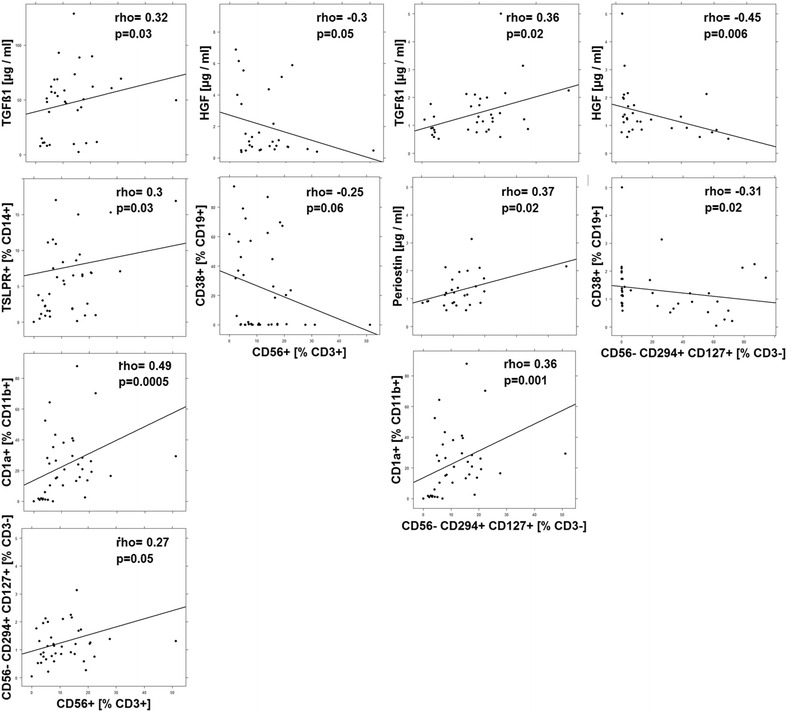
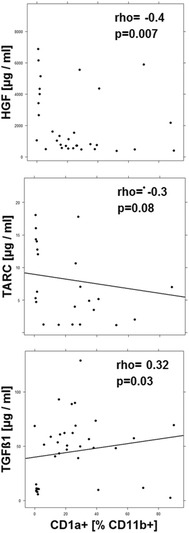
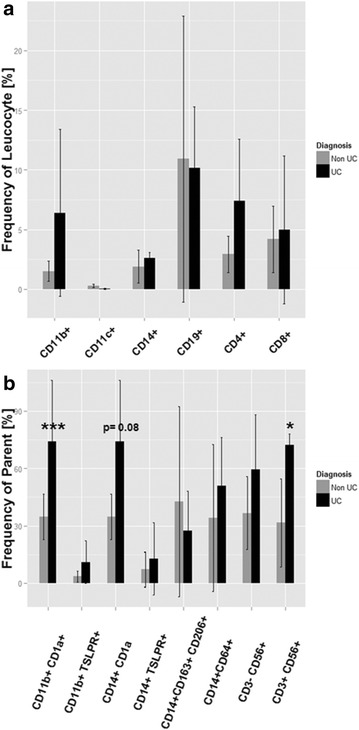
Methods: We undertook a more holistic approach whereby we designed a flow cytometric analysis- and ELISA panel and determined the immunological profiles of UC patients in comparison to Non UC donors. This panel consisted of B-cells, T-cells, macrophages, monocytes, NK- and NK T-cells and subtypes thereof, the cytokines TGFß1 and HGF, the chemokine TARC and periostin. Blood was collected from 41 UC patients and 30 non-UC donors. Isolated PBMC were subjected to flow cytometric analysis and sera were analyzed by ELISA. Data were analysed by cluster- and correlation analysis. To corroborate that the identified cells reflected the inflammatory condition in the colon of UC patients, leucocytes were isolated from colons of UC patients and subjected to the same flow cytometric analysis.
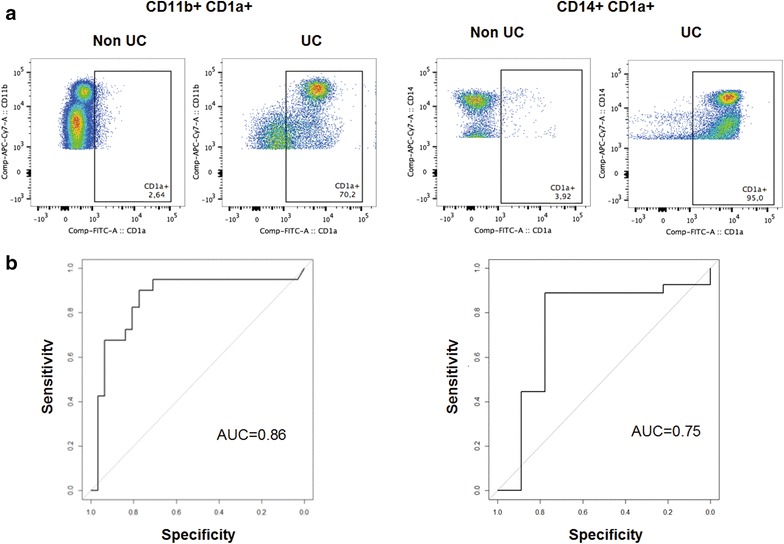
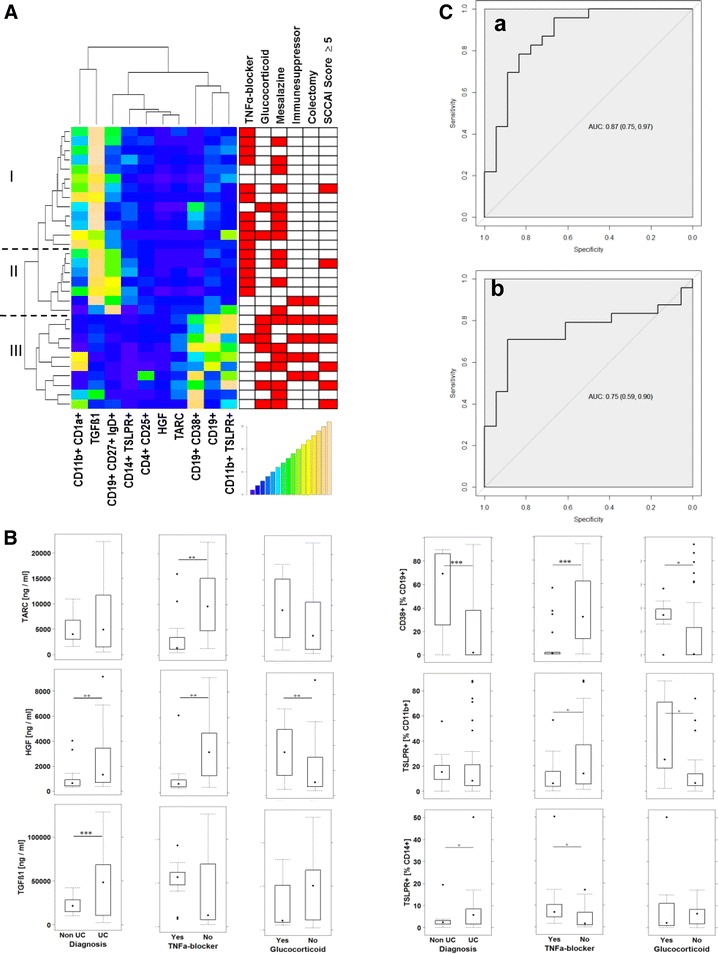
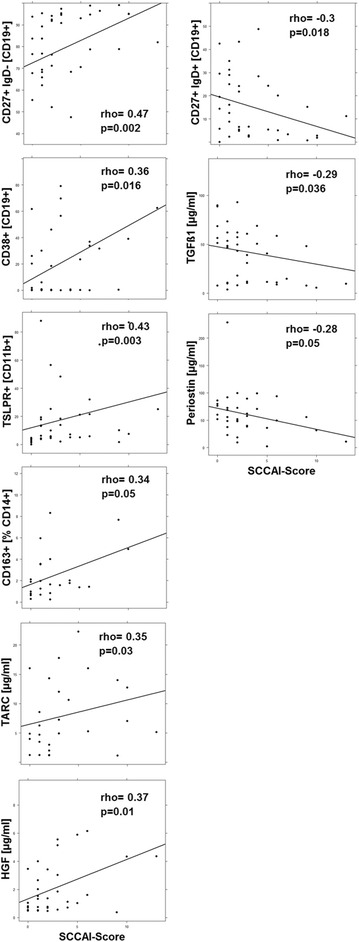
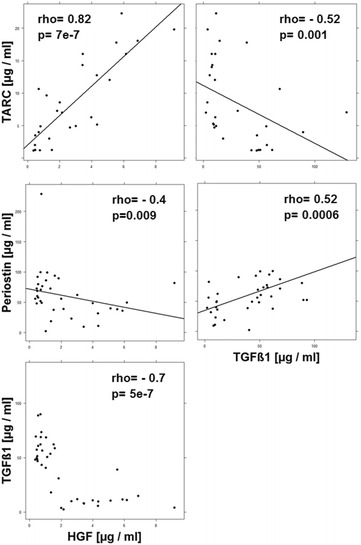
Results: Immunological profiling followed by cluster- and correlation analysis led to the identification of two inflammatory conditions: An 'acute' condition characterized by adaptive immune cells as plasma cells, TSLPR expressing CD11b+ macrophages, CD64 and CCR2 expressing CD14+ monocytes, HGF and TARC and a 'remodeling' condition signified by NK T-cells and TLSPR expressing CD14+ monocytes, TGFß1 and periostin. ROC analysis identified TARC and TGFß1 as biological markers with high potential to discriminate between these two conditions (Δ = -6687.72 ng/ml; p = 1E-04; AUC = 0.87). In addition, CD1a+ CD11b+ macrophages (Δ = 17.73% CD1a+ CD11b+; p = 5E-04; AUC = 0.86) and CD1a+ CD14+ monocytes (Δ = 20.35; p = 0.02, AUC = 0.75) were identified as markers with high potential to discriminate between UC and Non UC donors. CD1a+ CD11b+ macrophages and NK T-cells were found to be significantly increased in inflamed colons of UC patients as compared to non-UC control samples (p = 0.02).
Conclusions: Immunological profiling of UC patients might improve our understanding of the pathology underlying individual manifestations and phases of the disease. This might lead to the development of novel diagnostics and therapeutic interventions adapted to individual needs and different phases of the disease. In addition, it might result in stratification of patients for clinical trials.
Keywords: Biomarker; CD1a; Correlation analysis; HGF; Immune-profiling; TARC; TGFß1; Ulcerative colitis.
Figures
References
-
- Asokananthan N, Graham PT, Stewart DJ, Bakker AJ, Eidne KA, Thompson PJ, Stewart GA. House dust mite allergens induce proinflammatory cytokines from respiratory epithelial cells: the cysteine protease allergen, Der p 1, activates protease-activated receptor (PAR)-2 and inactivates PAR-1. J Immunol. 2002;169:4572–4578. doi: 10.4049/jimmunol.169.8.4572. - DOI - PubMed
-
- Vu AT, Baba T, Chen X, Le TA, Kinoshita H, Xie Y, Kamijo S, Hiramatsu K, Ikeda S, Ogawa H, et al. Staphylococcus aureus membrane and diacylated lipopeptide induce thymic stromal lymphopoietin in keratinocytes through the Toll-like receptor 2-Toll-like receptor 6 pathway. J Allergy Clin Immunol. 2010;126:985–993. doi: 10.1016/j.jaci.2010.09.002. - DOI - PubMed
Publication types
MeSH terms
Substances
LinkOut - more resources
Full Text Sources
Other Literature Sources
Medical
Research Materials
