. 2016 Nov 8;68(19):2086-2096.
doi: 10.1016/j.jacc.2016.07.779.

Patient-Specific and Genome-Edited Induced Pluripotent Stem Cell-Derived Cardiomyocytes Elucidate Single-Cell Phenotype of Brugada Syndrome

Affiliations

Patient-Specific and Genome-Edited Induced Pluripotent Stem Cell-Derived Cardiomyocytes Elucidate Single-Cell Phenotype of Brugada Syndrome

Ping Liang et al. J Am Coll Cardiol. .

Abstract

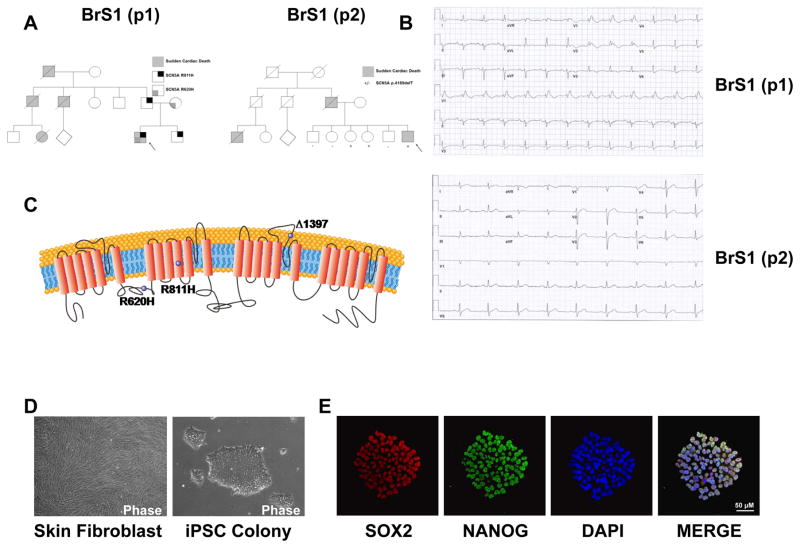
Background: Brugada syndrome (BrS), a disorder associated with characteristic electrocardiogram precordial ST-segment elevation, predisposes afflicted patients to ventricular fibrillation and sudden cardiac death. Despite marked achievements in outlining the organ level pathophysiology of the disorder, the understanding of human cellular phenotype has lagged due to a lack of adequate human cellular models of the disorder.

Objectives: The objective of this study was to examine single cell mechanism of Brugada syndrome using induced pluripotent stem cell-derived cardiomyocytes (iPSC-CMs).

Methods: This study recruited 2 patients with type 1 BrS carrying 2 different sodium voltage-gated channel alpha subunit 5 variants as well as 2 healthy control subjects. We generated iPSCs from their skin fibroblasts by using integration-free Sendai virus. We used directed differentiation to create purified populations of iPSC-CMs.

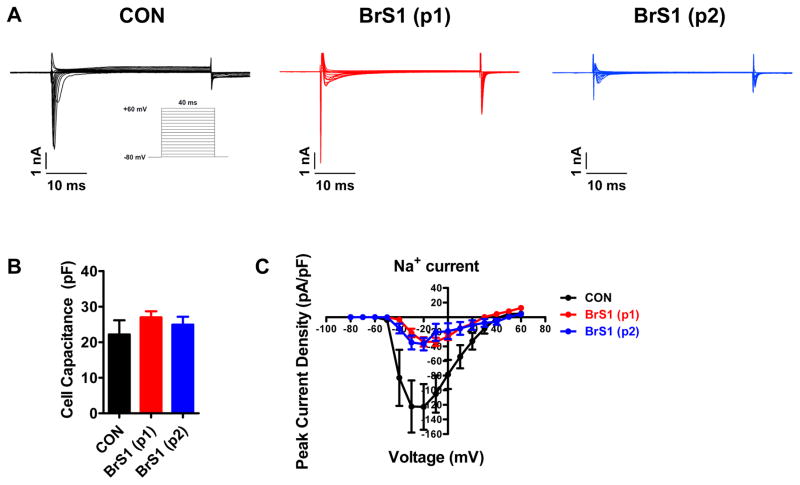
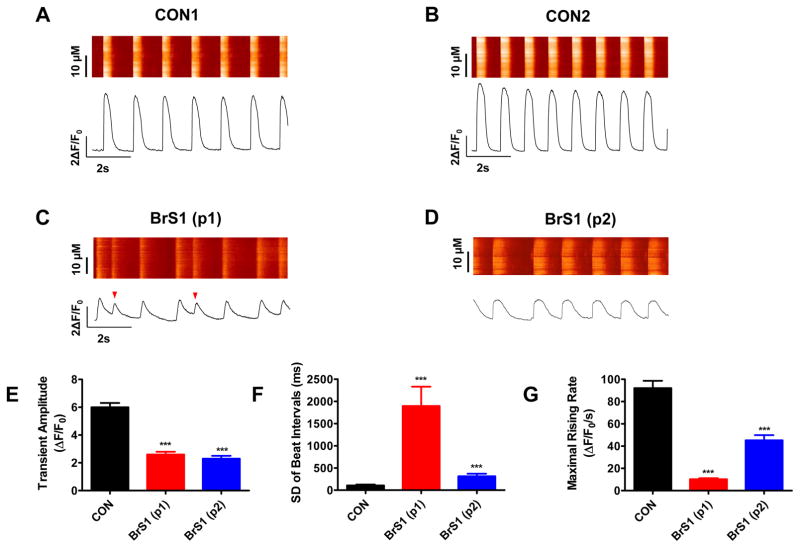
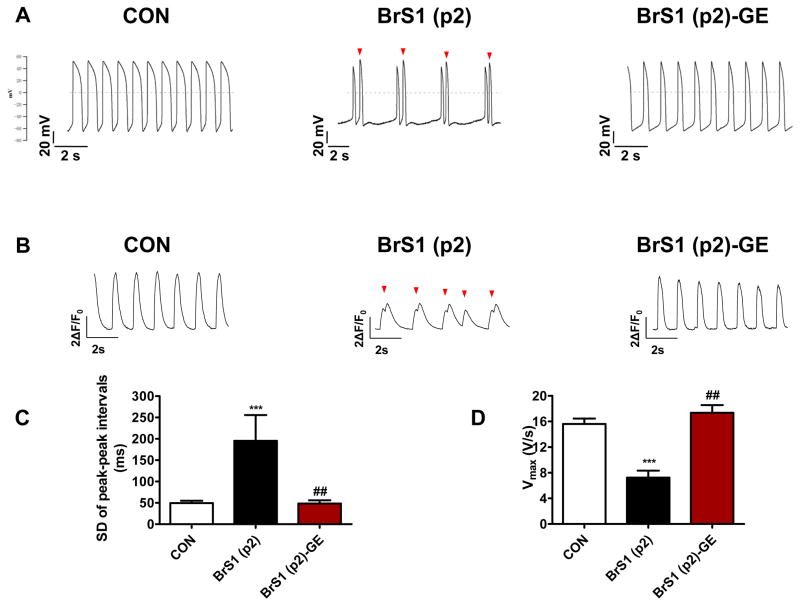
Results: BrS iPSC-CMs showed reductions in inward sodium current density and reduced maximal upstroke velocity of action potential compared with healthy control iPSC-CMs. Furthermore, BrS iPSC-CMs demonstrated increased burden of triggered activity, abnormal calcium (Ca2+) transients, and beating interval variation. Correction of the causative variant by genome editing was performed, and resultant iPSC-CMs showed resolution of triggered activity and abnormal Ca2+ transients. Gene expression profiling of iPSC-CMs showed clustering of BrS compared with control subjects. Furthermore, BrS iPSC-CM gene expression correlated with gene expression from BrS human cardiac tissue gene expression.

Conclusions: Patient-specific iPSC-CMs were able to recapitulate single-cell phenotype features of BrS, including blunted inward sodium current, increased triggered activity, and abnormal Ca2+ handling. This novel human cellular model creates future opportunities to further elucidate the cellular disease mechanism and identify novel therapeutic targets.

Keywords: Ca(2+) transient; SCN5A; action potential; arrhythmia; gene expression; genome editing.


Conflict of interest statement

CONFLICTS OF INTEREST

The authors have no conflicts of interest to disclose.

Figures

Figure 1
Figure 1. Generation and characterization of BrS iPSC lines and iPSC-CMs
A. The pedigrees of the 2 patients with the Type 1 Brugada Syndrome (BrS) both share a family history of sudden cardiac death. B. ECG from BrS patient 1 (BrS(p1)) shows a classic BrS ECG pattern. ECG from BrS patient 2 (BrS(p2)) shows non-specific intraventricular conduction delay. C. Schematic representation of SCN5A channel protein. Purple spheres indicate the genetic variants. D. Representative microscopy photographs of skin fibroblasts and iPSC colony derived from BrS. E. Representative immunostaining of pluripotency markers SOX2 (red) and NANOG (green) in iPSC clone derived from BrS. DAPI indicates the nuclear staining (blue). BrS(p1): Type 1 Brugada Syndrome patient 1. BrS(p2): Type 1 Brugada Syndrome patient 2
Figure 2
Figure 2. BrS iPSC-CMs show abnormal action potential profiles
A. Representative action potential traces of ventricular-like iPSC-CMs derived from CON(p1) (Upper Panel) and CON(p2) (Lower Panel), respectively. Dash lines indicate 0 mV. B. Representative action potential traces of ventricular-like iPSC-CMs derived from BrS(p1) (Upper Panel) and BrS(p2) (Lower Panel), showing triggered beats indicated by red arrows, respectively. Dash lines indicate 0 mV. C. Representative action potential traces of ventricular-like iPSC-CMs showing sustained triggered activity in BrS(p1) (Upper Panel) and BrS(p2) (Lower Panel), respectively, as indicated by red arrows. Dash lines indicate 0 mV. D. Bar graph comparison shows a higher incidence of peak-peak interval variability of action potentials in BrS iPSC-CMs (n = 60, 2 BrS(p1) lines; n = 22, 2 BrS(p2) lines) compared to control iPSC-CMs (n = 61, 2 control subject lines). E. Bar graph comparison of maximal upstroke velocity (Vmax) in ventricular-like iPSC-CMs between control subjects (n = 38, 2 control subject lines) and BrS patients (n = 50, 2 BrS(p1) lines; n = 7, 2 BrS(p2) lines) showing significantly reduced Vmax in BrS lines. All data were shown as mean ± s.e.m., and the statistical significance is indicated as **P< 0.01 or ***P< 0.001. CON(p1): Control subject 1. CON(p2): Control subject 2.
Figure 3
Figure 3. BrS iPSC-CMs show decreased Na+ current density
A. Representative Na+ current traces recorded from control (left panel, black), BrS(p1) (middle panel, red), and BrS(p2) (right panel, blue) iPSC-CMs. BrS iPSC-CMs show significantly reduced Na+ current. Inset is the voltage protocol used for isolating Na+ currents. B. Bar graph comparison of cell capacitance shows no significant difference in cell size between control and BrS iPSC-CMs. C. Comparison of current-voltage relationship (IV curve) between control and BrS iPSC-CMs. There is significantly decreased Na+ current density in BrS iPSC-CMs compared to control iPSC-CMs. n = 10–25 cells in 2 lines for each group.
Figure 4
Figure 4. BrS iPSC-CMs show irregular Ca2+ handling
A–D. Representative Ca2+ transient traces of iPSC-CMs derived from CON(p1), CON(p2), BrS(p1), and BrS(p2), respectively. The BrS iPSC-CMs show abnormal Ca2+ transient pattern compared to control cells (as indicated by red arrows). E. Bar graph comparison of Ca2+ transient amplitude of iPSC-CMs between control subjects and BrS patients confirm BrS iPSC-CMs indeed exhibit a lower Ca2+ transient amplitude. F. Bar graph comparison of standard deviation (SD) of beat intervals of iPSC-CMs between control subjects and BrS patients. BrS iPSC-CMs exhibit greater beat-beat interval variability, which likely contributes to the mechanism of arrhythmia seen in these cells. G. Bar graph comparison of maximal rising rate of iPSC-CMs between control subjects and BrS(p1) patients shows reduced maximal rising rate in BrS cells. n = 34–53 cells in 2 lines for each group. Unless specified, all data were shown as mean ± s.e.m and statistical significance is indicated as ***P< 0.001.
Figure 5
Figure 5. Genome editing of BrS iPSC-CMs
A. Representative action potential traces of ventricular-like myocytes derived from control iPSC line (Left Panel), BrS(p2) iPSC line (Middle Panel), and BrS(p2)-GE iPSC line (Right Panel), respectively. Dash lines indicate 0 mV, red arrows indicate triggered beats. B. Representative Ca2+ transient traces of cardiomyocytes derived from control iPSC line (Left Panel), BrS(p2) iPSC line (Middle Panel), and BrS(p2)-GE iPSC line (Right Panel), respectively. Red arrow indicates triggered beat. C. Bar graph comparison of SD of peak-peak interval variability of action potentials between control, BrS(p2) and BrS(p2) -GE iPSC-CMs. The significant increase in interval variability in BrS(p2) iPSC-CMs compared to control iPSC-CMs is reduced in BrS(p2) -GE iPSC-CMs; n=22–60 cells in 2 lines for each group. D. Bar graph comparison of maximal upstroke velocity (Vmax) in control, BrS(p2) and BrS(p2)-GE iPSC-CMs demonstrating significantly reduced Vmax is BrS(p2) iPSC-CMs compared to control iPSC-CMs and improvement in Vmax after genome editing of pathogenic SCN5A variant in BrS(p2)-GE; n = 7–50 cells in 2 lines for each group. Unless specified, all data were shown as mean + s.e.m. and the statistical significance is indicated as *P< 0.05, **P< 0.01, or ***P< 0.001 when compared to control iPSC-CMs. The statistical significance is indicated as #P< 0.05, ##P< 0.01 or ###P< 0.001 when compared to BrS(p2) iPSC-CMs. BrS(p2)-GE: Type 1 Brugada Syndrome patient 2-Genome Edited.

Comment in

References

    1. Brugada P, Brugada J. Right bundle branch block, persistent ST segment elevation and sudden cardiac death: a distinct clinical and electrocardiographic syndrome. A multicenter report. J Am Coll Cardiol. 1992;20:1391–6. - PubMed
    1. Brugada J, Brugada R, Brugada P. Determinants of sudden cardiac death in individuals with the electrocardiographic pattern of Brugada syndrome and no previous cardiac arrest. Circulation. 2003;108:3092–6. - PubMed
    1. Antzelevitch C, Brugada P, Borggrefe M, et al. Brugada syndrome: report of the second consensus conference: endorsed by the Heart Rhythm Society and the European Heart Rhythm Association. Circulation. 2005;111:659–70. - PubMed
    1. Veltmann C, Schimpf R, Echternach C, et al. A prospective study on spontaneous fluctuations between diagnostic and non-diagnostic ECGs in Brugada syndrome: implications for correct phenotyping and risk stratification. Eur Heart J. 2006;27:2544–52. - PubMed
    1. Yan GX, Antzelevitch C. Cellular basis for the Brugada syndrome and other mechanisms of arrhythmogenesis associated with ST-segment elevation. Circulation. 1999;100:1660–6. - PubMed

Publication types

MeSH terms