. 2016 Nov:13:237-247.
doi: 10.1016/j.ebiom.2016.10.030. Epub 2016 Oct 20.

Commensal Microbe-specific Activation of B2 Cell Subsets Contributes to Atherosclerosis Development Independently of Lipid Metabolism

Affiliations

Commensal Microbe-specific Activation of B2 Cell Subsets Contributes to Atherosclerosis Development Independently of Lipid Metabolism

Lin Chen et al. EBioMedicine. 2016 Nov.

Abstract

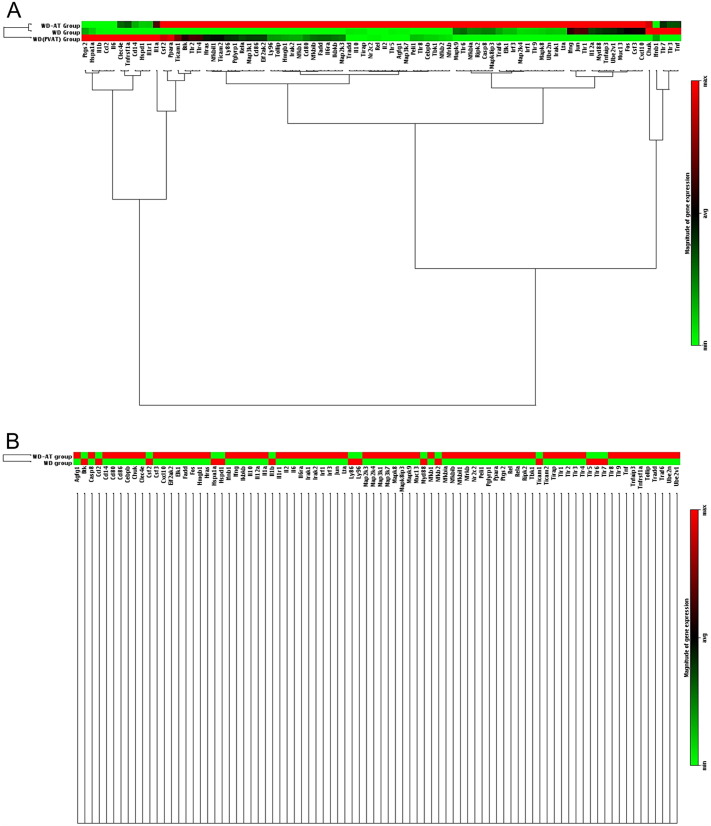
The relation between B2 cells and commensal microbes during atherosclerosis remains largely unexplored. Here we show that under hyperlipidemic conditions intestinal microbiota resulted in recruitment and ectopic activation of B2 cells in perivascular adipose tissue, followed by an increase in circulating IgG, promoting disease development. In contrast, disruption of the intestinal microbiota by a broad-spectrum antibiotic cocktail (AVNM) led to the attenuation of atherosclerosis by suppressing B2 cells, despite the persistence of serum lipid abnormalities. Furthermore, pharmacological depletion of B2 cells with an anti-B2-cell surface CD23 antibody also attenuated commensal microbe-induced atherosclerosis. Moreover, expression analysis of TLR-signaling-related genes in the activated B2 cell subsets, assessed using the Toll-Like Receptor Signaling Pathway RT2 Profiler PCR Array, confirmed activation of the B2-cell autoantibody-production axis, which was associated with an increased capacity of B2 cells to bind to intestinal microbiota. Together, our findings reveal the critical role of commensal microbe-specific activation of B2 cells in the development of atherogenesis through lipid metabolism-independent mechanisms.

Keywords: Atherosclerosis; B2 cell; Inflammation; Intestinal microbiota; TLR signaling.


Figures

Image 1
Graphical abstract
Fig. 1
Fig. 1
Antibiotic treatment mice are resistant to diet-induced atherosclerosis. Mice given a Western diet or normal chow diet with or without antibiotic treatment for 8 weeks. (A) Body weights. AT: antibiotic treatment; WD: Western diet; ND: normal chow diet. Data pooled from three independent experiments (means ± SEM. n = 7 for each group). (B–D) Representative micro-CT images of fat (B) and quantification of total percent of visceral fat volume (C) and subcutaneous fat volume (D) are shown. Data are representative of three independent experiments (means ± SEM. n = 7 for each group) *p < 0.05, **p < 0.01, ***p < 0.001 according to the post hoc ANOVA statistical analysis. (E–H) Serum levels of total cholesterol (E), LDL (F) and HDL cholesterol (G), and triglyceride (H) were assessed. LDL: low-density lipoprotein; HDL: high-density lipoprotein. Results are presented as means ± SEM. n = 7 per group, *p < 0.05, **p < 0.001. (I and J) Aortic lesion size was assessed by oil red O (I) and HE staining (J). Representative images and quantification of oil red O staining of aortas prepared en face are shown in I (% of aortic surface area, n = 12 for each group). Representative images and quantification of maximum lesion area within the aortic root sections as determined by HE staining are shown in J (n = 12 for each group). Scale bars represent 100 μm. Data pooled from three independent experiments. *p < 0.05, **p = 0.001, comparing WD vs. the other groups by ANOVA.
Fig. 2
Fig. 2
Antibiotic treatment controls atherosclerosis by blocking B2 cells expansion. At the end of 8 weeks of a Western diet (WD) or normal chow diet (ND), the effects of antibiotic treatment (AT) on the typical features of PVAT expansion and accumulation of CD23 positive cells are shown in A–C. (A) Mean adipocyte diameter was quantified in PVAT sections. The surface area of at least 250 adipocytes per image was counted, and a total of seven images per PVAT were analyzed with ImageJ software. Data represent means ± SEM from n = 7 experiments. *p < 0.001 for 1-way ANOVA with Tukey corrections. (B and C) Representative images (B) and quantification of CD23-positive staining in PVAT sections (C). Scale bars represent 50 μm. Values are presented as means ± SEM. *p < 0.001, comparing WD vs. the other groups by ANOVA. (D and E) Flow cytometry analysis of (D) follicular (FO) B cells of PVAT, (E) FO B cells and marginal zone (MZ) B cells in spleen, respectively (n = 6 mice per group). Data from 14 mice pooled from 3 independent experiments. Cell counts are presented as means ± SEM. *p < 0.01, **p < 0.001. (F and G) Concentrations of total IgG (F), IgG3 (G) were assessed by ELISA. Values are presented as means ± SEM. n = 6 per group from 3 independent experiments, *p < 0.05, **p < 0.01, ***p < 0.001 by Tukey post-hoc test. (H) RNA expression of MHC class II analyzed in purified, cell-sorted B220+ CD21+/loCD23+ (FO B cells), B220+ CD21highCD23−/lo (MZ B cells) in spleen digest from WD and WD-AT by real-time polymerase chain reaction and normalized to GAPDH. Results are presented as means ± SEM. fold change of 2△Ct, *p < 0.05, n = 7 per group.
Fig. 3
Fig. 3
Distinct gene expression profiles associated with TLR signaling pathway in B2 cells following WD and AT. Messenger RNA preparations of sorted FO B cells from PVAT and spleen and MZ B cells from spleen were analyzed by mouse toll-like receptor signaling pathway RT2 Profiler PCR arrays. Gene expression reportedly associated with TLR signaling pathway was compared among the indicated FO B2 cell groups (A) and indicated MZ B2 cell groups (B), respectively. Results are displayed as heat maps. Red, max (magnitude of gene expression); green, min (magnitude of gene expression).
Fig. 4
Fig. 4
Pharmacological depletion of B2 cells protects mice from atherosclerosis. (A and B) Representative flow cytometric plots of B2 cell numbers in the PVAT (A) and spleens (B) of mice treated with a mouse specific CD23 antibody or saline (n = 6 per group). (C) Body weights measured at the end of 8 weeks of a Western diet in mice treated with a mouse specific CD23 antibody or saline. Values are presented as means ± SEM from n = 6 experiments. (D and E) Micro-CT of total percent of visceral fat volume (D) and subcutaneous fat volume (E). Data are representative as means ± SEM. n = 6 for each group. (F–I) Serum levels of total cholesterol (F), LDL (G) and HDL (H) and triglyceride (I) were assessed. LDL: low-density lipoprotein; HDL: high-density lipoprotein. Results are presented as means ± SEM. n = 6 per group. (J and K) Effect of an anti-mouse CD23 antibody on plaque formation is shown in J–K. (J) Representative images and quantification of oil red O staining of aortas prepared en face. (K) Representative HE staining of aortic root sections and quantification of maximum lesion area. Group data (means ± SEM) from n = 6 experiments. Scale bar, 100 μm. *p < 0.05, **p < 0.001 for 1-way ANOVA with Tukey's corrections. (L and M) Concentrations of total IgG (L) and IgG3 (M) in serum from mice treated with a mouse specific CD23 antibody or saline. Values are presented as means ± SEM from n = 6 experiments. *p < 0.05, **p < 0.01 for 1-way ANOVA with Tukey's corrections.

Comment in

References

    1. Ait-Oufella H., Herbin O., Bouaziz J.D., Binder C.J., Uyttenhove C., Laurans L., Taleb S., Van Vre E., Esposito B., Vilar J. B cell depletion reduces the development of atherosclerosis in mice. J. Exp. Med. 2010;207:1579–1587. - PMC - PubMed
    1. Balázs M., Martin F., Zhou T., Kearney J.F. Blood dendritic cells interact with splenic marginal zone B cells to initiate T-independent immune responses. Immunity. 2002;17:341–352. - PubMed
    1. Barthel M., Hapfelmeier S., Quintanilla-Martínez L., Kremer M., Rohde M., Hogardt M., Pfeffer K., Rüssmann H., Hardt W.-D. Pretreatment of mice with streptomycin provides a Salmonella enterica serovar Typhimurium colitis model that allows analysis of both pathogen and host. Infect. Immun. 2003;71:2839–2858. - PMC - PubMed
    1. Brown J.M., Hazen S.L. The gut microbial endocrine organ: bacterially derived signals driving cardiometabolic diseases. Annu. Rev. Med. 2015;66:343–359. - PMC - PubMed
    1. Canducci F., Saita D., Foglieni C., Piscopiello M.R., Chiesa R., Colombo A., Cianflone D., Maseri A., Clementi M., Burioni R. Cross-reacting antibacterial auto-antibodies are produced within coronary atherosclerotic plaques of acute coronary syndrome patients. PLoS One. 2012;7 - PMC - PubMed

MeSH terms