. 2016 Oct 24;215(2):259-275.
doi: 10.1083/jcb.201604095.

Independent modes of ganglion cell translocation ensure correct lamination of the zebrafish retina

Affiliations

Independent modes of ganglion cell translocation ensure correct lamination of the zebrafish retina

Jaroslav Icha et al. J Cell Biol. .

Abstract

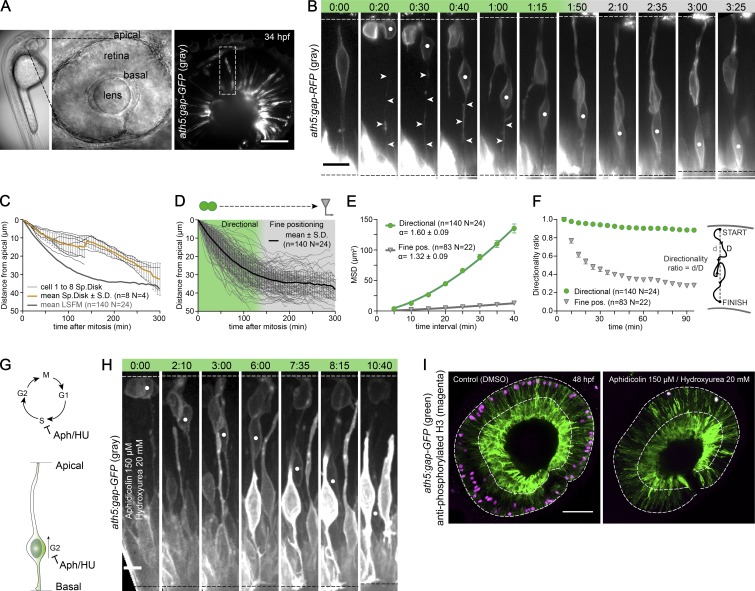
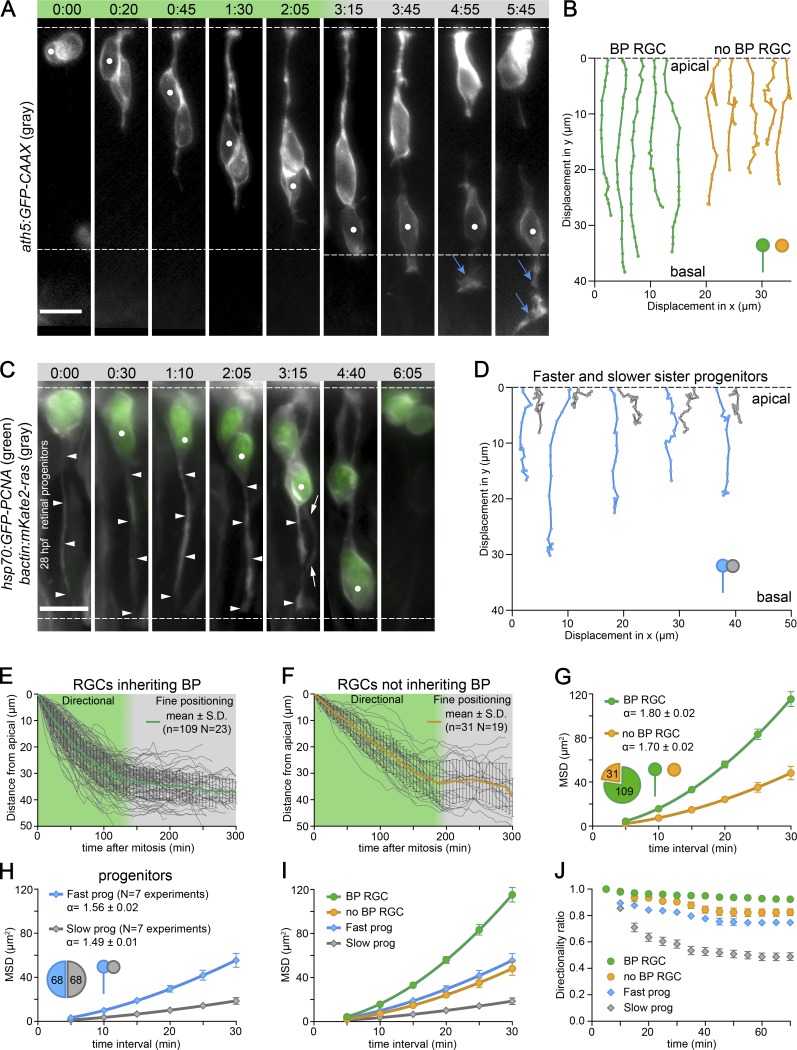
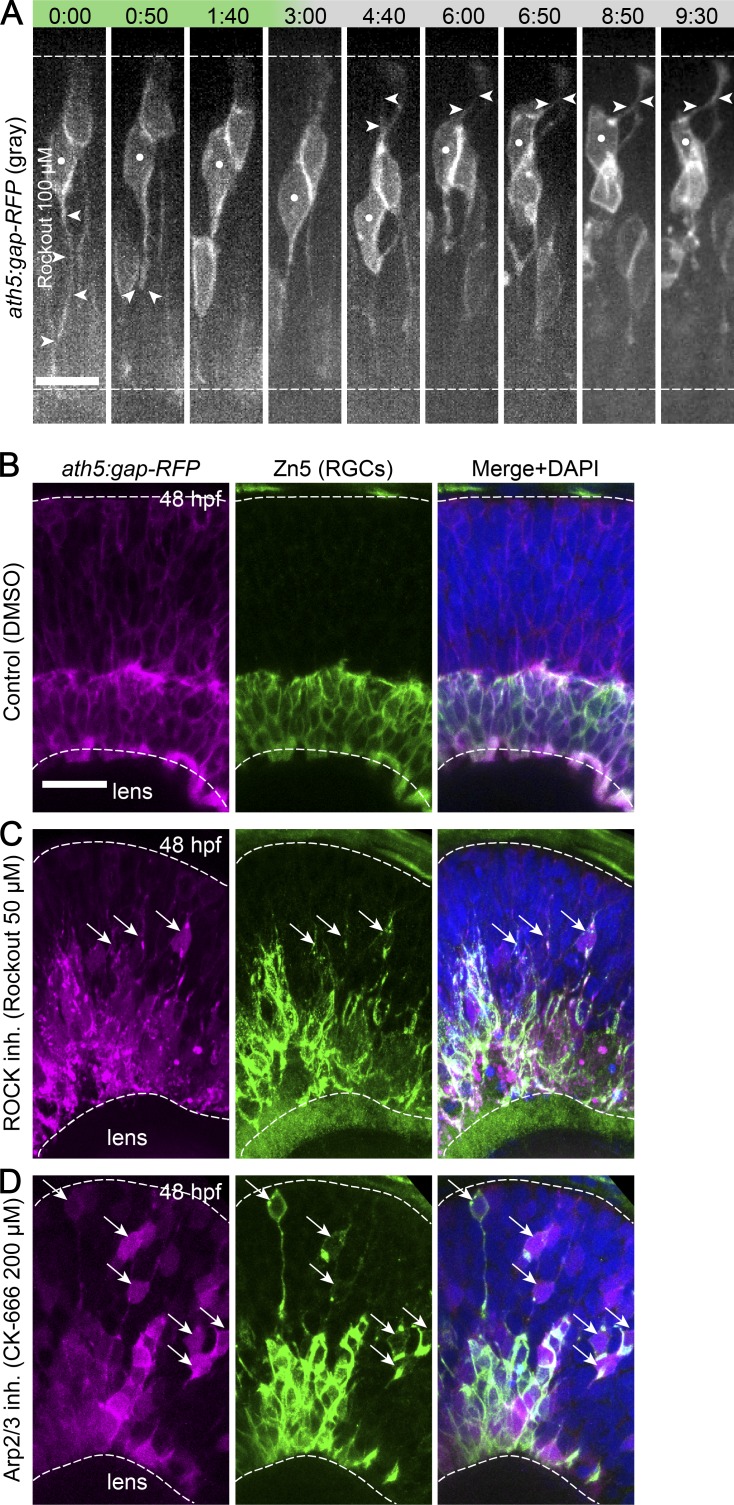
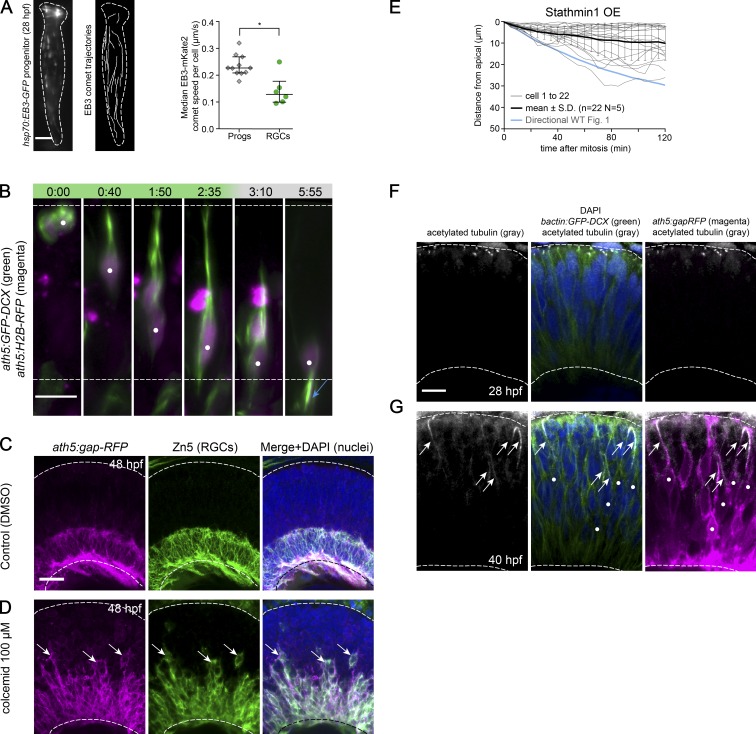
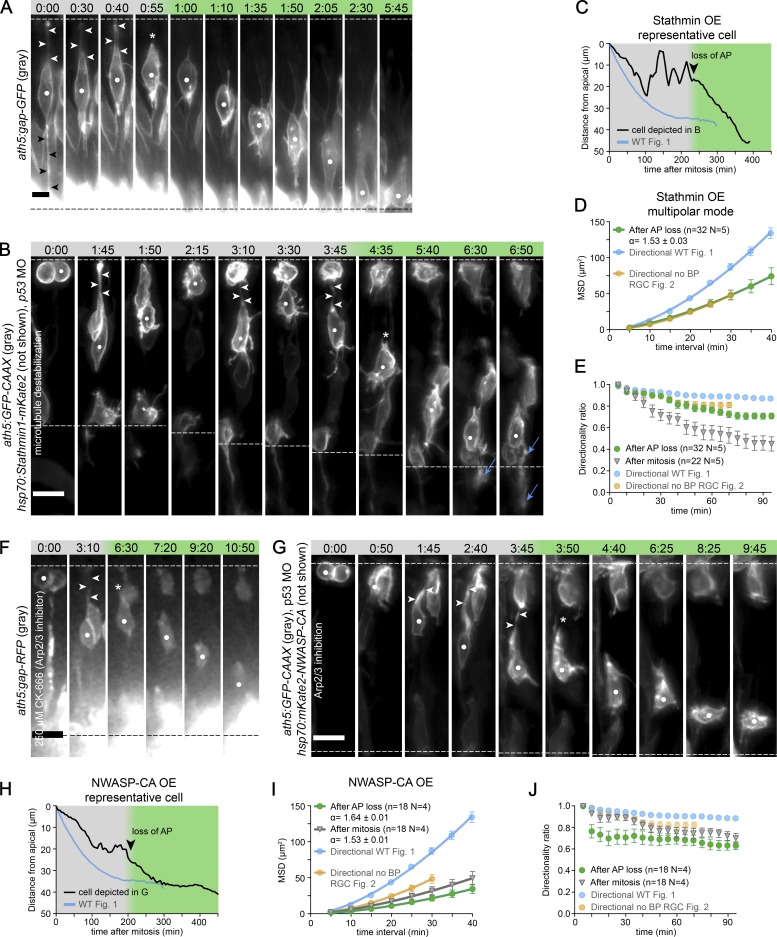
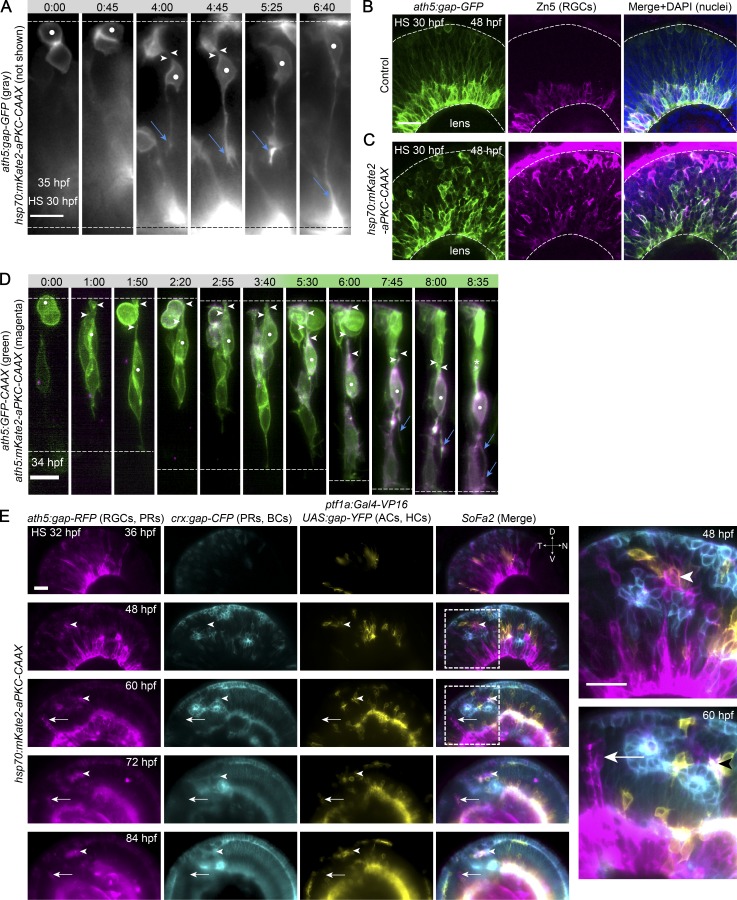
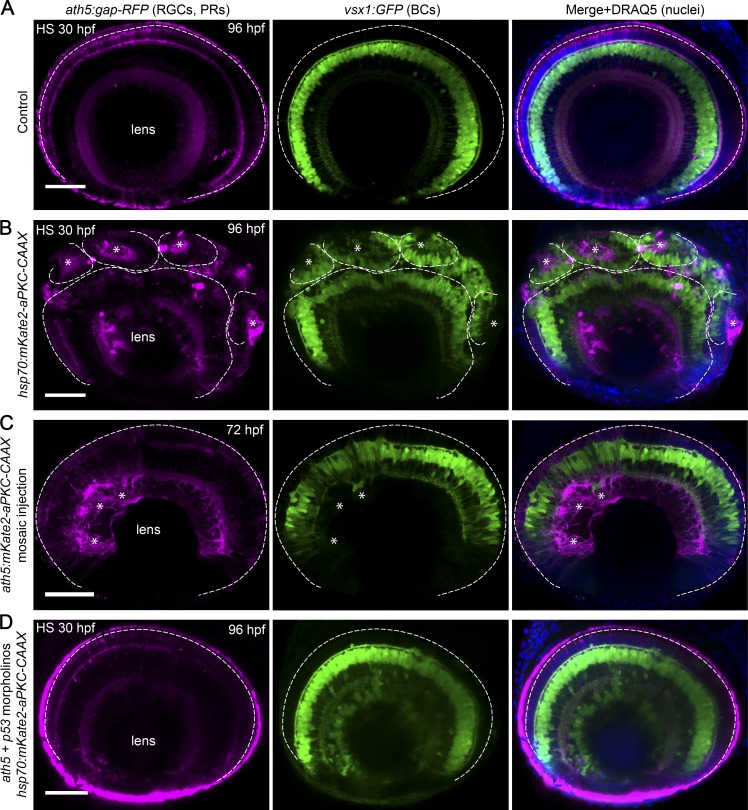
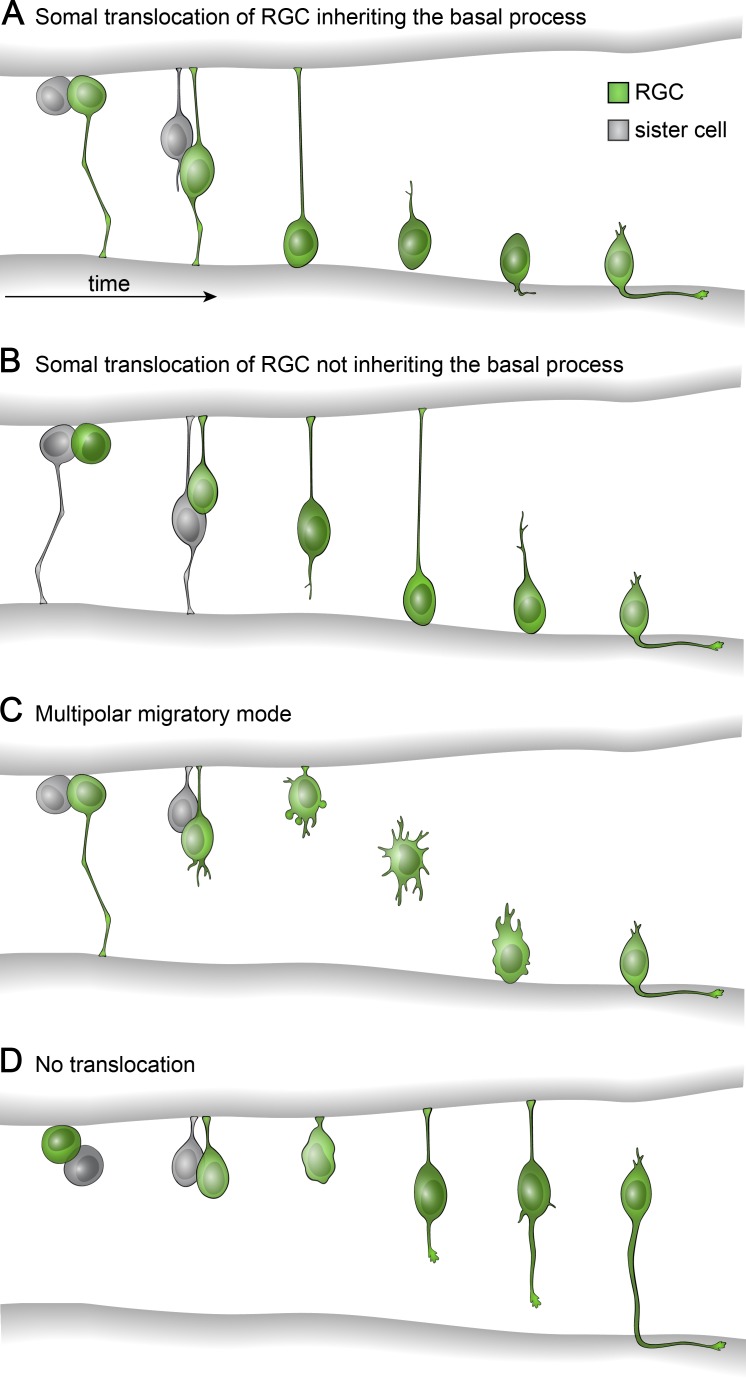
The arrangement of neurons into distinct layers is critical for neuronal connectivity and function. During development, most neurons move from their birthplace to the appropriate layer, where they polarize. However, kinetics and modes of many neuronal translocation events still await exploration. In this study, we investigate retinal ganglion cell (RGC) translocation across the embryonic zebrafish retina. After completing their translocation, RGCs establish the most basal retinal layer where they form the optic nerve. Using in toto light sheet microscopy, we show that somal translocation of RGCs is a fast and directed event. It depends on basal process attachment and stabilized microtubules. Interestingly, interference with somal translocation induces a switch to multipolar migration. This multipolar mode is less efficient but still leads to successful RGC layer formation. When both modes are inhibited though, RGCs fail to translocate and induce lamination defects. This indicates that correct RGC translocation is crucial for subsequent retinal lamination.


Figures

Figure 1.
Figure 1.
RGC translocation kinetics. (A) Developing eye of a 34-hpf embryo. ath5:gap-GFP transgene labels RGCs. The dashed box shows the typical area displayed in subsequent montages. Bar, 50 µm. (B) Typical example of RGC translocation in LSFM. Arrowheads, basal process. Bar, 10 µm. (C) Kinetics of RGC translocation in a spinning disk confocal microscope. 0 indicates mitotic position of cells. Eight single trajectories (n = 4 experiments) and a mean trajectory ± SD are shown plus the mean of wild-type trajectories in LSFM. (D) Kinetics of RGC translocation in LSFM. 0 indicates mitotic position of cells. 140 single trajectories and a mean trajectory ± SD are shown. Green phase, directionally persistent movement; gray phase, fine positioning. (E) MSDs of RGCs for directional phase and fine positioning. MSDs are from the first 95 min after mitosis and the first 95 min after reaching the basal side. α value is given with a 95% confidence interval. (F) Directionality ratio of RGCs in directional movement and fine positioning. Data from E. (E and F) Error bars represent SEM. Final directionality ratios: directional = 0.88; fine positioning = 0.28. The scheme defines the directionality ratio between the distance from start to finish of the trajectory (d) and the length of the trajectory (D). (G) Aphidicolin/hydroxyurea stalls cells in S phase. Thus, nuclei do not migrate toward the apical side for mitosis. (H) ath5:gap-GFP embryos treated with 150 µM aphidicolin/20 mM hydroxyurea imaged in a spinning disk microscope from 34 hpf. Imaging started 1 h after drug addition. Bar, 5 µm. (B and H) White dots, RGC followed. Time is shown in hours and minutes. Dashed lines delimit the apical and basal sides. (I) RGC layer still forms upon cell cycle inhibition. Fewer mitotic cells (right) compared with control (left) are seen by pH3 staining (magenta). Dashed lines mark the retinal outline and RGC layer. Bar, 50 µm.
Figure 2.
Figure 2.
Basal process inheritance streamlines basal nuclear translocation in RGCs and progenitors. (A) Translocation of an RGC not inheriting the basal process (BP). Compare with Fig. 1 B. White dots, RGC followed; blue arrows, axon. Time is shown in hours and minutes. (B) Five representative 2D trajectories of RGCs inheriting (green) and RGCs not inheriting the basal process (BP; orange) for the first 95 min after cell division. More trajectories are in Fig. S2 (F and G). (C) Inheritance of basal process in progenitors. White dots, basal process inheriting progenitor; arrowheads, inherited basal process; arrows, newly formed basal process of sister cell. (A and C) Bars, 10 µm. (D) Five representative 2D trajectories of sister progenitors inheriting (blue) and not inheriting the basal process (gray) for the first 95 min after cell division. (E) Kinetics of RGC translocation with basal process. 0 indicates the mitotic position of cells. Single trajectories and a mean trajectory ± SD are shown. (F) Kinetics of RGC translocation without basal process. (E and F) Green phase, directionally persistent movement; gray phase, fine positioning. (G) MSDs of translocating RGCs with and without basal process. MSDs are calculated from the first 70 min after mitosis. (H) MSDs of faster and slower translocating sister progenitor nuclei. MSDs are calculated from the first 70 min after mitosis. (G and H) The α value is given with a 95% confidence interval. (I) Comparison of MSDs of RGC and progenitor nuclear translocation. Graph shows combined data from G and H. (J) Directionality ratios of RGC and progenitor nuclear translocation. The mean of all tracks is shown. Error bars represent SEM. Final directionality ratios: basal process RGC = 0.92, no basal process RGC = 0.82, fast progenitor = 0.75, slow progenitor = 0.49.
Figure 3.
Figure 3.
Basal process attachment is important for RGC translocation. (A) RGC translocation after ROCK inhibition. ath5:gap-RFP fish were imaged in a spinning disk microscope from 34 hpf. 100 µM Rockout was added at the start of imaging. White dots, RGC followed; arrowheads, basal and apical process. Time is shown in hours and minutes. Bar, 10 µm. (B) Zn5 staining for differentiated RGCs in control retina at 48 hpf. (C) Zn5 staining for differentiated RGCs after ROCK inhibition. (D) Zn5 staining for differentiated RGCs after Arp2/3 inhibition. (B–D) Arrows, ectopic RGCs. Dashed lines represent apical and basal sides. Bar, 20 µm.
Figure 4.
Figure 4.
Stabilized MTs are important for RGC translocation. (A, left) Example of EB3 comets in progenitor cells. Bar, 5 µm. (Right) Progenitor EB3 comet speed median = 0.23 µm/s; n = 11 cells, 60 comets. RGC EB3 comet speed median = 0.13 µm/s; n = 6 cells, 24 comets; *, P = 0.0103, Mann-Whitney U test. Bars represent median and interquartile ranges. (B) Live imaging of MTs in translocating RGCs. Time is shown in hours and minutes. White dots, RGC followed; blue arrow, axon. Bar, 10 µm. (C) Staining for differentiated RGCs with Zn5 antibody in control retina at 48 hpf. (D) Zn5 staining in retinas treated with colcemid. (E) MT destabilization by overexpression (OE) of Stathmin 1 (hsp70:Stathmin1-mKate2) stalls RGC translocation. Heat shock applied at 30 hpf, imaging from 34 hpf. Graph shows all trajectories after RGC terminal division, the mean trajectory ± SD, and the mean trajectory in the wild-type situation. (F) Acetylated tubulin staining in progenitors. MTs were labeled by bactin:GFP-DCX. At 28 hpf, only apical primary cilia in progenitors are stained. Bar, 10 µm. (G) Acetylated tubulin staining in RGCs. All MTs were labeled by bactin:GFP-DCX. At 40 hpf, acetylated tubulin is seen in the apical process of RGCs (white arrows). White dots, translocating RGCs. (C, D, F, and G) Dashed lines represent apical and basal sides. Arrows, ectopic RGCs. Bar, 20 µm.
Figure 5.
Figure 5.
RGCs can switch to a multipolar migratory mode. (A) Rare example of multipolar migration in control embryos. Bar, 5 µm. (B) Multipolar migration induced by MT destabilization. Stathmin 1 overexpression induced at 30 hpf. Time lapse starts at 34 hpf. (A and B) Gray phase, cell still has the basal and apical process (A) or apical process (B); green phase, directional multipolar mode; white dots, RGC followed; arrowheads, apical and basal process (A) or apical process (B); asterisks, apical process loss; blue arrows, axon. Bar, 10 µm. (C) Typical trajectory of RGCs with destabilized MTs from the montage in B. Arrowheads, loss of the apical process (AP). More trajectories are in Fig. S4 E. The mean wild-type (WT) trajectory is shown. (D) MSDs of RGCs in multipolar migratory mode. Values are taken from the first 95 min after apical process loss. Wild type from Fig. 1 E and RGCs without basal process from Fig. 2 G. The α value is given with a 95% confidence interval. (E) Directionality ratios before and after apical process loss. Values are taken from the first 95 min after mitosis and the first 95 min after apical process loss. Final directionality ratios: after apical process (AP) loss, 0.71; after mitosis, 0.45. Wild type from Fig. 1 F and RGCs without basal process (BP) from Fig. 2 J. (F) Multipolar migration induced by Arp2/3 inhibition. ath5:gap-RFP fish were imaged in a spinning disk microscope from 34 hpf. CK-666 was added at the start of imaging. Images were denoised in Fiji (ROF denoise). (G) Multipolar migration induced by Arp2/3 inhibition. NWASP-CA overexpression was induced at 30 hpf. Time lapse starts at 34 hpf. (F and G) Gray phase, cell has apical process; green phase, directional multipolar mode; white dots, RGC followed; arrowheads, apical process; asterisks, apical process loss. Dashed lines delimit the apical and basal sides. Bars, 10 µm. (H) Typical trajectory of RGCs upon NWASP-CA overexpression (OE) from the montage in G. Arrowhead, apical process loss. More trajectories are in Fig. S4 H. The mean wild-type trajectory is shown. (I) MSDs of RGCs after Arp2/3 inhibition (NWASP-CA overexpression). Wild type from Fig. 1 E and RGCs without basal process from Fig. 2 G. The α value is given with a 95% confidence interval. (J) Directionality ratios of RGCs after mitosis and after apical process loss upon NWASP-CA overexpression. (I and J) Values are taken from the first 95 min after mitosis and the first 95 min after apical process loss. Error bars represent SEM. Final directionality ratios: after apical process loss = 0.63; after mitosis = 0.70. Wild type from Fig. 1 F and RGCs without BP from Fig. 2 J.
Figure 6.
Figure 6.
RGC translocation is stalled upon aPKC-CAAX overexpression and is not rescued over time. (A) No RGC translocation upon aPKC-CAAX overexpression. (B) Zn5 staining for differentiated RGCs in control retina at 48 hpf. Bar, 20 µm. (C) Zn5 staining of aPKC-CAAX–overexpressing retina at 48 hpf. (B and C) Dashed lines delimit apical and basal sides. (D) aPKC-CAAX expression specifically in the ath5 lineage stops RGC translocation and leads to ectopic polarization. (A and D) White dots, RGC followed; arrowheads, apical process; asterisk, loss of apical process; blue arrows, axon. Time is shown in hours and minutes. Bars, 10 µm. (E) The SoFa2 transgenic fish (combination of ath5:gap-RFP [labeling RGCs and photoreceptors (PRs)], crx:gap-CFP [labeling photoreceptors and bipolar cells (BCs)], and ptf1a:Gal4-VP16 UAS:gap-YFP [labeling horizontal cells (HCs) and ACs]) imaged every 12 h. Fish were kept in the incubator between time points. Ectopic RGCs developed at the temporal (T) side of retina. The nasal (N) side developed as a control (see Fig. S5 A). Arrowheads, clusters of RGCs that trigger ectopic lamination of other cell types; arrows, clusters of RGCs that interrupt the normal lamination without triggering ectopic layers; dashed boxes, magnified area. HS, heat shock; D, dorsal; V, ventral. Bars, 20 µm.
Figure 7.
Figure 7.
Ectopically differentiated RGCs induce retinal lamination defects. (A) Control retina at 96 hpf with RGCs, photoreceptors (PRs; magenta), and bipolar cells (BCs; green) labeled. Nuclei are stained with DRAQ5 (blue). HS, heat shock. (B) Organizing role of ectopic RGCs. Asterisks, clusters of ectopic RGCs organizing later-born bipolar cells. (C) Lamination defects after mosaic expression of ath5:mKate2-aPKC-CAAX. Asterisks, area with the lamination defect. (D) Retinal lamination upon aPKC-CAAX overexpression in the absence of RGCs. The ath5:gap-RFP reporter is still expressed in other cell types when RGCs are absent in the ath5 morphant. No optic nerve is seen. (A–D) Dashed lines delimit the apical side or indepedent areas of lamination. Bars, 50 µm.
Figure 8.
Figure 8.
Scheme of different RGC translocation scenarios. (A) Somal translocation of RGC inheriting the basal process, a mode used by 80% of cells. The RGC translocates basally faster than the sister cell. Fine positioning, during which cells lose their apical processes and eventually form axons, follows. (B) Somal translocation of RGC not inheriting the basal process, a mode used by 20% of cells. The RGC initially lags behind the sister cell. Later, it regrows the basal process and overtakes it. Translocation is less efficient than in A. The fine positioning phase is shorter than in A. (C) The multipolar migratory mode occurs after MT destabilization or Arp2/3 inhibition and in rare cases in control cells. After loss of basal process attachment, the RGC detaches its apical process and increases protrusive activity. It then moves basally using the multipolar mode. This movement is less efficient than in A. Axon formation and RGC layer establishment are not affected. (D) No translocation. In case RGC translocation is inhibited, cells are able to differentiate at ectopic locations, which has severe consequences for later retinal lamination.

References

    1. Almeida A.D., Boije H., Chow R.W., He J., Tham J., Suzuki S.C., and Harris W.A.. 2014. Spectrum of fates: a new approach to the study of the developing zebrafish retina. Development. 141:1971–1980. 10.1242/dev.104760 - DOI - PMC - PubMed
    1. Bellion A., Baudoin J.-P., Alvarez C., Bornens M., and Métin C.. 2005. Nucleokinesis in tangentially migrating neurons comprises two alternating phases: forward migration of the Golgi/centrosome associated with centrosome splitting and myosin contraction at the rear. J. Neurosci. 25:5691–5699. 10.1523/JNEUROSCI.1030-05.2005 - DOI - PMC - PubMed
    1. Brown N.L., Kanekar S., Vetter M.L., Tucker P.K., Gemza D.L., and Glaser T.. 1998. Math5 encodes a murine basic helix-loop-helix transcription factor expressed during early stages of retinal neurogenesis. Development. 125:4821–4833. - PubMed
    1. Cajal S.R. 1972. The Structure of the Retina. Thorpe S.A., and Glickstein M., editors. Charles Thomas, Springfield, Illinois. 196 pp.
    1. Chow R.W.-Y., Almeida A.D., Randlett O., Norden C., and Harris W.A.. 2015. Inhibitory neuron migration and IPL formation in the developing zebrafish retina. Development. 142:2665–2677. 10.1242/dev.122473 - DOI - PMC - PubMed

Substances