. 2016 Nov 14;213(12):2691-2706.
doi: 10.1084/jem.20160560. Epub 2016 Oct 24.

CD72 negatively regulates B lymphocyte responses to the lupus-related endogenous toll-like receptor 7 ligand Sm/RNP

Affiliations

CD72 negatively regulates B lymphocyte responses to the lupus-related endogenous toll-like receptor 7 ligand Sm/RNP

Chizuru Akatsu et al. J Exp Med. .

Abstract

Toll-like receptor 7 (TLR7) plays an essential role in development of systemic lupus erythematosus by co-stimulating B cells reactive to the endogenous TLR7 ligand Sm/ribonucleoprotein (RNP), a crucial lupus self-antigen. However, how the TLR7-mediated autoimmune response is regulated is not yet known. In this study, we demonstrate that CD72, an inhibitory B cell co-receptor known to prevent development of lupus, recognizes Sm/RNP at the extracellular C-type lectin-like domain (CTLD) and specifically inhibits B cell response to Sm/RNP. Moreover, the CTLD of CD72c, a lupus-susceptible allele, binds to Sm/RNP less strongly than that of lupus-resistant CD72a Reduced binding of CD72c is supported by x-ray crystallographic analysis that reveals a considerable alteration in charge at the putative ligand-binding site. Thus, CD72 appears to specifically inhibit B cell response to the endogenous TLR7 ligand Sm/RNP through CTLD-mediated recognition of Sm/RNP, thereby preventing production of anti-Sm/RNP antibody crucial for development of lupus.


Figures

Figure 1.
Figure 1.
CD72 CTLD specifically binds to Sm/RNP. (A–E) Conventional ELISA. Biotinylated CD72a and CD72c CTLD proteins at the indicated concentrations were incubated with ELISA plates coated with the indicated molecules. CD72 CTLD proteins bound to the ELISA plates were detected using alkaline phosphatase–conjugated streptavidin and phosphatase substrate. Data are representative of five independent experiments. (F and G) Competitive ELISA. (F) Binding of biotinylated CD72c CTLD to Sm/RNP in the presence of various concentrations of unbiotinylated CD72a and CD72c CTLD proteins was measured. Representative data of five independent experiments are shown. (G) Mean ± SD of percent inhibition of binding in the presence of 100 µg/ml of the indicated competitors in triplicate is shown. **, P < 0.01 (two-tailed Student’s t test).
Figure 2.
Figure 2.
SPR analysis of the binding of CD72a CTLD and CD72c CTLD to Sm/RNP. (A and B) SPR sensorgrams representing binding of Sm/RNP to immobilized recombinant CD72a CTLDc/s (A) and CD72c CTLDc/s (B) proteins. The indicated concentrations of Sm/RNP were injected over the sensor chip. Arrows and arrowheads indicate the beginning of association and dissociation phases, respectively. RU, resonance units. (C) The kinetic parameter association rate constant (kon) and dissociation rate constant (koff) were determined by BIAevaluation software. KD values were calculated from kon and koff values. A molecular weight of Sm/RNP was assumed to be 250 kD to calculate the kinetic parameters. Data are representative of two independent experiments.
Figure 3.
Figure 3.
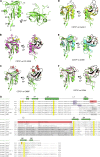
Structure of CD72a CTLD and comparisons to other CTLDs. (A) Overall structure of CD72a CTLD represented as a ribbon diagram. Disulfide bonds are shown as a stick model. Secondary structures are indicated. Representative data of five independent experiments are shown. (B–F) Ribbon models of CTLDs of DC-SIGN (B), EMBP (C), dectin-1 (D), CD69 (E), and CD94 (F) are represented as magenta, gray, yellow, cyan, and pink, respectively, and superposed on that of CD72a CTLD (green). The bound carbohydrate chains are represented as a stick model. The Ca2+ ions for DC-SIGN and sulfate ions for EMBP are represented as a CPK model. The structures between the α2 helix and the β3 strand are colored as red (CD72a) and black (other CTLDs). (G) Amino acid sequences of CTLDs of mouse CD72a, mouse CD72c, human CD72, human CD69, mouse dectin-1, human CD94, human DC-SIGN, and human EMBP are manually aligned based on their crystal structures. Among 17 groups of CTLDs classified on the basis of their domain organization and phylogeny, CD72, CD69, dectin-1, and CD94 are members of the group V CTLDs. DC-SIGN and EMBP belong to groups II and XII, respectively. The conserved cysteine residues are shown in yellow. The cysteine residues of CD72a shown in orange are substituted by serine residues in CD72 CTLD proteins used for crystallographic study. The secondary structures of CD72a CTLD are indicated above the sequences. Variable secondary structure regions between the α2 helix and β3 strand are highlighted as red (CD72a) and gray (other CTLDs). The aromatic residues clustered at the L1 loop are shown in purple.
Figure 4.
Figure 4.
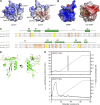
Surface charge distribution of CD72c CTLD is different from that of CD72a CTLD. (A and B) Electrostatic surface representation of CD72a and CD72c CTLDs (A) and EMBP and DC-SIGN (B) around the putative ligand-binding area. The viewpoint is the same as in Fig. 3 A (right). The color of the surface potentials is represented in the scale ranging from negatively (red) to positively (blue) charged. The positions of the substituted basic residues between CD72a and CD72c at the β3 strand are indicated by allows. The bound carbohydrates and ions (sulfate in EMBP and Ca2+ in DC-SIGN) are represented as stick and CPK models, respectively. (C) Amino acid sequence alignment of CD72a and CD72c CTLDs with the secondary structures of CD72a CTLD. Substituted residues are highlighted in orange. The basic residues at the β3 and β4 strands of CD72a shown in blue are substituted in CD72c. The conserved cysteine residues are shown in yellow. (D) Residues in CD72a CTLD, which are substituted in CD72c CTLD, are represented as the stick model (orange) in the structure of CD72a CTLD. (E) Elution profiles of CD72a and CD72c CTLD proteins on a cation exchange column. Proteins were eluted with a linear gradient of NaCl (0–1 M) in 50 mM Tris-HCl, pH 8.5. Representative data of two independent experiments are shown. mAU, milli–absorbance units.
Figure 5.
Figure 5.
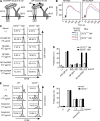
CD72 specifically regulates B cell responses to Sm/RNP. (A) Schematic representation of the experimental design to address B cell responses to Sm/RNP using anti-NP B cells and NP-Sm/RNP. Stimulation of anti-NP B cells from QM mice with NP-Sm/RNP (right) mimics that of anti-Sm/RNP B cells with Sm/RNP (left). (B) Ca2+ signaling. Fluo-4/AM–loaded spleen B cells from CD72+/+ and CD72−/− QM mice were stimulated with the indicated concentrations (Ag conc.) of NP-BSA or NP-Sm/RNP, and the intracellular free calcium ion level was measured by flow cytometry for 300 s. The arrows indicate the time point when NP-BSA and NP-Sm/RNP were added. Data are representative of five independent experiments. (C–F) B cell proliferation. Purified B cells from CD72+/+ and CD72−/− QM mice (C and D) or CD72+/+ (WT) and CD72−/− C57BL/6 mice (E and F) were labeled with CFSE and cultured with indicated concentrations of anti-IgM, NP-BSA, and NP-Sm/RNP (C and D) or LPS and imiquimod (E and F) for 48 (C and D) or 72 (E and F) h. CFSE fluorescence was measured by flow cytometry. (C and E) The percentages of proliferated cells are indicated. (D and F) Mean ± SD of triplicates is shown. Data are representative of five independent experiments. Ab, antibody.
Figure 6.
Figure 6.
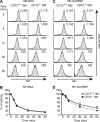
CD72 specifically regulates endocytosis of Sm/RNP. (A–D) Splenic B cells from CD72+/+ and CD72−/− QM B cells were incubated with NP-BSA (A and B) or NP-Sm/RNP (C and D) on ice for 30 min. After washing, cells were incubated at 37°C for the indicated time and analyzed for remaining NP-BSA (A and B) and NP-Sm/RNP (C and D) on the cell surface by flow cytometry. (A and C) Mean fluorescence intensity is indicated. (B and D) Percentages of remaining NP-BSA (B) and NP-Sm/RNP (D) are calculated. Mean ± SD of triplicates is shown. Data are representative of four independent experiments. *, P < 0.05; **, P < 0.01 (two-tailed Student’s t test).
Figure 7.
Figure 7.
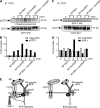
NP-Sm/RNP induces phosphorylation and SHP-1 recruitment of CD72 in NP-reactive B cells. (A–D) The B cell line BAL17-9T13 that expresses anti-NP BCR was treated with NP-BSA, NP-Sm/RNP, or a combination of NP-BSA and Sm/RNP for the indicated time, and lysates were immunoprecipitated (IP) with anti-CD72 antibody. Phosphorylated CD72 (pCD72; A) and SHP-1 (C) in the immunoprecipitates were analyzed by Western blotting. The intensities of protein bands for total CD72 (B and D), phosphorylated CD72 (B), and SHP-1 (D) were quantified and expressed as fold-change relative to unstimulated cells (0 min). Data are representative of four independent experiments. (E) Schematic representation of the mechanisms for CD72-mediated signal regulation. Coligation of CD72 with BCR mediated by Sm/RNP (left) but not independent ligation of CD72 and BCR (right) induces CD72 phosphorylation by BCR-associated kinases such as Lyn. The requirement of coligation restricts CD72-mediated signal inhibition only in Sm/RNP-reactive B cells. P, phosphate group; Y, tyrosine residue.
Figure 8.
Figure 8.
CD72 specifically regulates antibody production to Sm/RNP. (A–I) WT and CD72−/− female C57BL/6 mice (9 wk old) were immunized with Sm/RNP (n = 4–5 per group; A–C) and NP-CGG (n = 6 per group; D-I). After 14 d, serum levels of total IgM (A and D), total IgG (G), and titers of anti-Sm/RNP IgM (B), anti-NP IgM (E), and IgG (H) were measured by ELISA. Pooled MRL.Faslpr/lpr sera (1,000 U/ml), monoclonal anti-NP IgM B1-8, and anti-NP IgG C6 were used as standards to determine the titers of anti-Sm/RNP IgM and concentrations of anti-NP IgM and anti-NP IgG. (C, F, and I) The ratio of the amount of antigen-specific Ig to total Ig was calculated. *, P < 0.05; **, P < 0.01 (Brunner-Munzel test).

References

    1. Adachi T., Flaswinkel H., Yakura H., Reth M., and Tsubata T.. 1998. The B cell surface protein CD72 recruits the tyrosine phosphatase SHP-1 upon tyrosine phosphorylation. J. Immunol. 160:4662–4665. - PubMed
    1. Adachi T., Wakabayashi C., Nakayama T., Yakura H., and Tsubata T.. 2000. CD72 negatively regulates signaling through the antigen receptor of B cells. J. Immunol. 164:1223–1229. 10.4049/jimmunol.164.3.1223 - DOI - PubMed
    1. Adams P.D., Afonine P.V., Bunkóczi G., Chen V.B., Davis I.W., Echols N., Headd J.J., Hung L.W., Kapral G.J., Grosse-Kunstleve R.W., et al. . 2010. PHENIX: a comprehensive Python-based system for macromolecular structure solution. Acta Crystallogr. D Biol. Crystallogr. 66:213–221. 10.1107/S0907444909052925 - DOI - PMC - PubMed
    1. Beckett D., Kovaleva E., and Schatz P.J.. 1999. A minimal peptide substrate in biotin holoenzyme synthetase-catalyzed biotinylation. Protein Sci. 8:921–929. 10.1110/ps.8.4.921 - DOI - PMC - PubMed
    1. Berland R., Fernandez L., Kari E., Han J.H., Lomakin I., Akira S., Wortis H.H., Kearney J.F., Ucci A.A., and Imanishi-Kari T.. 2006. Toll-like receptor 7-dependent loss of B cell tolerance in pathogenic autoantibody knockin mice. Immunity. 25:429–440. 10.1016/j.immuni.2006.07.014 - DOI - PubMed

Publication types

MeSH terms