. 2016 Dec 14;36(50):12729-12745.
doi: 10.1523/JNEUROSCI.0237-16.2016. Epub 2016 Nov 3.

Neurophysiological Organization of the Middle Face Patch in Macaque Inferior Temporal Cortex

Affiliations

Neurophysiological Organization of the Middle Face Patch in Macaque Inferior Temporal Cortex

Paul L Aparicio et al. J Neurosci. .

Abstract

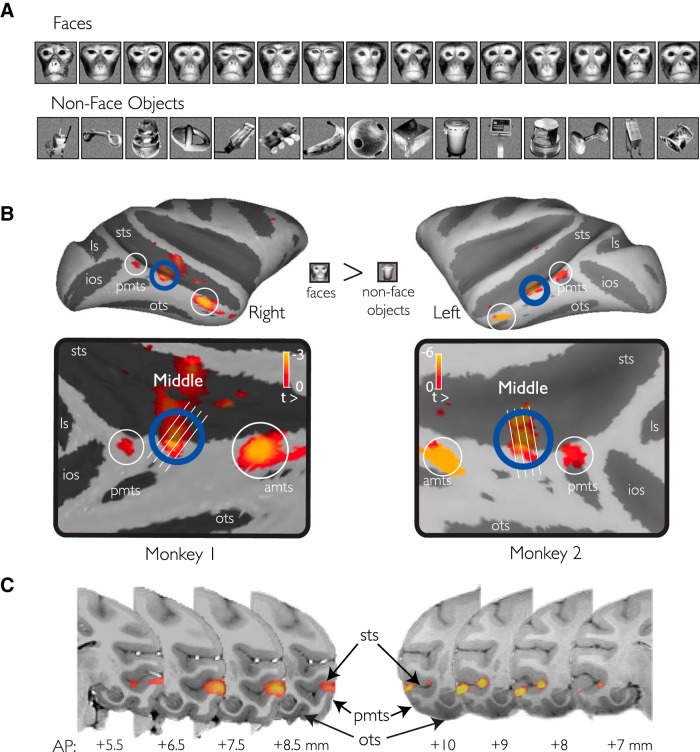
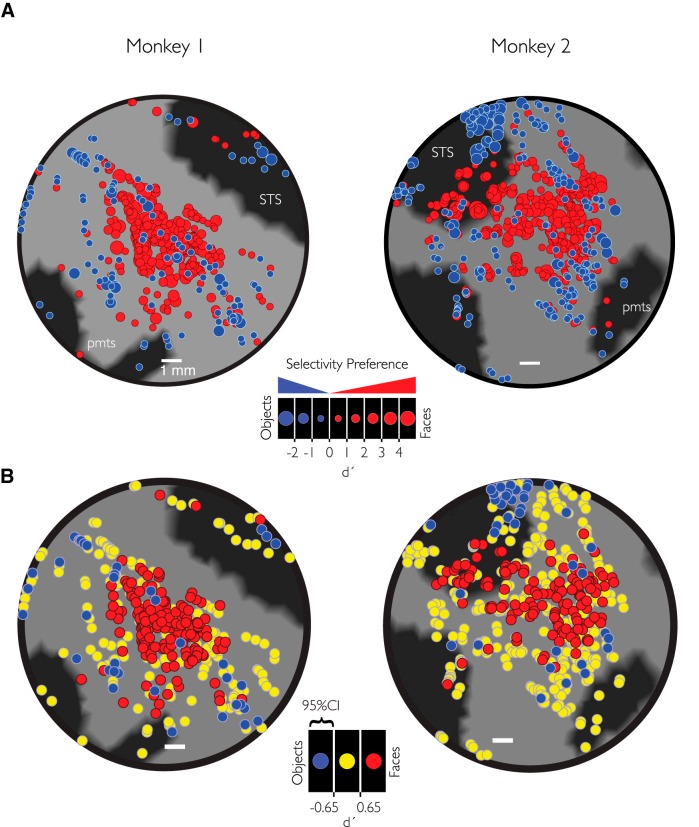
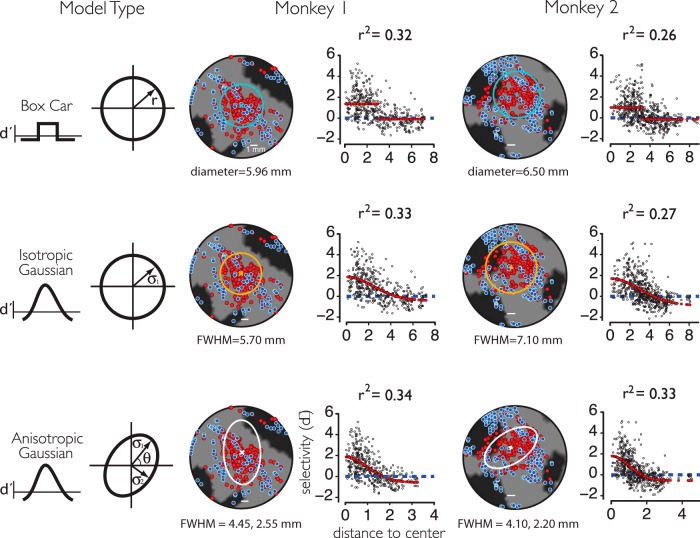
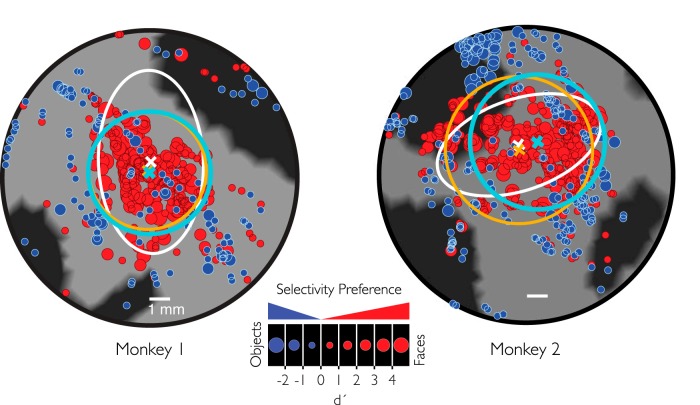
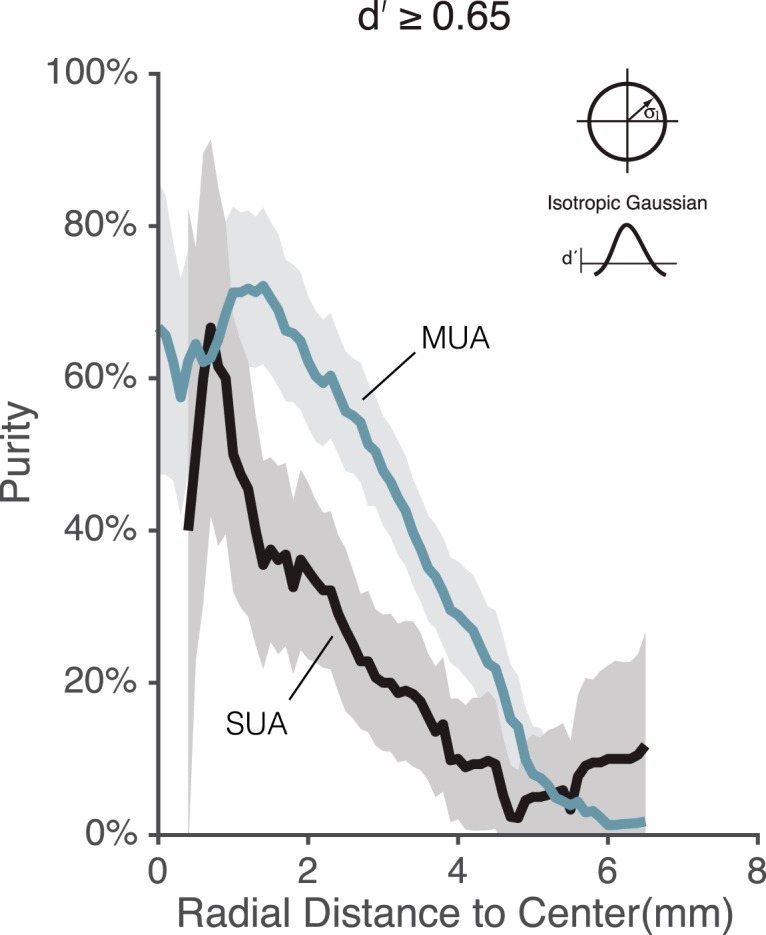
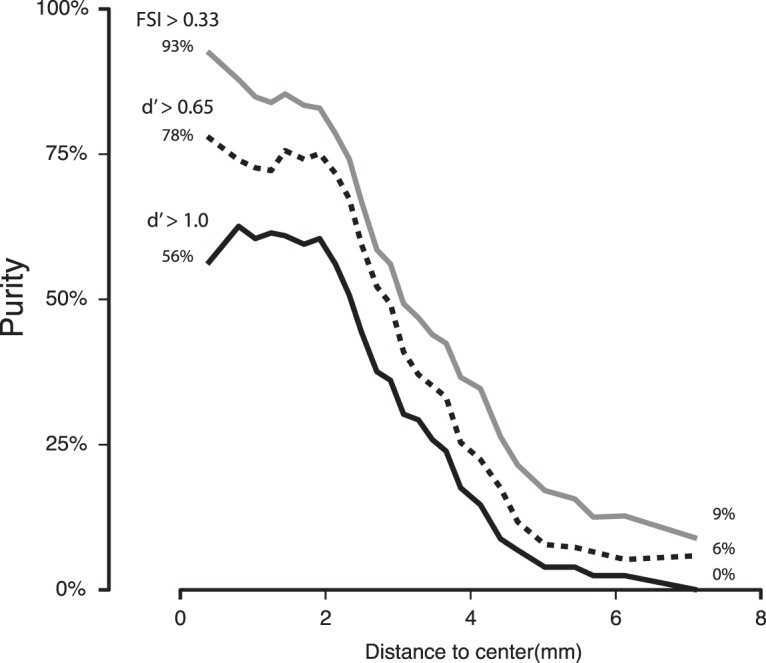
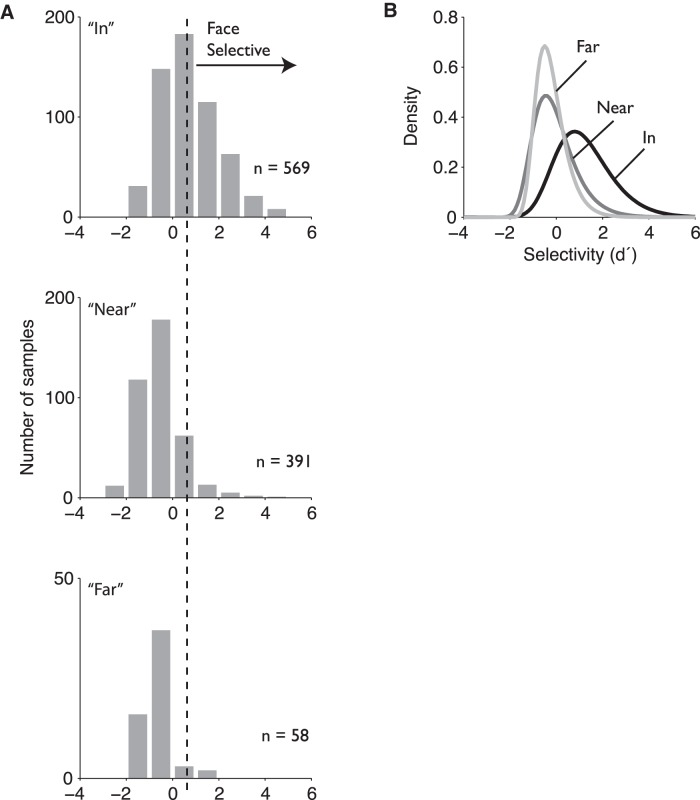
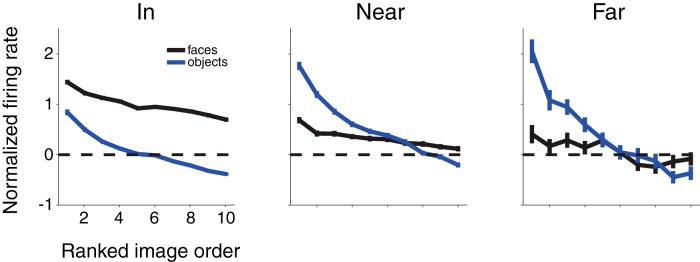
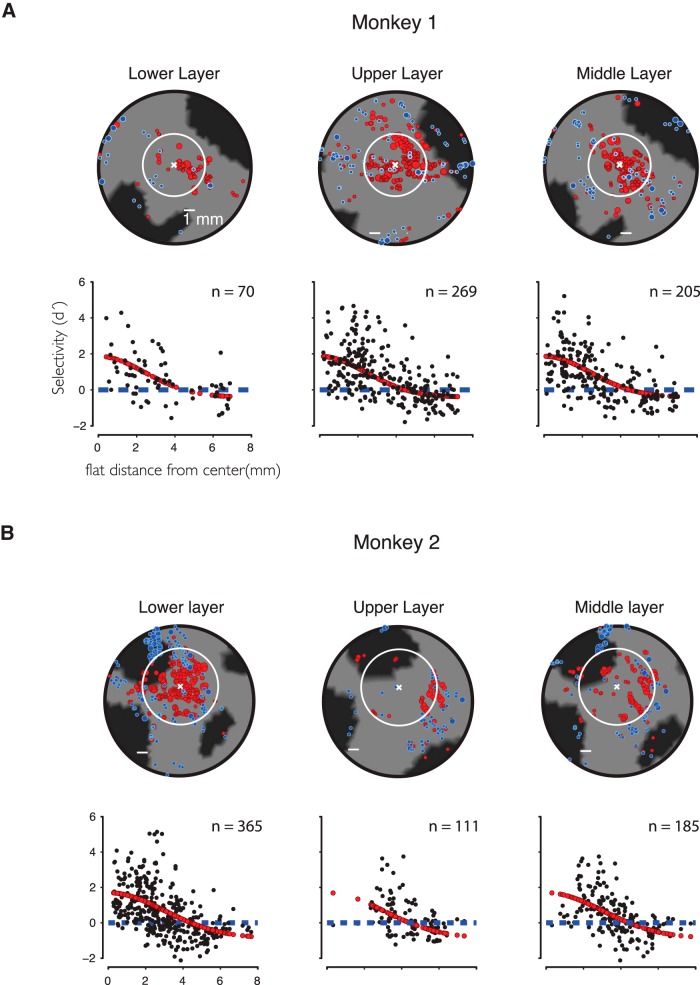
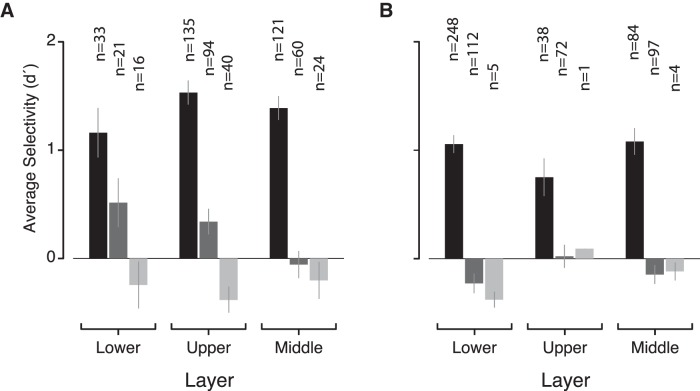
While early cortical visual areas contain fine scale spatial organization of neuronal properties, such as orientation preference, the spatial organization of higher-level visual areas is less well understood. The fMRI demonstration of face-preferring regions in human ventral cortex and monkey inferior temporal cortex ("face patches") raises the question of how neural selectivity for faces is organized. Here, we targeted hundreds of spatially registered neural recordings to the largest fMRI-identified face-preferring region in monkeys, the middle face patch (MFP), and show that the MFP contains a graded enrichment of face-preferring neurons. At its center, as much as 93% of the sites we sampled responded twice as strongly to faces than to nonface objects. We estimate the maximum neurophysiological size of the MFP to be ∼6 mm in diameter, consistent with its previously reported size under fMRI. Importantly, face selectivity in the MFP varied strongly even between neighboring sites. Additionally, extremely face-selective sites were ∼40 times more likely to be present inside the MFP than outside. These results provide the first direct quantification of the size and neural composition of the MFP by showing that the cortical tissue localized to the fMRI defined region consists of a very high fraction of face-preferring sites near its center, and a monotonic decrease in that fraction along any radial spatial axis.

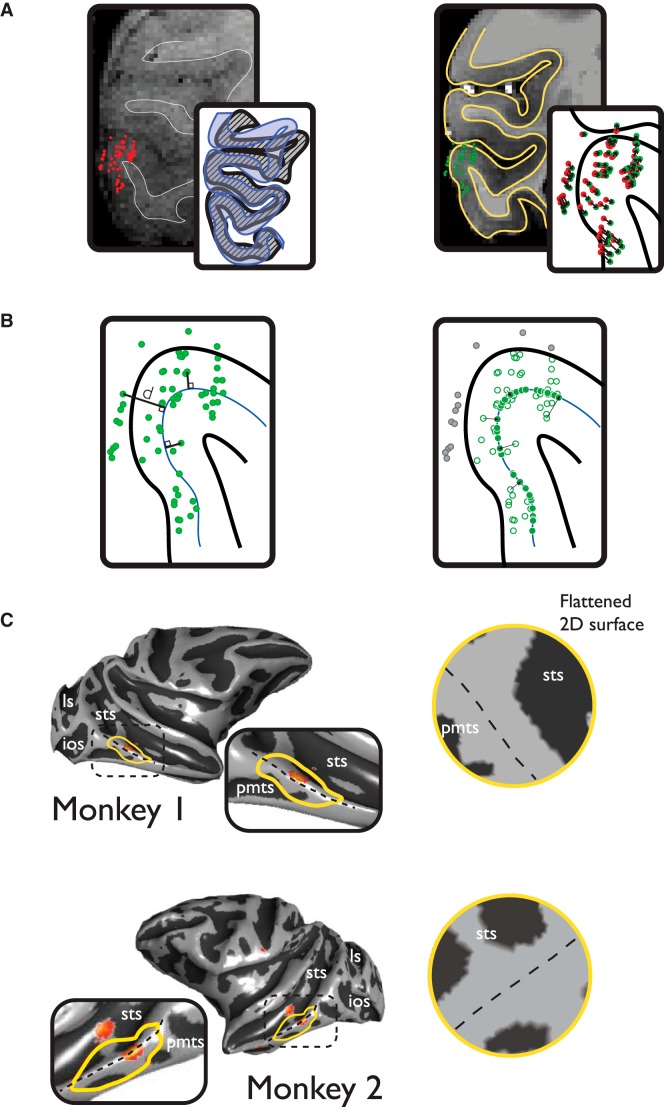
Significance statement: The underlying organization of neurons that give rise to the large spatial regions of activity observed with fMRI is not well understood. Neurophysiological studies that have targeted the fMRI identified face patches in monkeys have provided evidence for both large-scale clustering and a heterogeneous spatial organization. Here we used a novel x-ray imaging system to spatially map the responses of hundreds of sites in and around the middle face patch. We observed that face-selective signal localized to the middle face patch was characterized by a gradual spatial enrichment. Furthermore, strongly face-selective sites were ∼40 times more likely to be found inside the patch than outside of the patch.

Keywords: faces; inferior temporal cortex; monkey; neurophysiology; spatial organization.


Figures

Figure 1.
Figure 1.
fMRI localization of face-selective patches. A, Conventional images of macaque faces and familiar everyday objects used to localize face-selective regions in the temporal lobe. Subsets of these images were also used in the neurophysiology experiments. B, Three fMRI-identified patches were found on the convexity of the lower bank of the STS. C, The MFP was observed consistently across both animals on the convexity of the STS (e.g., crown of the ITG). Only positive valued signal change to the faces-objects contrast is shown and only for voxels that were more significantly driven by the presentation of object images over scrambled versions of those images.
Figure 2.
Figure 2.
Spatial registration and analysis methods. The 3D spatial locations of all sampled sites in the MFP region were estimated with a custom-built stereoscopic x-ray imaging system. The 3D locations were registered (A, left) to a high-resolution (500 μm) anatomical MRI. Anatomical variability before (gray cortical ribbon; left, inset) and after neurophysiological recordings (blue cortical ribbon, left inset) can result in subpixel registration error. To improve the overall accuracy of the registration, nonlinear registration using FMRIB's FNIRT registration tool was performed (A, right), and the resulting transform was applied to the estimated positions of the recording sites (A, inset represents the overall spatial movement of sites projected in a 2D slice). The spatial position of each recording site was projected to the closest orthogonal node of a high-resolution mid-layer mesh of the cortical surface (B, left). Sites that moved a distance >1250 μm from their original 3D position to the 2D surface manifold were excluded (B, right, gray dots) from further analysis. The area for analysis was selected by choosing the approximate center of the fMRI MFP activation in each monkey and including all nodes on the cortical mesh within a maximal geodesic radius (7 mm). The radius was chosen to be approximately the greatest distance that would not encroach into face-selective activations at posterior (PL) or anterior (AL) locations.
Figure 3.
Figure 3.
pMFP contains an enrichment of face-preferring sites. A, Flattened 2D regions of the temporal lobe highlight category preference. Red represents sites that prefer faces over objects. Blue represents sites that prefer objects over faces. M1, n = 425; M2, n = 565 multiunit sites. The size of each circle represents the strength of selectivity at each site. B, Distribution of highly category-selective sites. Red or blue sites responded preferentially to faces (d′ > 0.65) or objects (d′ < 0.65), respectively. Yellow represents sites where the 95% CI of the site's selectivity metric fell within [−0.65, 0.65] and thus is not significantly above (or below) those two thresholds. Scale bars represent 1 mm.
Figure 4.
Figure 4.
2D models of the spatial organization of face selectivity on the pMFP. Three models (rows: box car, isotropic Gaussian, and anisotropic Gaussian) for the spatial structure of the pMFP were used to fit the category selectivity and 2D spatial position over all multiunit samples. Column 1 summarizes each model and their 2D spatial parameters parameters (see Materials and Methods). Column 2 (monkey 1) and column 3 (monkey 2) summarize the results in each subject. The best fit models are displayed as outlines on the flattened 2D cortical maps (left) with the estimated size parameter for each model type underneath. In addition, the collapsed, 1D selectivity profiles (right) as a function of radial distance are shown (black dots represent individual sites), and the collapsed model prediction is overlaid in red. Abscissa units are in millimeters for the box car and isotropic Gaussian models (rows 1–2) and in number of SDs for the anisotropic Gaussian model (row 3) since the isocontours for this model were not radially symmetric. Variance explained was calculated as the correlation of the model predictions (red) with the individual site d' values (black dots) at the corresponding location (values were not corrected for noise in the neural data, but see Fig. 6 for estimates of noise levels). Scale bars represent 1 mm.
Figure 5.
Figure 5.
Low-frequency 2D spatial models of the pMFP are largely consistent. The spatial location and category preference for each recording site are localized on 2D flattened surfaces of the fMRI-identified MFP region. The different best fit models from our analysis are largely consistent in their estimate of the center and the spatial extent of the enriched region. Scale bars represent 1 mm.
Figure 6.
Figure 6.
Variance in selectivity estimated at nearby spatial locations in the MFP. Bar graph represents the average squared difference in face selectivity between sites recorded on the same electrode and <500 μm apart from each other. The average difference between sites expected simply from the use of a limited number of image exemplars or trials is also depicted for comparison. Error bars indicate the 95% CI on the estimate. Black and gray bars represent Subjects 1 and 2, respectively.
Figure 7.
Figure 7.
Direct comparison of d′ and FSI contrast metrics. Absolute values of d′ depend critically on how one defines response variance (see Materials and Methods). The FSI metric displays an approximately linear relationship to selectivity measured with d′. In our data, an FSI ∼ 1/3 is equivalent to a range of d′ values with a median of 0.65. Most of these sites with a d′ > 0.65 have a face image preference significantly different from zero (422 of 424 sites with d′ > 0.65 had a bootstrapped 95% CI >0).
Figure 8.
Figure 8.
Functional selectivity and purity estimates in the pMFP as a function of spatial size. Estimates of the fraction of category-selective multiunit sites in the MFP (the purity) could range from 94% to 58% depending on the distance from the center of the patch. These ranges varied due to both the model and metric used to define the patch. Purity estimates based on an FSI > 0.33 led to higher overall purity estimates than those based on a comparable d′. Overall, the purity falls off gradually from the center of the patch to cortical regions outside the patch. Dotted lines indicate the radial average distance from the center, which defines the qualitative distance categories: “in,” “near,” and “far,” where “in” is defined as less than radius value determined in the model fit and “far” is > 2 times the radius value. Small vertical lines on the abscissa indicate 1 and 2 times the radius value for each subject by model type.
Figure 9.
Figure 9.
Comparison between single-unit and multiunit purity estimates in the pMFP as a function of spatial size. Spike waveforms from Subject M2 were sorted to provide SUA. Using the center of the isotropic Gaussian model fit to the MUA data, we plotted the fraction of face-selective sites (purity) for both MUA (gray line) and SUA (black line) as a function of distance from the center. In both cases, a site was defined as face-selective if its d′ was ≥0.65. Both MUA and SUA produced a gradual fall-off in purity over a similar spatial range, although MUA data showed slightly higher d′ values and thus slightly higher purity estimates. Gray line indicates Monkey 2 curve in Fig. 8, but using sliding 1-mm-wide spatial bins to exactly match the procedure applied to the SUA. Error bands indicate the SEM of the estimated purity values determined by bootstrap (see Materials and Methods).
Figure 10.
Figure 10.
Average spatial profile of the number of face-selective sites in the pMFP. We estimated the purity collapsed across both animals using the estimated center from the isotropic Gaussian spatial model. The empirical purity function across both animals is remarkably consistent in shape across different selectivity estimators. The plot represents the proportion of face-selective sites across both animals under various criteria for face selectivity. Not surprisingly, weaker thresholds resulted in higher estimates of the purity near the center and far outside the pMFP.
Figure 11.
Figure 11.
Distributions of face selectivity inside and outside of the pMFP. A, Distributions of the estimated face selectivity from multiunit samples in and out of the pMFP have similar distributional forms but are mean shifted and differ in their variability. B, Units outside the pMFP (light gray) appear to occupy a relatively narrow range of category-selective values (at least for this image set), with the majority of values near zero, whereas sites in the pMFP (black) are characterized by a broad range of selectivity and extreme positive values.
Figure 12.
Figure 12.
Selectivity across face and object images inside and outside the pMFP. Site-by-site image responses were normalized by the site's maximum absolute response across all images and then ranked using independent data (within face or nonface image groupings; see Materials and Methods) before averaging over all sites and both monkey subjects in each of the three anatomical regions described previously (“In,” “Near,” and “far”; based on distances of 1 and 2 SDs of the fit isotropic Gaussian model). The responses to all face (black curves) and nonface objects (blue) are shown for sites in the “in,” “near,” and “far” regions. In the pMFP, the best driving face image gave a greater response than the best driving object exemplar; and outside the pMFP (middle and right panels), the response to the best driving face image was far exceeded by the response to the best driving object exemplar. To prevent any bias, images were rank-ordered on a held-out set of trials, and the remaining trials were used for plotting rank-ordered responses.
Figure 13.
Figure 13.
Upper and lower regions of the cortical ribbon show similar selectivity profiles. Dividing sites that could be reliably (see Materials and Methods) localized in the “upper” or “lower” layers did not reveal additional spatial structure. For comparison, sites localized to within 1 mm of the middle of the cortical ribbon were used to create a “middle layer.” These sites could overlap upper and lower layer sites. A, Monkey 1. B, Monkey 2. Scale bars represent 1 mm.
Figure 14.
Figure 14.
Face selectivity estimates for upper, lower, and middle cortical layers. Separating sites by upper and lower layers produces similar selectivity estimates of the average selectivity in the “in,” “near,” and “far” regions (black, dark gray, and light gray bars, respectively), in either subject (A: Monkey 1; B: Monkey 2).

Similar articles

Cited by

References

    1. Afraz A, Boyden ES, DiCarlo JJ. Optogenetic and pharmacological suppression of spatial clusters of face neurons reveal their causal role in face gender discrimination. Proc Natl Acad Sci U S A. 2015;112:6730–6735. doi: 10.1073/pnas.1423328112. - DOI - PMC - PubMed
    1. Baylis GC, Rolls ET, Leonard CM. Functional subdivisions of the temporal lobe neocortex. J Neurosci. 1987;7:330–342. - PMC - PubMed
    1. Bell AH, Hadj-Bouziane F, Frihauf JB, Tootell RB, Ungerleider LG. Object representations in the temporal cortex of monkeys and humans as revealed by functional magnetic resonance imaging. J Neurophysiol. 2009;101:688–700. doi: 10.1152/jn.90657.2008. - DOI - PMC - PubMed
    1. Bell AH, Malecek NJ, Morin EL, Hadj-Bouziane F, Tootell RB, Ungerleider LG. Relationship between functional magnetic resonance imaging-identified regions and neuronal category selectivity. J Neurosci. 2011;31:12229–12240. doi: 10.1523/JNEUROSCI.5865-10.2011. - DOI - PMC - PubMed
    1. Cox DD, Papanastassiou AM, Oreper D, Andken BB, DiCarlo JJ. High-resolution three-dimensional microelectrode brain mapping using stereo microfocal X-ray imaging. J Neurophysiol. 2008;100:2966–2976. doi: 10.1152/jn.90672.2008. - DOI - PubMed

LinkOut - more resources