. 2016 Nov 4;354(6312):aag0839.
doi: 10.1126/science.aag0839.

Exploring genetic suppression interactions on a global scale

Affiliations

Exploring genetic suppression interactions on a global scale

Jolanda van Leeuwen et al. Science. .

Abstract

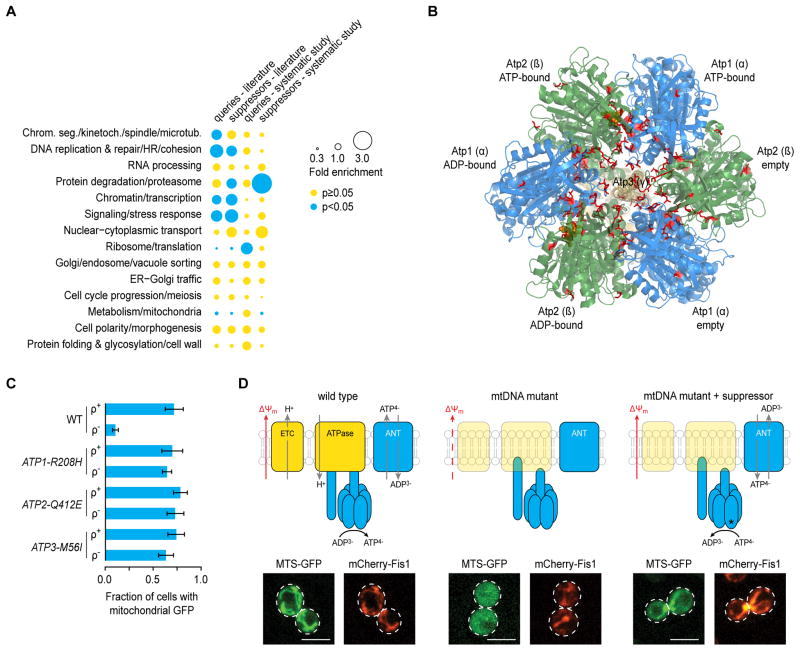
Genetic suppression occurs when the phenotypic defects caused by a mutation in a particular gene are rescued by a mutation in a second gene. To explore the principles of genetic suppression, we examined both literature-curated and unbiased experimental data, involving systematic genetic mapping and whole-genome sequencing, to generate a large-scale suppression network among yeast genes. Most suppression pairs identified novel relationships among functionally related genes, providing new insights into the functional wiring diagram of the cell. In addition to suppressor mutations, we identified frequent secondary mutations,in a subset of genes, that likely cause a delay in the onset of stationary phase, which appears to promote their enrichment within a propagating population. These findings allow us to formulate and quantify general mechanisms of genetic suppression.


Figures

Fig. 1
Fig. 1. A global network of literature-curated suppression interactions for S. cerevisiae.
(A) Genetic interaction classes. When two single mutants (xxxΔ and yyyΔ) have a relative fitness of 0.8 and 0.7, the expected fitness of the resultant double mutant (xxxΔ yyyΔ) based on a multiplicative model is 0.8 × 0.7 = 0.56. A negative genetic interaction occurs when the observed double mutant fitness is lower than this expected fitness. A masking positive interaction occurs when the fitness of the double mutant is greater than expected, but lower or equal to that of the slowest growing single mutant. Suppression positive interactions occur when the double mutant fitness is greater than that of the slowest growing single mutant. (B) A global network of literature-curated suppression interactions for S. cerevisiae. Genes are represented as nodes and interactions as edges. The nodes were distributed using a force-directed layout, such that genes that share a suppressor tend to be close together on the network. Genes involved in chromatin and transcription or DNA replication and repair are highlighted in magenta and cyan, respectively. (C,D) Regions of the global network highlighting suppression interactions between complexes and pathways involved in chromatin and transcription (C) or DNA replication and repair (D) are shown. Arrows point from the suppressor to the query.
Fig. 2
Fig. 2. Properties of the suppression network
(A) Frequency of suppression interactions connecting genes within and across indicated biological processes. Node size reflects fold enrichment for interacting gene pairs observed for a given pair of biological processes. Significance of the enrichment was determined by Fisher’s Exact test, comparing the observed frequency of suppression interactions between two given functional categories with the global frequency. The total number of suppression interactions involving genes annotated to a particular process in indicated. (B,C) Fold enrichment for: (B) co-localization, GO co-annotation, co-expression, same pathway membership, and same complex membership for gene pairs involved in different types of genetic interaction (GI); and (C) overlap of literature-curated suppression interactions with dosage suppression interactions (13), or with negative and positive genetic interactions identified by SGA analysis using either an intermediate or a stringent interaction score threshold (6). A Fisher’s Exact test was performed to determine statistical significance of the results. (D) An example of a gene pair showing suppression, dosage suppression, and negative genetic interactions.
Fig. 3
Fig. 3. The mitochondrial F1-ATPase is a suppressor hub in the systematic suppression network
(A) The distribution of query and suppressor mutants in both the literature-curated and the systematic experimental network across different biological processes. Node size reflects fold enrichment or depletion for query and suppressor mutants observed for a given biological processes. Significant enrichment or depletion was determined by Fisher’s Exact test, comparing the observed to the expected proportion of genes in each functional category. Bonferroni-corrected p-values are indicated. (B) Bottom-view, facing the inner-membrane from the mitochondrial matrix, of the yeast mitochondrial F1-ATPase structure 2HLD. Residues that were found to suppress the growth defect of mitochondrial transcription or translation mutants are highlighted in red. Orange spheres represent the nucleotides bound to the catalytic sites. (C) Fraction of wild type and ATP synthase-mutant cells either with intact (ρ+) or (partially) deleted (ρ) mtDNA that show mitochondrial localization of GFP fused to a mitochondrial-targeting signal (MTS-GFP). Averages (n=4) and SD are shown. (D) Model of ATP synthase-dependent suppression of mitochondrial mutants (top) and corresponding representative images of MTS-GFP import (bottom). Localization of outer-mitochondrial membrane protein mCherry-Fis1 shows the presence and position of mitochondria. Abbreviations: ETC, electron transport chain; ΔΨ m, inner mitochondrial membrane potential; ANT, adenine nucleotide translocator. Scale bar: 5μm.
Fig. 4
Fig. 4. Characterization of YMR010W (ANY1)
(A) Predicted membrane topology of Ymr010w. Sites of suppressor mutations, ubiquitination and phosphorylation are indicated. (B) Suppression of the growth defect caused by a mon2Δ deletion allele, or TS alleles dop1-1 and neo1-2, by deletion of YMR010W. Series of ten-fold dilutions of exponentially growing cultures of the indicated strains were spotted on YPD plates and incubated at either 22°C or 38°C for 2 days. (C) Deletion of YMR010W restores membrane asymmetry in neo1-2 cells. Wild type, ymr010wΔ, neo1-2 and neo1-2 ymr010wΔ cells were grown at 34°C in the presence of the phosphatidylserine (PS) targeting peptide papuamide A or the phosphatidylethanolamine (PE) targeting peptide duramycin. Growth relative to vehicle-treated wild type strain is plotted. SEM is indicated by shading (n=2–3). (D) Intracellular distribution of PS, visualized using GFP-lact-C2 (31). Shown are representative confocal fluorescent micrographs of exponentially growing cells using the indicated strains. The fraction of cells that showed diffuse cytosolic fluorescence, localization of GFP-lact-C2 to the plasma membrane, or in which GFP-lact-C2 was partially localized to distinct internal structures, was calculated. Measurements were performed in triplicate on at least 100 cells, and averages are shown. (E) Model of suppression of flippase mutants by loss of Ymr010w.
Fig. 5
Fig. 5. Characterization of potential passenger mutations
(A) Distribution of suppressor and potential passenger mutations over variant effect classes. Only SNPs are considered, as reliable structural variant calls (deletions, insertions, or inversions involving >5 basepairs) were only available for suppressor mutations. The RNA class refers to mutations in an RNA species such as a non-coding, ribosomal, or transfer RNA. (B) The fraction of all suppressor or potential passenger missense mutations that map to an essential gene, at a protein-protein interaction (PPI) interface, or a disordered region of a protein, and the predicted deleteriousness of these mutations (SIFT score 0 = extremely deleterious, 1 = benign). P-values were calculated using Fisher’s Exact test, except for the SIFT analysis, in which a Mann-Whitney’s test was used. (C) The percentage of strains in which a particular gene carries a passenger mutation is plotted against the chromosomal position of the gene. Genes that are recurrently mutated in >2% of the sequenced strains are highlighted, and the distribution of the mutations over variant effect classes is shown. (D) Differentially fluorescently labeled cells of the indicated mutants (RFP) and wild type (GFP) were mixed, and the ratio of RFP to GFP was followed for 6 rounds of serial passaging on agar plates. Shading represents the SD, n=12.
Fig. 6
Fig. 6. Mechanistic classes of suppression
(A) Suppressor and query genes often have a functional relationship (class “A”). In a situation where the query (protein A) activates a protein B, which is required for normal growth, suppression can take place in multiple ways. For example, the suppressor (protein C) can be part of the same complex as the query, and gain-of-function mutations in C can restore the activation of B (class “A1”). Alternatively, the suppressor and query may be members of the same pathway, and the suppressor (protein D) may inactivate or inhibit B. Loss of D may thus suppress by partially restoring the activity of B (class “A2”). The suppressor (protein E) can also function in an alternative, but related, pathway, whose activity can be slightly altered to restore the activity of B (class “A3”). Suppression interactions can also occur among pairs of genes that do not share a close functional relationship. For example, partial loss-of-function query alleles may carry mutations that destabilize the protein or mRNA, leading to a fitness defect caused by reduced levels of the query protein. This can be suppressed by a loss-of-function mutation in a member of the protein degradation (class “B”) or mRNA decay (class “C”) pathway, which may partially restore the levels of the query protein. (B) Distribution of suppression interactions, positive genetic interactions (6), and passenger-query pairs across different mechanistic suppression classes.

References

    1. Dixon SJ, Costanzo M, Baryshnikova A, Andrews B, Boone C. Systematic mapping of genetic interaction networks. Annu Rev Genet. 2009;43:601–625. - PubMed
    1. Costanzo M, et al. The genetic landscape of a cell. Science. 2010;327:425–431. - PMC - PubMed
    1. Chen R, et al. Analysis of 589,306 genomes identifies individuals resilient to severe Mendelian childhood diseases. Nat Biotechnol. 2016;34:531–538. - PubMed
    1. St Onge RP, et al. Systematic pathway analysis using high-resolution fitness profiling of combinatorial gene deletions. Nat Genet. 2007;39:199–206. - PMC - PubMed
    1. Breslow DK, et al. A comprehensive strategy enabling high-resolution functional analysis of the yeast genome. Nat Methods. 2008;5:711–718. - PMC - PubMed

Publication types

MeSH terms

Substances