. 2016 Nov 4;354(6312):630-634.
doi: 10.1126/science.aaf2679.

Injury-induced ctgfa directs glial bridging and spinal cord regeneration in zebrafish

Affiliations

Injury-induced ctgfa directs glial bridging and spinal cord regeneration in zebrafish

Mayssa H Mokalled et al. Science. .

Abstract

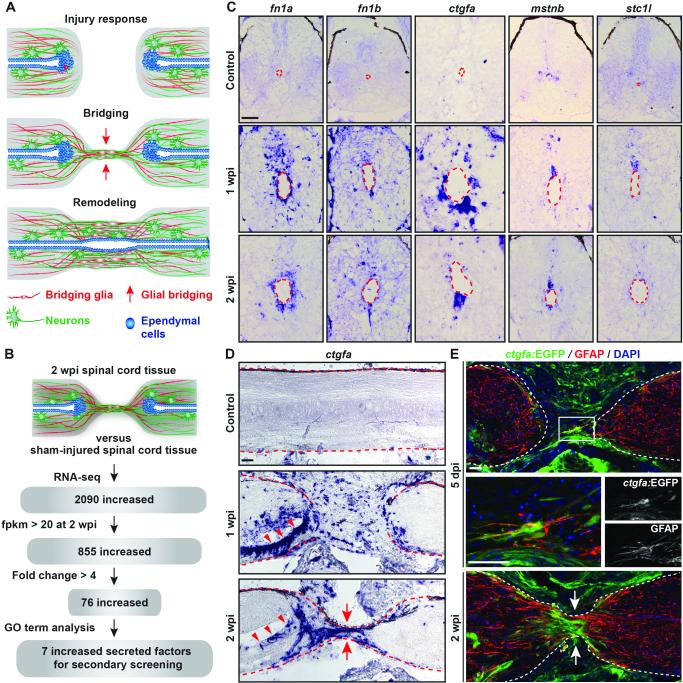
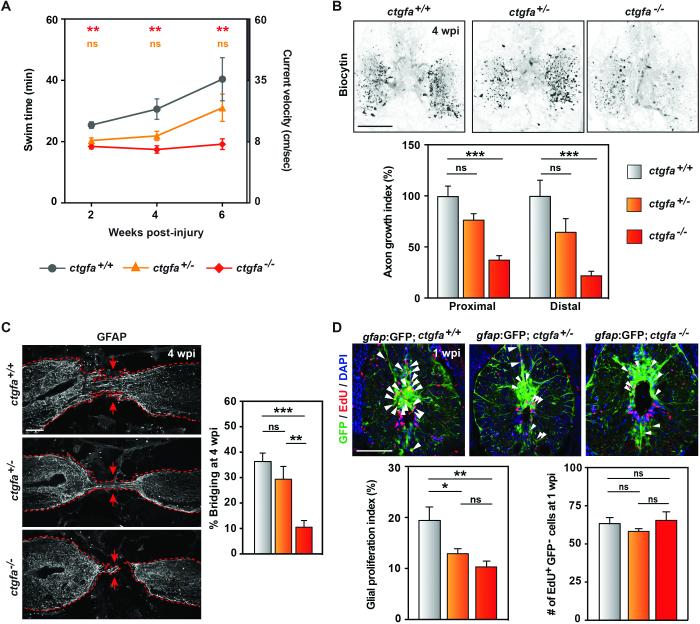
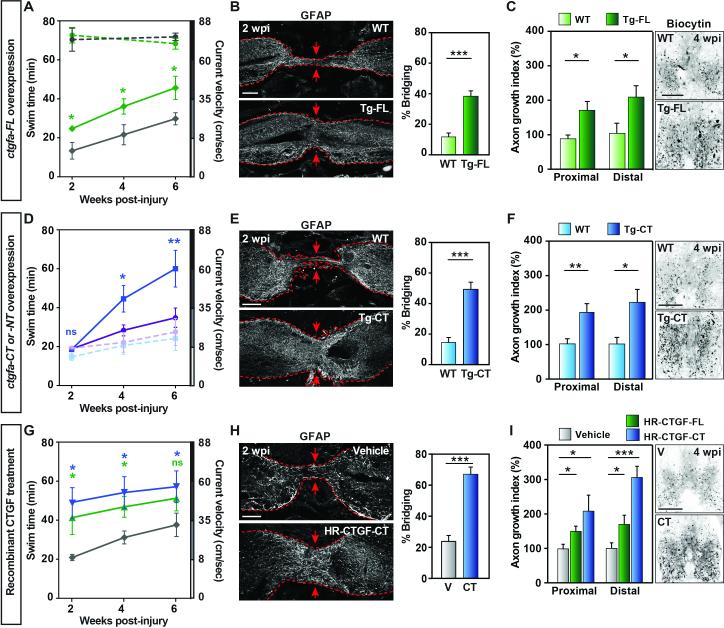
Unlike mammals, zebrafish efficiently regenerate functional nervous system tissue after major spinal cord injury. Whereas glial scarring presents a roadblock for mammalian spinal cord repair, glial cells in zebrafish form a bridge across severed spinal cord tissue and facilitate regeneration. We performed a genome-wide profiling screen for secreted factors that are up-regulated during zebrafish spinal cord regeneration. We found that connective tissue growth factor a (ctgfa) is induced in and around glial cells that participate in initial bridging events. Mutations in ctgfa disrupted spinal cord repair, and transgenic ctgfa overexpression or local delivery of human CTGF recombinant protein accelerated bridging and functional regeneration. Our study reveals that CTGF is necessary and sufficient to stimulate glial bridging and natural spinal cord regeneration.


Figures

Fig. 1
Fig. 1. Identification of ctgfa from a screen for regulators of spinal cord regeneration
(A) Schematic of the multi-step process of spinal cord regeneration in zebrafish. (B) A screen for secreted factors expressed during spinal cord regeneration. (C) In situ hybridization on spinal cord cross sections at 1 and 2 weeks post-injury (wpi) and in uninjured control tissue. Sections proximal to the lesion from the rostral side are shown, and dashed lines delineate the central canals. The canal dilates after injury. (D) ctgfa in situ hybridization on longitudinal spinal cord sections at 1 and 2 wpi, and in uninjured control tissue. (E) ctgfa:EGFP reporter expression and GFAP immunohistochemistry during early bridging events at 5 days post-injury (dpi; Top) and after bridge formation at 2 wpi (Bottom). (Middle) High-magnification view of boxed area in top panel. Dashed lines delineate spinal cord edges, arrows point to sites of bridging, and arrowheads point to ventral ependymal cells. Scale bars, 50 μm.
Fig. 2
Fig. 2. ctgfa is necessary for glial bridging and spinal cord regeneration
(A) Swim assays assessed animals’ capacity to swim against increasing water current inside an enclosed swim tunnel. Seven wild-type (ctgfa+/+), 10 ctgfa heterozygous (ctgfa+/−) and 10 mutant (ctgfa−/−) clutchmates were assayed at 2, 4, and 6 wpi. Statistical analyses of swim times are shown for ctgfa−/− (red) and ctgfa+/− (orange) compared to wild-types. Recovery of ctgfa−/− animals was not significant between 2 and 6 wpi. (B) Anterograde axon tracing in ctgfa mutant animals at 4 wpi. For quantification of axon growth at areas proximal (shown in images) and distal to the lesion core, 16 wild-type, 17 ctgfa+/−, and 20 ctgfa−/− zebrafish from 2 independent experiments were used. (C) GFAP immunohistochemistry in ctgfa mutant spinal cords at 4 wpi. Percent bridging was quantified for 10 wild-type, 9 ctgfa+/− and 10 ctgfa−/− clutchmates from 3 independent experiments. Dashed lines delineate glial GFAP staining, and arrows point to sites of bridging. (D) Glial cell proliferation in wild-type, ctgfa+/−, and ctgfa−/− spinal cords at 1 wpi. For quantification of glial proliferation indices (left) and number of EdU-positive gfap:GFP-negative cells (right), 10 wild-type, 12 ctgfa+/−, and 15 ctgfa−/− animals from 2 independent experiments were used. For statistical analyses, (*), (**) and (***) represent P-values of <0.05, <0.01, and <0.001, respectively; while (ns) indicates P-values > 0.05. Scale bars, 100 μm.
Fig. 3
Fig. 3. ctgfa promotes glial bridging and spinal cord regeneration
(A) Swim assays determined motor function recovery of 10 hsp70:ctgfa-FL (green) and 10 wild-type (gray) clutchmates at 2, 4, and 6 wpi. For sham controls, 8 ctgfa-FL-overexpressing (dashed green) and 7 wild-types (dashed gray) were analyzed. Statistical analyses of swim times are shown for injured ctgfa-FL (green) compared to wild-types. (B) GFAP immunohistochemistry was used to quantify glial bridging at 2 wpi in 18 ctgfa-FL-overexpressing and 16 wild-types from 3 independent experiments. (C) Anterograde axon tracing at 4 wpi after ctgfa-FL overexpression. Quantification at areas proximal (shown in images) and distal to the lesion core represents 12 ctgfa-FL-overexpressing and 10 wild-type zebrafish from 2 independent experiments. (D) Swim assays for 8 ctgfa-CT- overexpressing (blue), 10 ctgfa-NT-overexpressing (violet), and 9 wild-type clutchmate animals (wild-type controls for -CT in dashed blue and for -NT in dashed violet). Statistical analyses of swim times are shown for ctgfa-CT (blue) compared to wild-types. (E) Glial bridging at 2 wpi in 19 ctgfa-CT-overexpressing and 20 wild-type animals from 2 independent experiments. (F) Anterograde axon tracing at 4 wpi after ctgfa-CT overexpression. Quantification represents 16 ctgfa-CT-overexpressing and 16 wild-type animals from 2 independent experiments. (G) Swim capacity was assessed for 9 vehicle- (gray), 8 HR-CTGFFL- (green) and 9 HR-CTGF-CT- (blue) treated animals. Statistical analyses are shown for HRCTGF-FL (green) and HR-CTGF-CT (blue) treatments compared to vehicle controls. (H) Glial bridging at 2 wpi in 18 HR-CTGF-CT-treated and 15 vehicle-treated animals from 3 independent experiments. (I) Anterograde axon tracing at 4 wpi after HR-CTGF-CT treatment. Quantification represents 18 vehicle-, 16 HR-CTGF-FL- and 14 HR-CTGF-CT-treated animals from 2 independent experiments. For histology in (B, E, H), dashed lines delineate glial GFAP staining, and arrows point to sites of bridging. For statistical analyses, (*), (**), and (***) represent P-values of <0.05, <0.01, and <0.001 respectively. Scale bars, 100 μm.

Comment in

  • Building bridges to regenerate axons.
    Williams PR, He Z. Williams PR, et al. Science. 2016 Nov 4;354(6312):544-545. doi: 10.1126/science.aal2112. Science. 2016. PMID: 27811250 No abstract available.

References

    1. Becker T, Wullimann MF, Becker CG, Bernhardt RR, Schachner M. Axonal regrowth after spinal cord transection in adult zebrafish. J Comp Neurol. 1997;377:577–595. - PubMed
    1. Hui SP, Dutta A, Ghosh S. Cellular response after crush injury in adult zebrafish spinal cord. Dev Dyn. 2010;239:2962–2979. - PubMed
    1. Goldshmit Y, et al. Fgf-dependent glial cell bridges facilitate spinal cord regeneration in zebrafish. J Neurosci. 2012;32:7477–7492. - PMC - PubMed
    1. Reimer MM, et al. Motor neuron regeneration in adult zebrafish. J Neurosci. 2008;28:8510–8516. - PMC - PubMed
    1. Lin CY, Lee YS, Lin VW, Silver J. Fibronectin inhibits chronic pain development after spinal cord injury. J Neurotrauma. 2012;29:589–599. - PMC - PubMed

Publication types

Substances