. 2016 Nov 4:6:36123.
doi: 10.1038/srep36123.

Genomic Variants Associated with Resistance to High Fat Diet Induced Obesity in a Primate Model

Affiliations

Genomic Variants Associated with Resistance to High Fat Diet Induced Obesity in a Primate Model

R Alan Harris et al. Sci Rep. .

Abstract

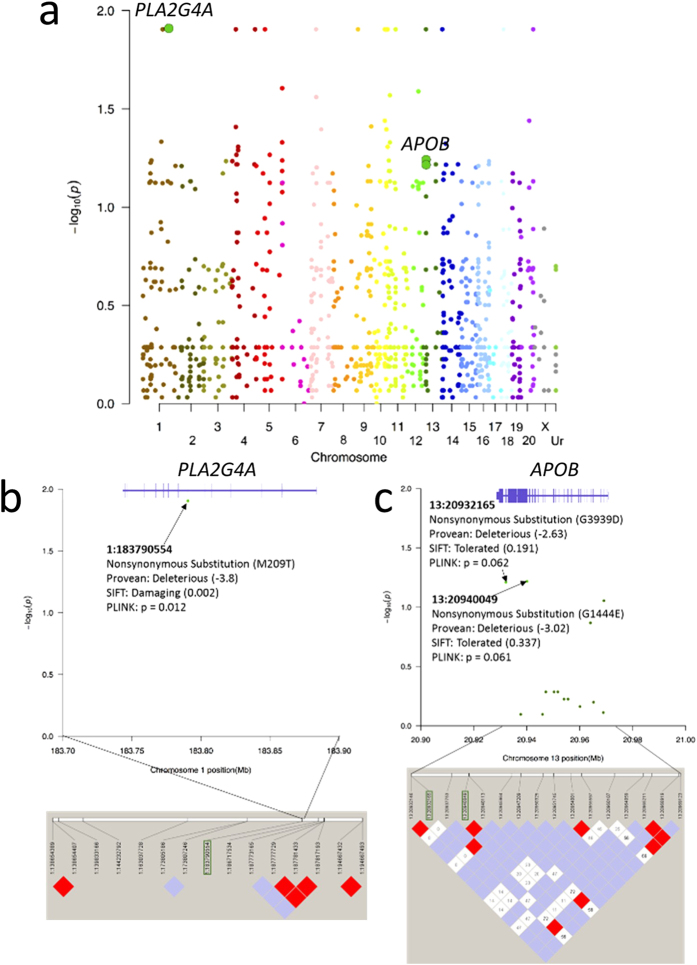
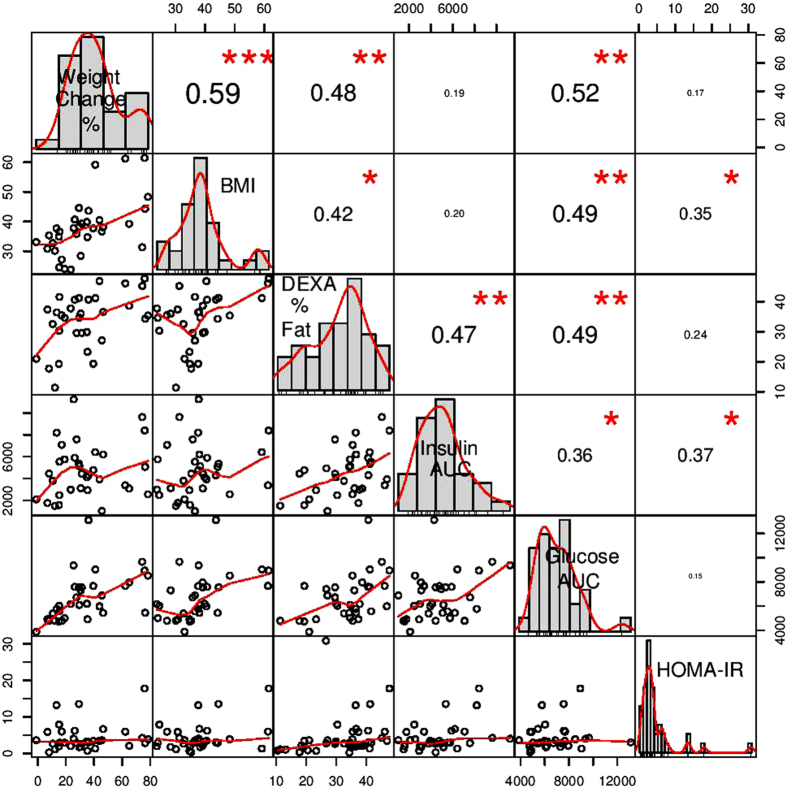
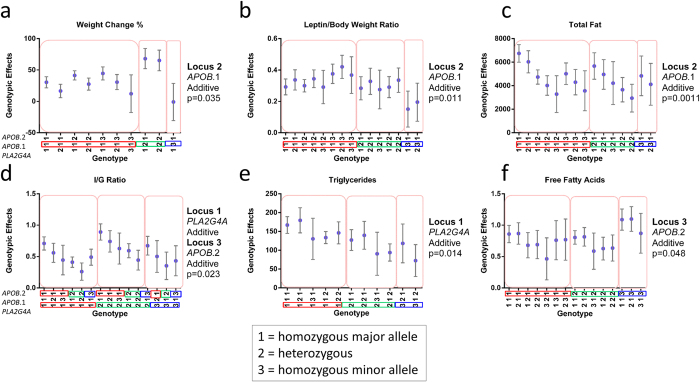
Maternal obesity contributes to an increased risk of lifelong morbidity and mortality for both the mother and her offspring. In order to better understand the molecular mechanisms underlying these risks, we previously established and extensively characterized a primate model in Macaca fuscata (Japanese macaque). In prior studies we have demonstrated that a high fat, caloric dense maternal diet structures the offspring's epigenome, metabolome, and intestinal microbiome. During the course of this work we have consistently observed that a 36% fat diet leads to obesity in the majority, but not all, of exposed dams. In the current study, we sought to identify the genomic loci rendering resistance to obesity despite chronic consumption of a high fat diet in macaque dams. Through extensive phenotyping together with exon capture array and targeted resequencing, we identified three novel single nucleotide polymorphisms (SNPs), two in apolipoprotein B (APOB) and one in phospholipase A2 (PLA2G4A) that significantly associated with persistent weight stability and insulin sensitivity in lean macaques. By application of explicit orthogonal modeling (NOIA), we estimated the polygenic and interactive nature of these loci against multiple metabolic traits and their measures (i.e., serum LDL levels) which collectively render an obesity resistant phenotype in our adult female dams.


Figures

Figure 1
Figure 1
Manhattan plot (a) of exon sequencing identified SNPs compared between high fat diet sensitive and resistant Japanese macaques based on PLINK (initial ssahaSNP odds ratio approximating infinity, PLINK p of 0.012 to <0.063). −log p values are plotted on the y-axis, while chromosome location is plotted on the x-axis. Manhattan plots and linkage disequilibrium plots of SNPs in PLA2G4A (b) and APOB (c) identified as being putatively associated with lean versus obese response to chronic high fat diet in Japanese macaque dams.
Figure 2
Figure 2. Scatterplot matrix of correlations among measured phenotypes for high fat diet exposed Japanese macaques.
Only phenotypes that show significant genotype-phenotype associations based on NOIA are shown. The diagonal is labelled with the phenotypes and shows the distribution of the values for that phenotype. Scatterplots comparing two phenotypes together with red trend lines are shown below the diagonal. Pearson correlations for comparisons between two phenotypes are shown above the diagonal with significance denoted by (*p < 0.05), (**p < 0.01) and (***p < 0.001).
Figure 3
Figure 3. Selected genotype-phenotype NOIA three loci models based on genotypes from the extended panel of high fat diet exposed Japanese macaques.
The Genotype (x-axis) shows the genotypes for each of the loci (ordered as PLA2G4A, APOB.1, and APOB.2) and the genotypes predicted to associate with the phenotype are outlined with colored boxes. The Genotypic Effects (y-axis) shows the NOIA predicted effect of the genotype on a phenotype. The APOB.1 locus demonstrated an additive effect on weight change percent (a), leptin/body weight ratio (b), and total fat based on DXA (c). (d) The PLA2G4A and APOB.2 loci show a combined additive effect on insulin/glucose ratio. (e) The PLA2G4A locus shows an additive effect on triglyceride levels. (f) The APOB.2 locus shows an additive effect on free fatty acid levels.

References

    1. Finucane M. M. et al. National, regional, and global trends in body-mass index since 1980: systematic analysis of health examination surveys and epidemiological studies with 960 country-years and 9·1 million participants. Lancet 377, 557–567 (2011). - PMC - PubMed
    1. Locke A. E. et al. Genetic studies of body mass index yield new insights for obesity biology. Nature 518, 197–206 (2015). - PMC - PubMed
    1. Shungin D. et al. New genetic loci link adipose and insulin biology to body fat distribution. Nature 518, 187–196 (2015). - PMC - PubMed
    1. Frayling T. M. et al. A common variant in the FTO gene is associated with body mass index and predisposes to childhood and adult obesity. Science 316, 889–894 (2007). - PMC - PubMed
    1. Loos R. J. F. et al. Common variants near MC4R are associated with fat mass, weight and risk of obesity. Nat. Genet. 40, 768–775 (2008). - PMC - PubMed

Publication types

Substances