. 2016 Nov 4:6:36182.
doi: 10.1038/srep36182.

Long-term exposure to Myozyme results in a decrease of anti-drug antibodies in late-onset Pompe disease patients

Collaborators, Affiliations

Long-term exposure to Myozyme results in a decrease of anti-drug antibodies in late-onset Pompe disease patients

Elisa Masat et al. Sci Rep. .

Abstract

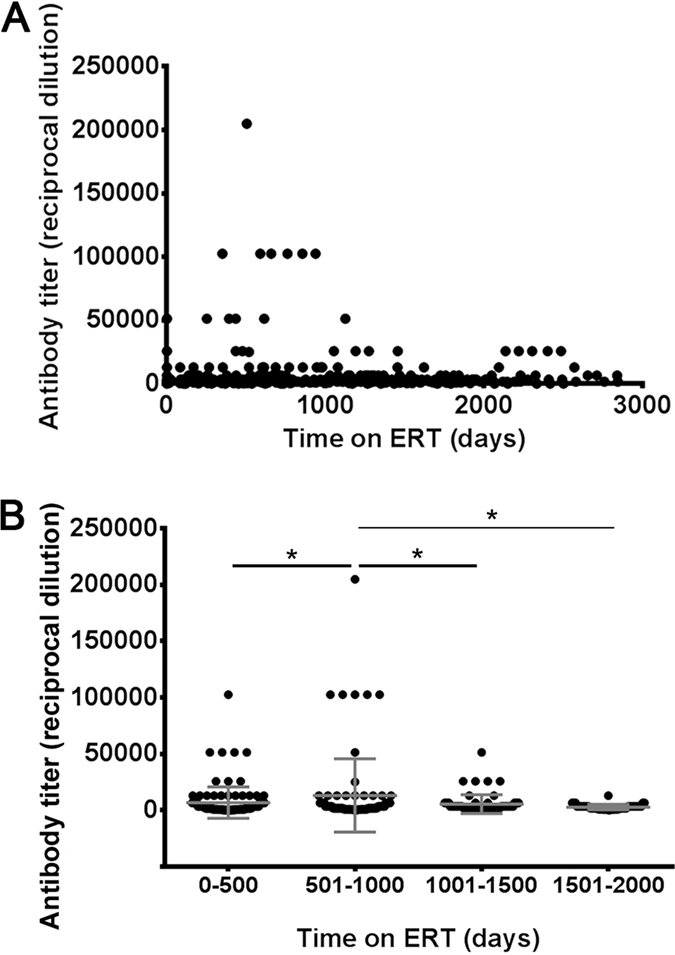
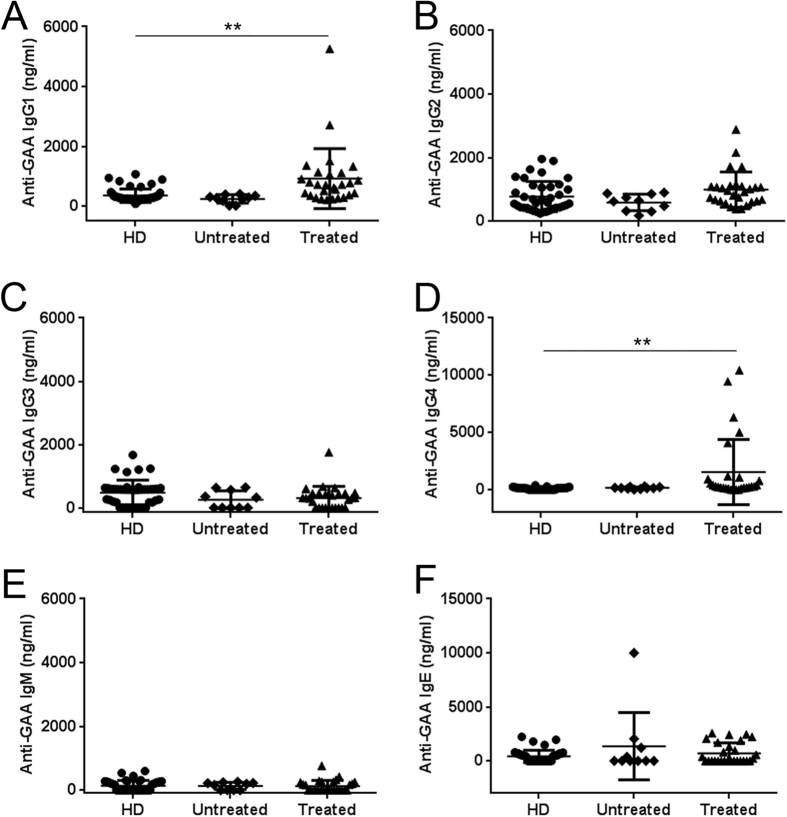
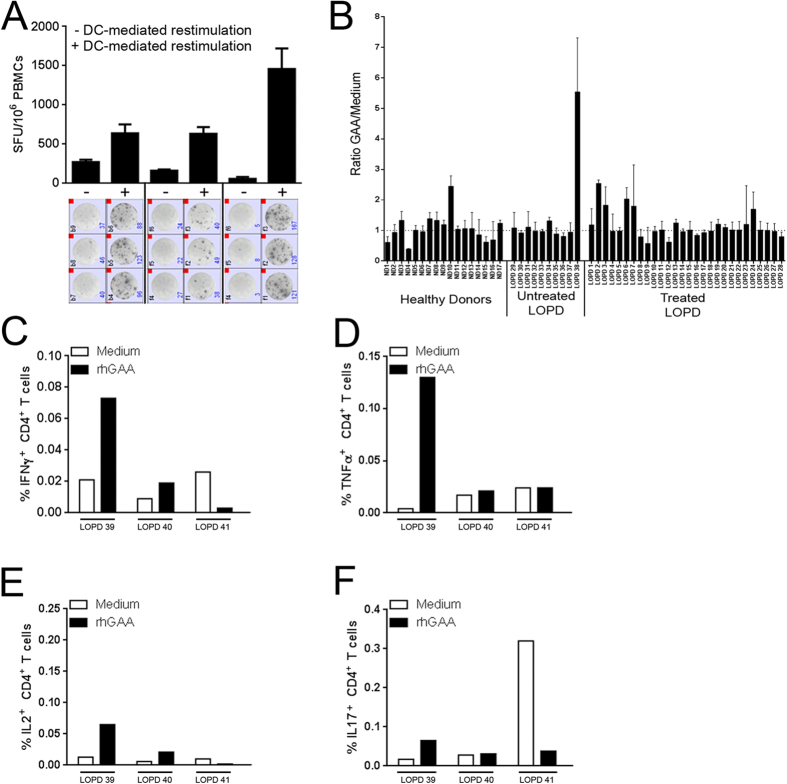
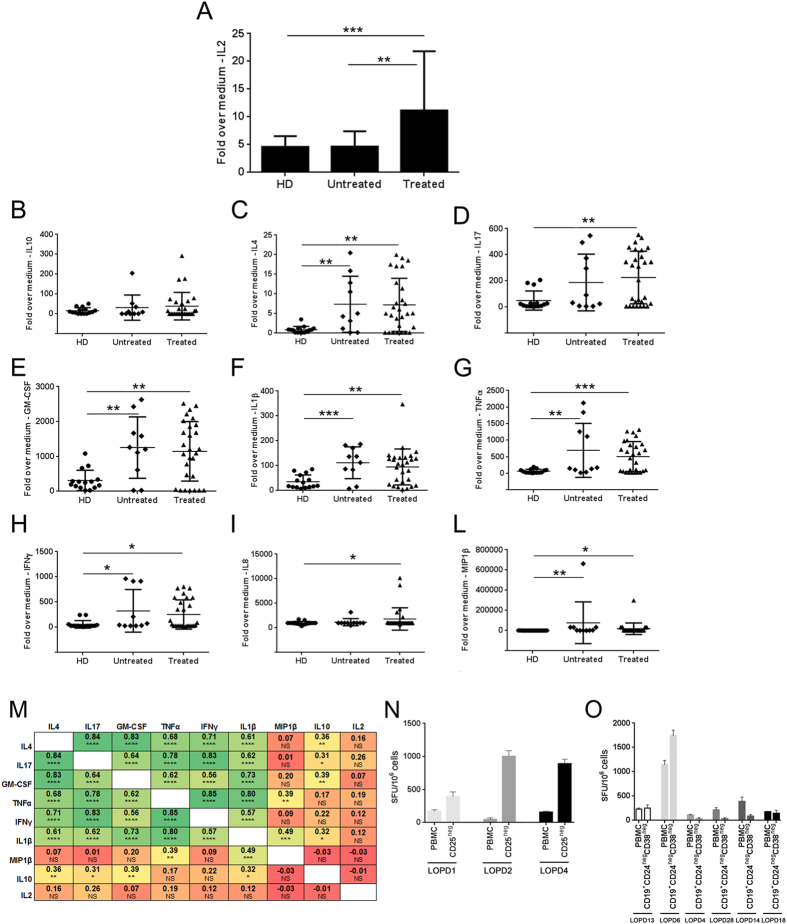
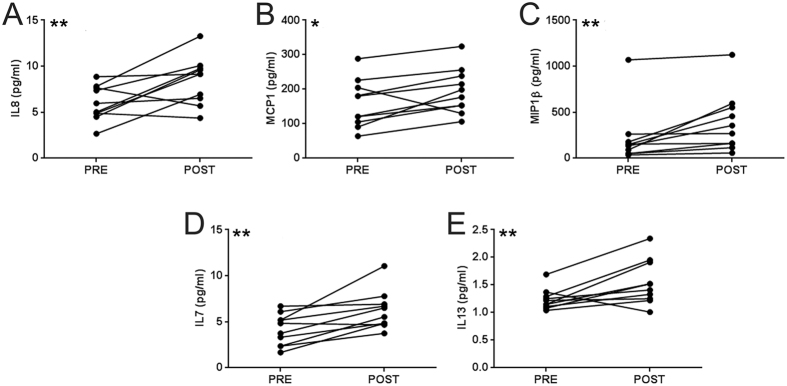
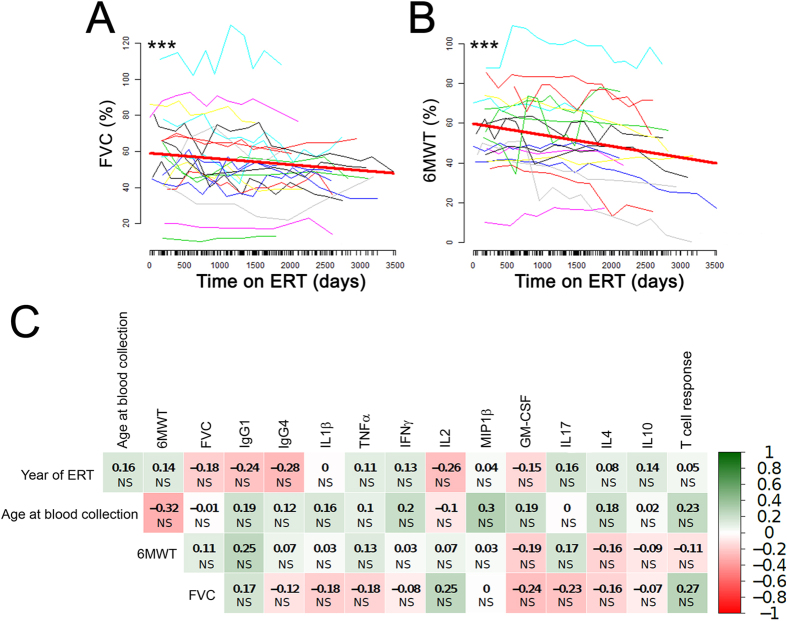
Immunogenicity of recombinant human acid-alpha glucosidase (rhGAA) in enzyme replacement therapy (ERT) is a safety and efficacy concern in the management of late-onset Pompe disease (LOPD). However, long-term effects of ERT on humoral and cellular responses to rhGAA are still poorly understood. To better understand the impact of immunogenicity of rhGAA on the efficacy of ERT, clinical data and blood samples from LOPD patients undergoing ERT for >4 years (n = 28) or untreated (n = 10) were collected and analyzed. In treated LOPD patients, anti-rhGAA antibodies peaked within the first 1000 days of ERT, while long-term exposure to rhGAA resulted in clearance of antibodies with residual production of non-neutralizing IgG. Analysis of T cell responses to rhGAA showed detectable T cell reactivity only after in vitro restimulation. Upregulation of several cytokines and chemokines was detectable in both treated and untreated LOPD subjects, while IL2 secretion was detectable only in subjects who received ERT. These results indicate that long-term ERT in LOPD patients results in a decrease in antibody titers and residual production of non-inhibitory IgGs. Immune responses to GAA following long-term ERT do not seem to affect efficacy of ERT and are consistent with an immunomodulatory effect possibly mediated by regulatory T cells.


Conflict of interest statement

Pascal Laforet has received grants and honoraria from Genzyme Company, and honoraria from BioMarin and Amicus Therapeutics and all the other authors declare no competing financial interests.

Figures

Figure 1
Figure 1. Long-term ERT in LOPD patients results in a decrease of anti-rhGAA antibodies.
(A) Measurement of anti-rhGAA antibody titers over time (n = 24 subjects). (B) Comparison of antibody titers measured in the first 500 days of ERT (n = 108 measurements) with titers measured between 500 and 1,000 days of ERT (n = 82 measurements), 1,000 and 1,500 days of ERT (n = 64 measurements), and 1,500 and 2,000 days of ERT (n = 46 measurements). For each time period, the same number of measurements for each subject was included in the analysis. ANOVA analysis was used to compare the measurements over time (*P < 0.05). Antibody titers are expressed as reciprocal dilution as previously described.
Figure 2
Figure 2. Anti-rhGAA IgG1 and IgG4 are the most prevalent subclasses of antibodies developed in response to long-term ERT.
(AF) Anti-rhGAA antibodies measured with a capture assay specific for IgG1, IgG2, IgG3, IgG4, IgM, and IgE antibodies. Estimated antibody concentrations are reported for each subject. Average and standard deviation are indicated for each of the study cohorts: LOPD subjects receiving ERT (Treated, n = 28), untreated LOPD subjects (Untreated, n = 10), and healthy donors (HD, n = 43). Unpaired two-tailed t-test was used to compare results across the study cohorts (**P < 0.01).
Figure 3
Figure 3. T cell reactivity to rhGAA is detectable after restimulation of PBMCs with the antigen.
(A) Comparison of IFNγ ELISpot count in PBMCs isolated from LOPD subjects receiving ERT before and after DC-mediated restimulation. Cells were either directly plated in the ELISpot assay (−) or restimulated in vitro with 10 μg/ml of rhGAA prior to the assay (+). Results are expressed in spot forming units (SFU) per 106 cells. Results are reported as average of triplicate testing +/− standard deviation. Images of the test wells in the IFNγ ELISpot assay are shown below the histogram plot. (B) Combined results for all subjects screened with the IFNγ ELISpot assay after PBMC restimulation. PBMCs from LOPD subjects receiving ERT (Treated, n = 28), untreated LOPD subjects (Untreated, n = 10), and HD (n = 15) were tested in the assay. Results are expressed as ratio between SFU/106 cells in rhGAA-restimulated cells vs. medium control. (CF) PBMCs from LOPD subjects receiving ERT (n = 3) were restimulated with 10 μg/ml of rhGAA for 48h and then stained intracellularly for IFNγ, TNFα, IL2, and IL17. Results are reported as percentage of CD4+ T cells secreting a given cytokine.
Figure 4
Figure 4. Cytokine profiling of supernatant from PBMCs restimulated with rhGAA.
Supernatants from cells restimulated with rhGAA were collected after 48 hours of restimulation in vitro and assayed for cytokine and chemokine production. (A) Levels of IL2 measured in conditioned media in LOPD subjects receiving ERT (Treated, n = 28), untreated LOPD subjects (Untreated, n = 10), and healthy donors (HD, n = 17). Error bars represent the standard deviation of the mean. Mann-Whitney test was used to compare data across the study groups. (BL) Cytokine and chemokine concentration in media measured with the Luminex array technology; shown are individual values measured in LOPD subjects receiving ERT (Treated, n = 28), untreated LOPD subjects (Untreated, n = 10), and healthy donors (HD, n = 17). Error bars represent the average of a cohort +/− standard deviation. Mann-Whitney test was used to compare data across the study groups. (M) Pearson correlation matrix comparing measurements of cytokine and chemokine production in responses to rhGAA in treated (n = 28) and untreated (n = 10) LOPD subjects, and HD (n = 15). Numbers in the table represent the correlation coefficient between two variables with the relative p value (t-test). (N) Depletion of CD25+ in PBMCs from treated LOPD subjects. The untouched CD25neg PBMC fraction was co-cultured with autologous DCs pulsed with rhGAA antigen or unpulsed DCs as negative control, followed by IFNγ ELISpot. Results of the IFNγ ELISpot assay are shown as average of spot forming units (SFU) per 106 cells plated in the assay +/− standard deviation of triplicate testing. (O) Sorted untouched CD19+CD24negCD38neg PBMC fraction from treated LOPD subjects co-cultured with autologous DCs pulsed with rhGAA antigen (or negative control) followed by IFNγ ELISpot. Results of are shown as average SFU/106 cells +/− standard deviation of triplicate testing (*P < 0.05; **P < 0.01; ***P < 0.001; ****P < 0.0001, NS, not significant).
Figure 5
Figure 5. Serum cytokine and chemokine profiling of LOPD subjects before and after ERT.
(AE) Luminex cytokine and chemokine measurements before (PRE) and immediately after (POST) rhGAA administration (over the course of four hours) in LOPD subjects (n = 10). Shown are cytokines for which a significant change in serum levels was measured at the end of ERT. Paired t-test was used to compare data analysis PRE vs. POST infusion (*P < 0.05; **P < 0.01).
Figure 6
Figure 6. Clinical outcome measures and statistical analysis of results.
(A) % forced vital capacity (FVC) measurements, expressed as % predicted in healthy individuals, over a period of 4 years in 21 treated LOPD subjects; the red line represents the average evolution of the measurement. The estimated slope is −1.16% per year; the estimated intercept is 58.9%; p value is given by linear mixed models (see Methods). The following equations were used to calculate the % FVC: [FVC predicted for males = 0.060 * height − 0,0214 * age – 4.65]; [FVC predicted for females = 0.0491 * height − 0.0216 * age – 3.59]; [FVC (%) = FVC observed/FVC predicted * 100] (B) Six-minute walk test (6MWT), expressed as % predicted in healthy individuals, measured over a period of 4 years in 19 subjects, the red line represents the average evolution of the measurement. The estimated slope is −2.06% per year; the estimated intercept is 59.6%; p value is given by linear mixed models (see Methods) (***P < 0.001). The following equations were used to calculate the % 6MWT: [6MWT predicted for males = −309–5.02 * age − 1.76 * weight + 7.57 * height]; [6MWT predicted for females = 667–5.78 * age − 2.29 * weight + 2.11 * height]; [6MWT (%) = 6MWT observed/6MWT predicted * 100]. (C) Spearman correlation of measurements of immune responses to rhGAA with clinical outcome measures recorded at the time of blood collection. The numbers in the table represent the correlation coefficient between two variables with the relative p value (t-test) (NS, not significant).

References

    1. van der Ploeg A. T. & Reuser A. J. Pompe’s disease. Lancet 372, 1342–1353, doi: 10.1016/S0140-6736(08)61555-X (2008). - DOI - PubMed
    1. Hirschhorn R. a. R. AJJ. In The Metabolic and Molecular Basis of Inherited Disease (ed Beaudet A. L., Scriver C. R., Sly W. S., Valle D.) 3389–3420 (McGraw-Hill, 2001).
    1. Kroos M., Hoogeveen-Westerveld M., van der Ploeg A. & Reuser A. J. The genotype-phenotype correlation in Pompe disease. Am J Med Genet C Semin Med Genet 160C, 59–68, doi: 10.1002/ajmg.c.31318 (2012). - DOI - PubMed
    1. Kishnani P. S. et al.. Cross-reactive immunologic material status affects treatment outcomes in Pompe disease infants. Mol Genet Metab 99, 26–33, doi: 10.1016/j.ymgme.2009.08.003 (2010). - DOI - PMC - PubMed
    1. Orlikowski D. et al.. Recombinant human acid alpha-glucosidase (rhGAA) in adult patients with severe respiratory failure due to Pompe disease. Neuromuscul Disord 21, 477–482, doi: 10.1016/j.nmd.2011.04.001 (2011). - DOI - PubMed

Publication types

MeSH terms