. 2016 Nov 4:6:36595.
doi: 10.1038/srep36595.

Predicting Subtype Selectivity for Adenosine Receptor Ligands with Three-Dimensional Biologically Relevant Spectrum (BRS-3D)

Affiliations

Predicting Subtype Selectivity for Adenosine Receptor Ligands with Three-Dimensional Biologically Relevant Spectrum (BRS-3D)

Song-Bing He et al. Sci Rep. .

Erratum in

Abstract

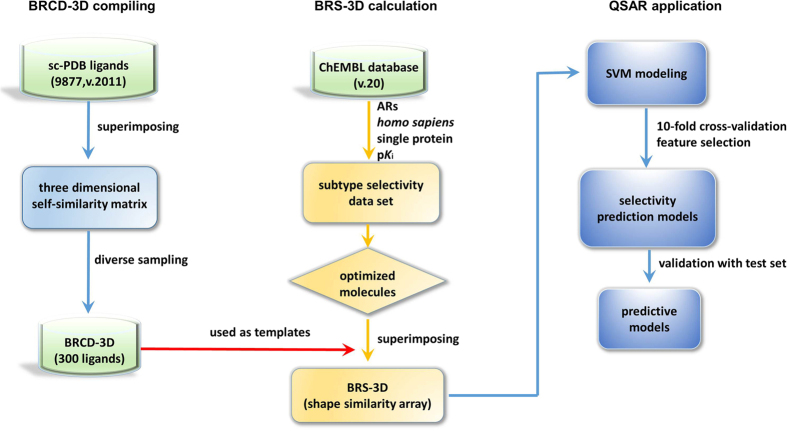
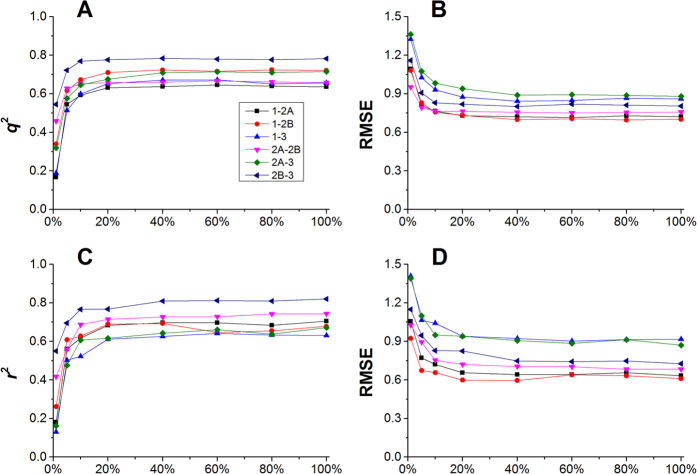
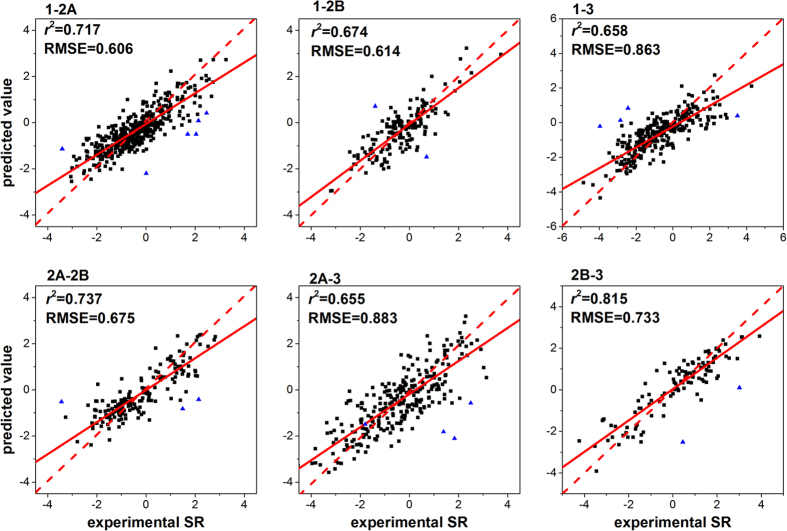
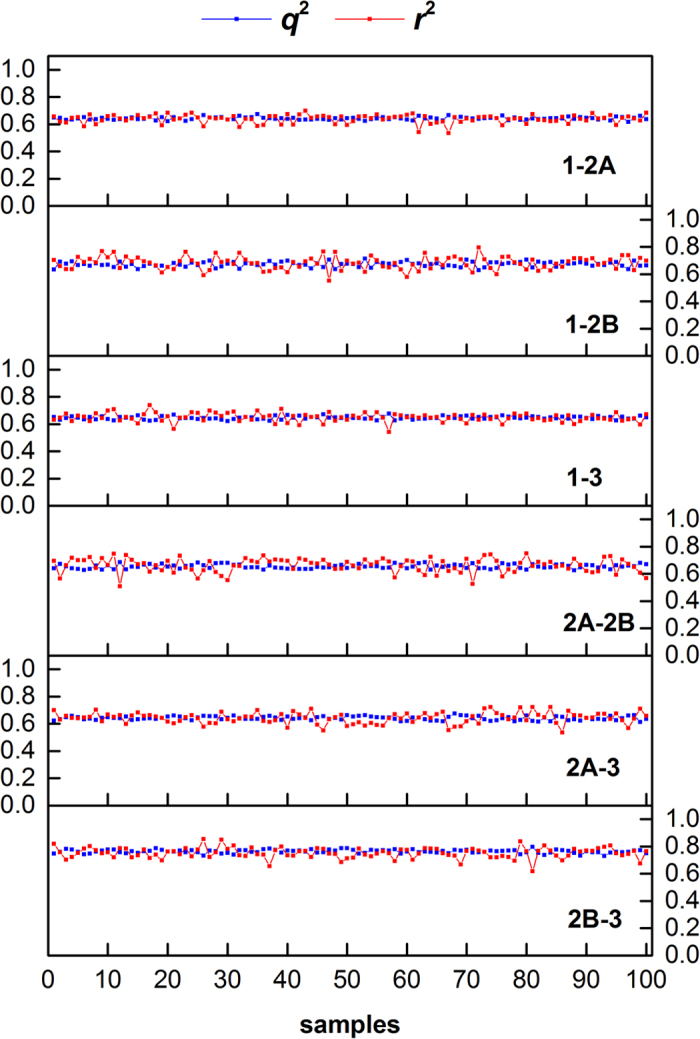
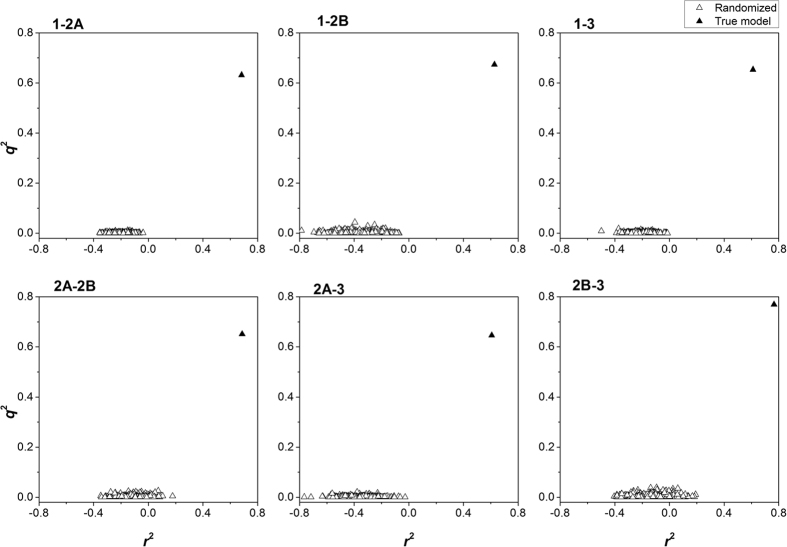
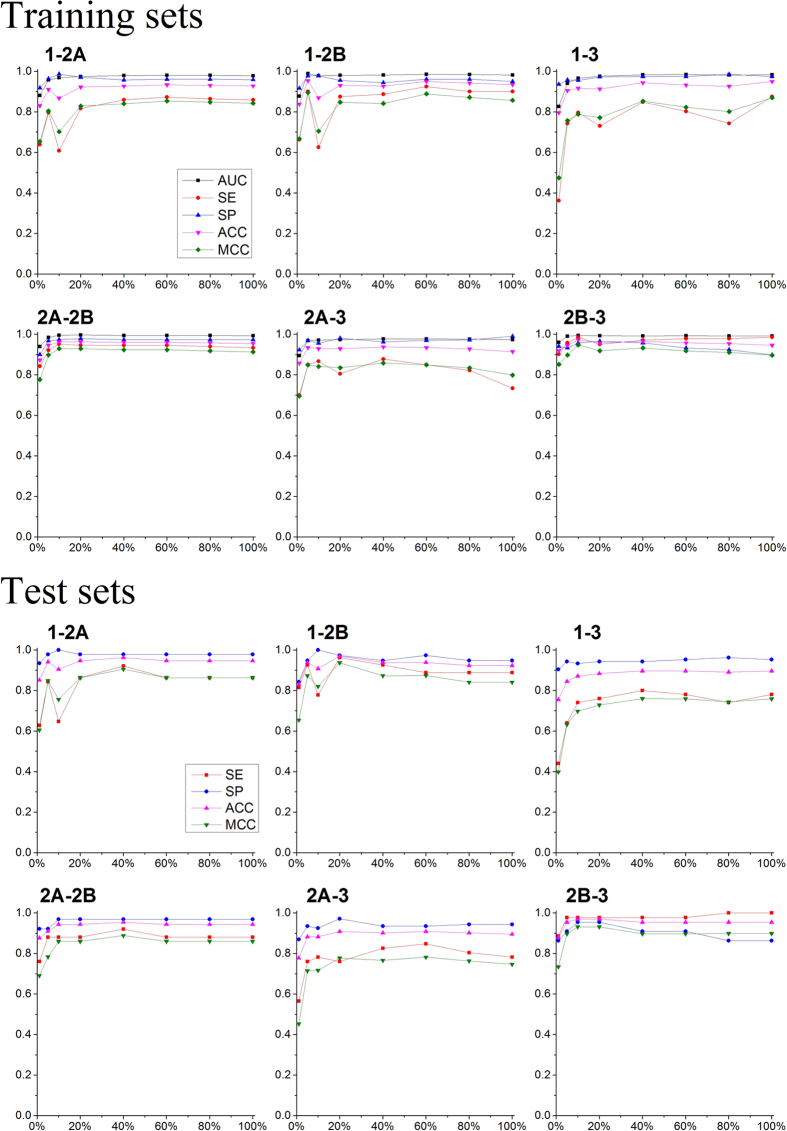
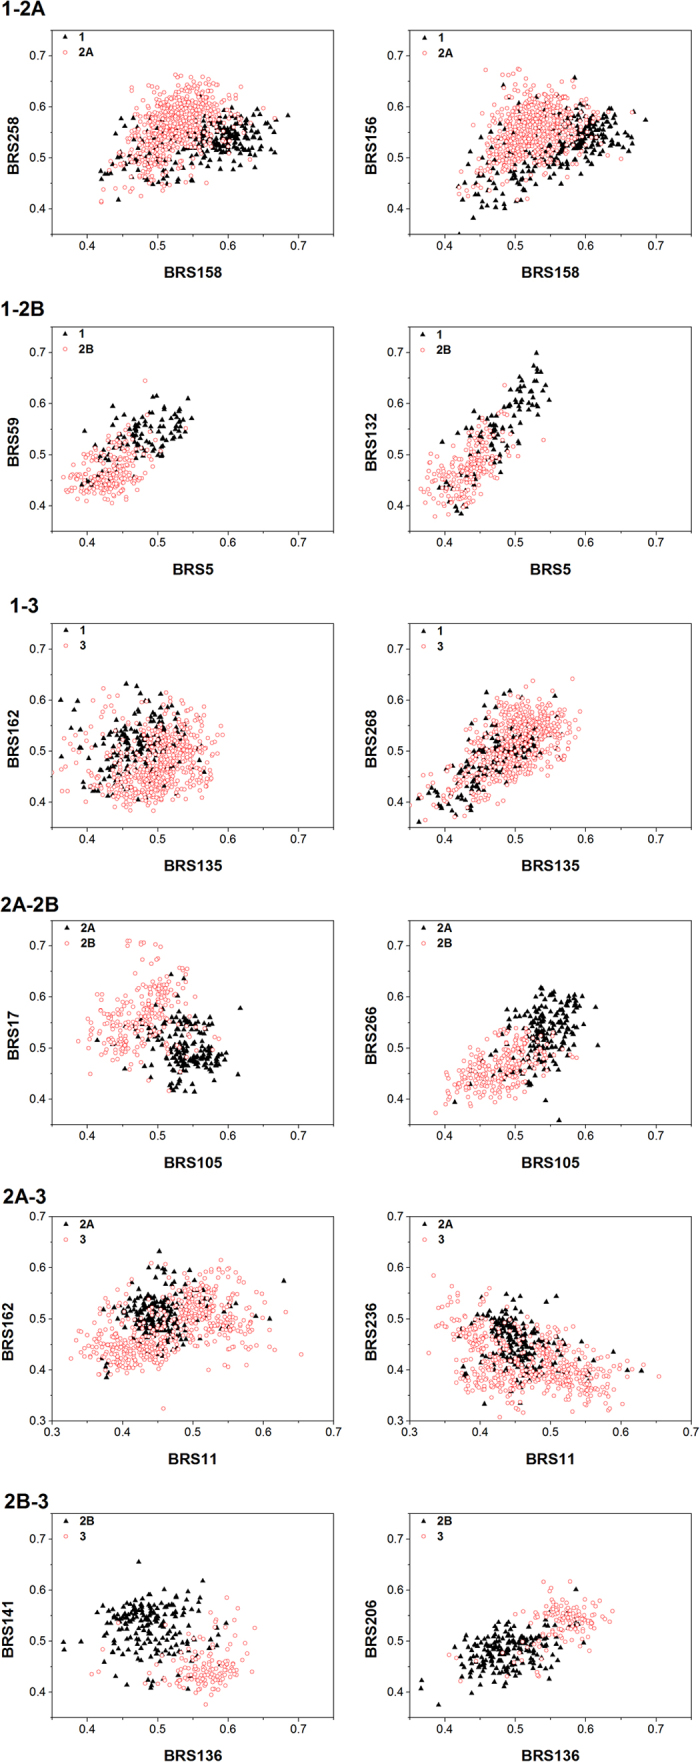
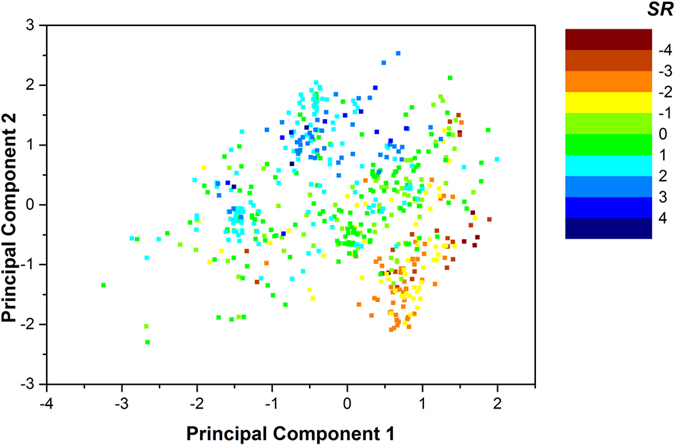
Adenosine receptors (ARs) are potential therapeutic targets for Parkinson's disease, diabetes, pain, stroke and cancers. Prediction of subtype selectivity is therefore important from both therapeutic and mechanistic perspectives. In this paper, we introduced a shape similarity profile as molecular descriptor, namely three-dimensional biologically relevant spectrum (BRS-3D), for AR selectivity prediction. Pairwise regression and discrimination models were built with the support vector machine methods. The average determination coefficient (r2) of the regression models was 0.664 (for test sets). The 2B-3 (A2B vs A3) model performed best with q2 = 0.769 for training sets (10-fold cross-validation), and r2 = 0.766, RMSE = 0.828 for test sets. The models' robustness and stability were validated with 100 times resampling and 500 times Y-randomization. We compared the performance of BRS-3D with 3D descriptors calculated by MOE. BRS-3D performed as good as, or better than, MOE 3D descriptors. The performances of the discrimination models were also encouraging, with average accuracy (ACC) 0.912 and MCC 0.792 (test set). The 2A-3 (A2A vs A3) selectivity discrimination model (ACC = 0.882 and MCC = 0.715 for test set) outperformed an earlier reported one (ACC = 0.784). These results demonstrated that, through multiple conformation encoding, BRS-3D can be used as an effective molecular descriptor for AR subtype selectivity prediction.


Figures

Figure 1
Figure 1. Venn diagram of the available ARs activity data from ChEMBL.
Compounds were filtered for homo species single proteins with pKi data. The compounds that coexisted in two subtypes were used in building the pairwise selectivity regression models. Among them, selective compounds (with |SR| > 1) were used for the pairwise discrimination models.
Figure 2
Figure 2. Flowchart of selectivity prediction workflow based on BRS-3D.
There are three steps for a BRS-3D modeling. (1) BRCD-3D compiling. Based on the self-similarity matrix between all the ligand pairs in sc-PDB, 300 ligands (BRCD-3D) were diversely selected with cluster analysis. The sc-PDB database was employed here as a representative collection of known bioactive conformations. (2) BRS-3D calculation. BRS-3D is a shape similarity profile calculated with molecular superimposition. The molecules under scrutiny were superimposed onto the 300 templates (BRCD-3D) and resulted into a 300 dimensional array. The shape similarity array was defined as BRS-3D. (3) QSAR application. Using BRS-3D as molecular descriptor, QSAR models can be developed with various statistical methods.
Figure 3
Figure 3. Feature selection results of the six pairwise regression models.
(A) q2 of the training sets. (B) RMSE of the training sets. (C) r2 of the test sets. (D) RMSE of the test sets. Eight different feature subsets were explored. The training sets were calculated based on 10-fold cross-validation. The test sets were used only for model evaluation.
Figure 4
Figure 4. Correlation plots of experimental and predicted selectivity ratios of the test sets.
The red dash straight line is the 45-degree benchmark line through the origin. The red solid straight line is fitting line of scatter diagram. Compounds outside the applicability domain were marked in blue.
Figure 5
Figure 5. The 100 resampling models for subtype selectivity regression.
The results showed that BRS-3D based models were stable.
Figure 6
Figure 6. Y-randomization test of the selectivity regression models.
The plot showed that the statistic results of true models (black triangles) were obviously better than the randomized models (hollow triangles).
Figure 7
Figure 7. Williams plot of standardized residuals versus leverages for compounds in the test sets.
The horizontal line shows the warning leverage (h* = 3p/n, n is the number of chemicals in training set and p is the number of variables plus one), the two vertical lines indicate the standardized residuals at 3 and -3 respectively. Most of compounds in the test sets fell within the AD of the models.
Figure 8
Figure 8. Feature selection of the six pairwise discrimination models.
The parameters were calculated based on 10-fold cross-validation of the training set (top) or test set (bottom). The five symbols represent the area under the ROC (AUC), sensitivity (SE), specificity (SP), overall prediction accuracy (ACC) and Matthews correlation coefficient (MCC), respectively. Eight different feature subsets were explored. The test sets were used only for model evaluation.
Figure 9
Figure 9. Distribution of the selective compounds in the shape similarity chemical spaces.
The coordinates were defined as the most important BRS-3D features.
Figure 10
Figure 10. Distribution of the 2B-3 compounds in the space of the first two principal components.
The compounds (dots) were colored according to their 2B-3 selective ratio (SR). The PCA analysis was carried out based on the 30 most important BRS-3D features in 2B-3 selectivity regression modeling.

References

    1. Moro S., Gao Z. G., Jacobson K. A. & Spalluto G. Progress in the pursuit of therapeutic adenosine receptor antagonists. Med. Res. Rev. 26, 131–159 (2006). - PMC - PubMed
    1. Fredholm B. B. et al.. Structure and function of adenosine receptors and their genes. N-S. Arch. Pharmacol . 362, 364–374 (2000). - PubMed
    1. Chen J. F., Eltzschig H. K. & Fredholm B. B. Adenosine receptors as drug targets —what are the challenges? Nat. Rev. Drug Discov. 12, 265–286 (2013). - PMC - PubMed
    1. Vollert C., Forkuo G. S., Bond R. A. & Eriksen J. L. Chronic treatment with DCPCX, an adenosine A(1) antagonist, worsens long-term memory. Neurosci. Lett. 548, 296–300 (2013). - PMC - PubMed
    1. Voors A. A. et al.. Effects of the adenosine A1 receptor antagonist rolofylline on renal function in patients with acute heart failure and renal dysfunction: results from PROTECT J. Am. Coll. Cardiol. 57, 1899–1907 (2011). - PubMed

Publication types