. 2016 Nov 4:6:36624.
doi: 10.1038/srep36624.

Diagnosis trajectories of prior multi-morbidity predict sepsis mortality

Affiliations

Diagnosis trajectories of prior multi-morbidity predict sepsis mortality

Mette K Beck et al. Sci Rep. .

Abstract

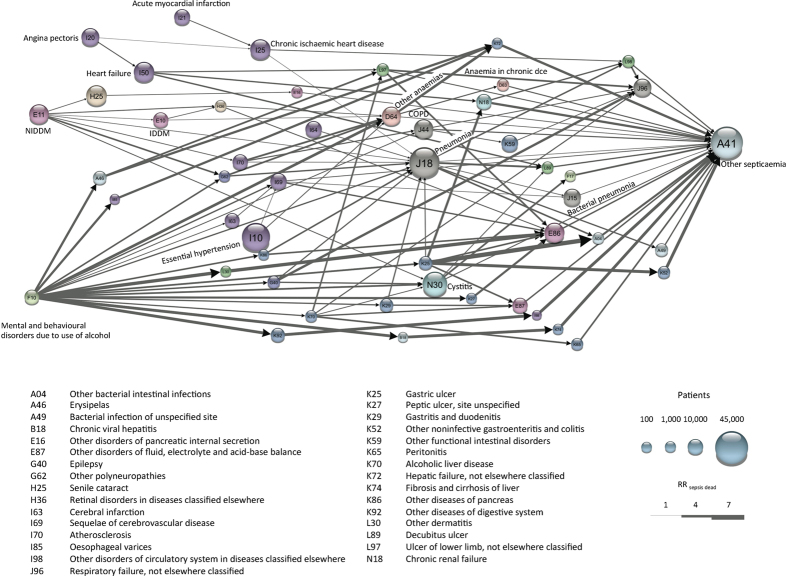
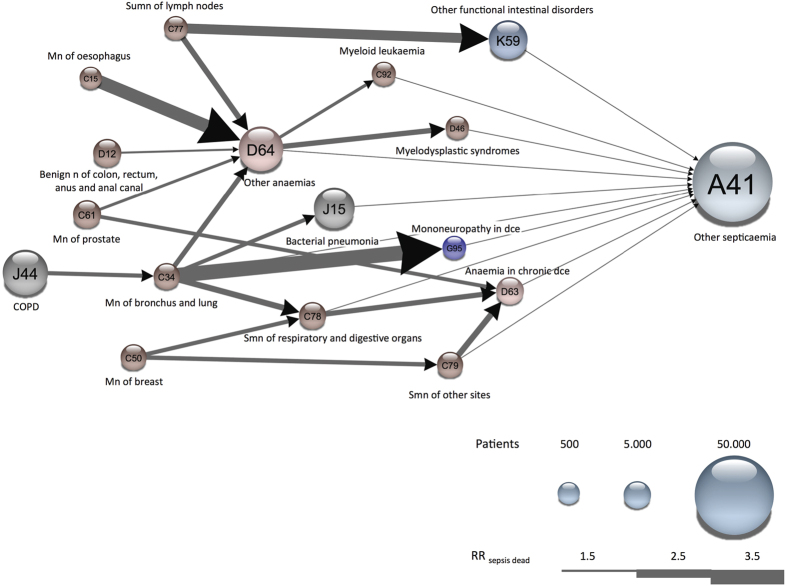
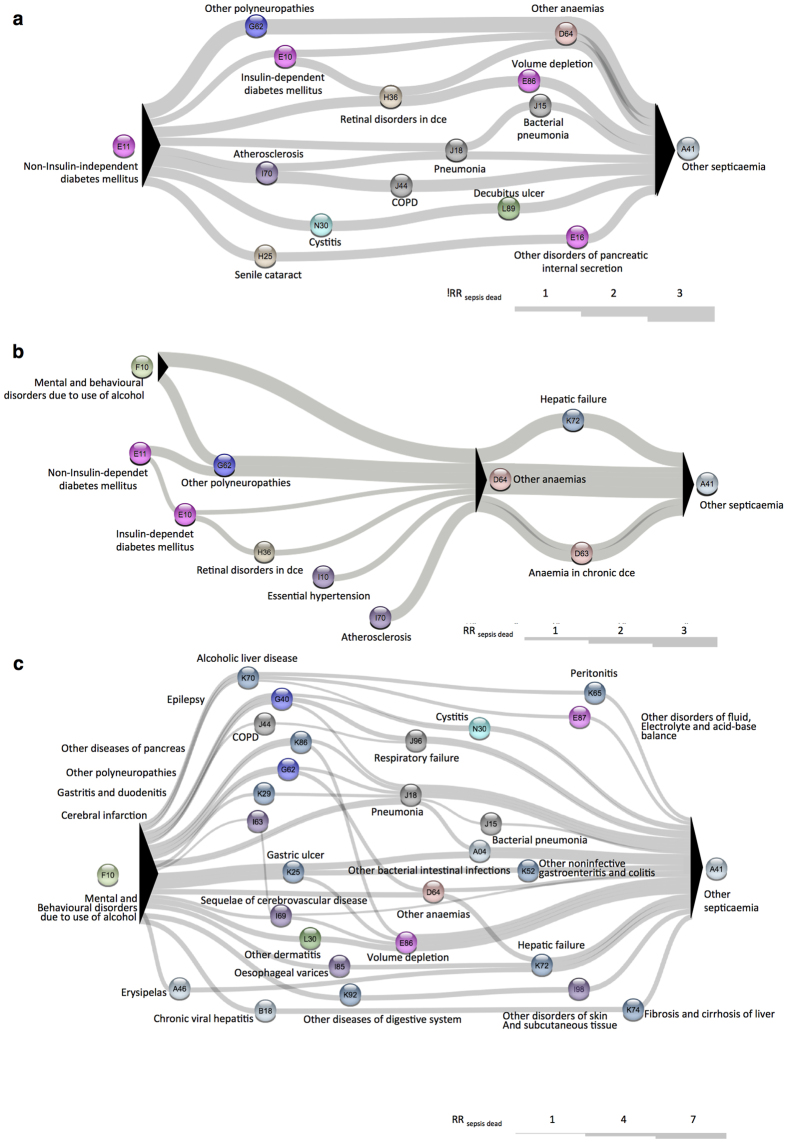
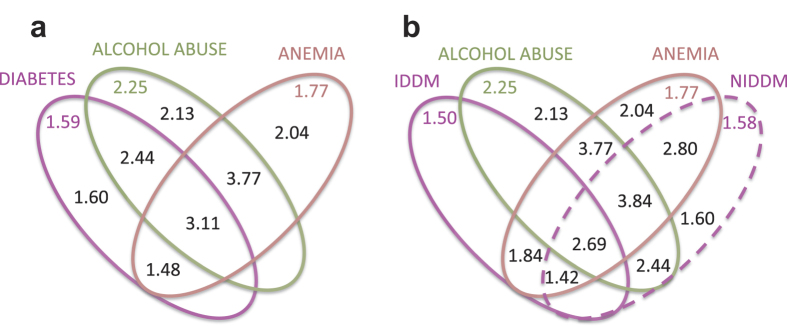
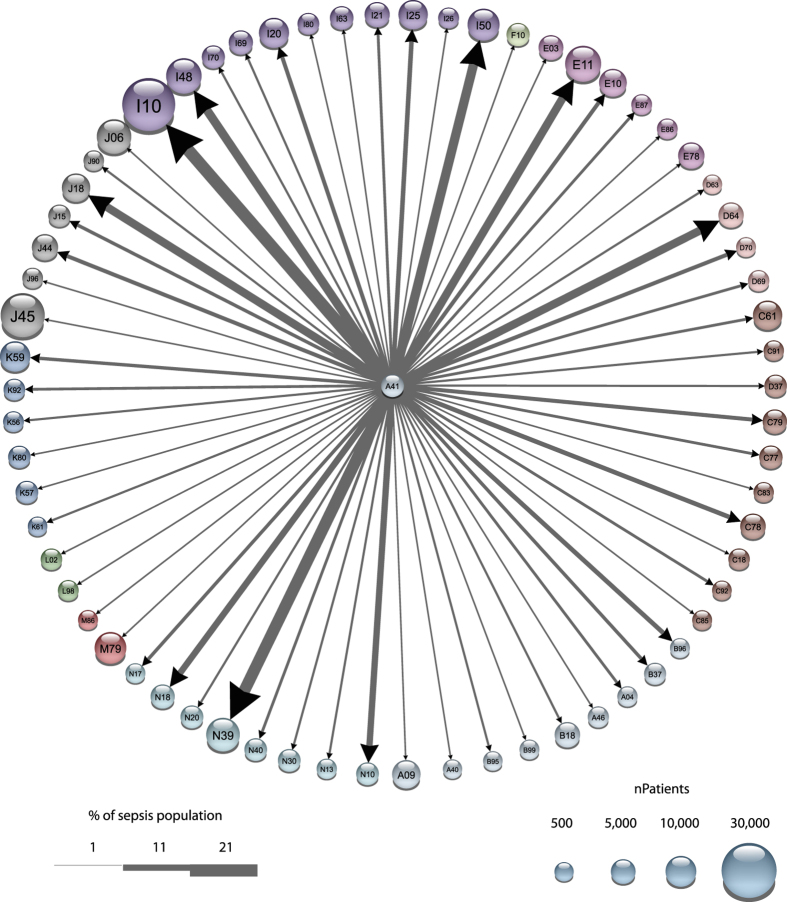
Sepsis affects millions of people every year, many of whom will die. In contrast to current survival prediction models for sepsis patients that primarily are based on data from within-admission clinical measurements (e.g. vital parameters and blood values), we aim for using the full disease history to predict sepsis mortality. We benefit from data in electronic medical records covering all hospital encounters in Denmark from 1996 to 2014. This data set included 6.6 million patients of whom almost 120,000 were diagnosed with the ICD-10 code: A41 'Other sepsis'. Interestingly, patients following recurrent trajectories of time-ordered co-morbidities had significantly increased sepsis mortality compared to those who did not follow a trajectory. We identified trajectories which significantly altered sepsis mortality, and found three major starting points in a combined temporal sepsis network: Alcohol abuse, Diabetes and Cardio-vascular diagnoses. Many cancers also increased sepsis mortality. Using the trajectory based stratification model we explain contradictory reports in relation to diabetes that recently have appeared in the literature. Finally, we compared the predictive power using 18.5 years of disease history to scoring based on within-admission clinical measurements emphasizing the value of long term data in novel patient scores that combine the two types of data.


Figures

Figure 1
Figure 1. Network of trajectories that significantly altered RRsepsis dead.
The network was constructed from 56 significant sepsis trajectories and illustrates simultaneously the number of patients receiving a particular diagnosis (node size) and the increased risk of dying from sepsis within 30 days from different trajectory steps connecting two diagnoses (width of arrow). The 42 nodes are colored based on their ICD-10 chapter relationships. Note that A41 has been scaled to 33% of its actual size representing 120,000 patients. The width of the arrows indicates the weighted average RRsepsis dead for a particular step (based on all trajectories containing that step).
Figure 2
Figure 2. Cancer-sepsis network from length three trajectories that significantly altered RRsepsis dead.
The network was created from sixteen length three sepsis-trajectories, which all contain a minimum of one disease from the ICD-10 block “Cancers (C00-C96)” from ICD-10 chapter 2: Neoplasms. The nodes are colored based on their ICD-10 chapter. Their size corresponds to the number of sepsis patients having the particular diagnosis. The width of the arrows indicates the RRsepsis dead for a particular step in a trajectory.
Figure 3
Figure 3. Sepsis sub-networks from trajectories that significantly altered RRsepsis dead.
The three networks were constructed from the 56 significant sepsis trajectories described in Fig. 1. A continuous line illustrates a group of patients following a specific multi-step trajectory. This includes all trajectories that contains either (a) Insulin-dependent or insulin-independent diabetes mellitus, or (b) Other Anaemias or Anaemia in chronic diseases classified elsewhere, or (c) Mental and behavioural disorders due to use of alcohol. The nodes are colored according to their ICD-10 chapter. The width of the arrows indicates the RRsepsis dead for a particular trajectory.
Figure 4
Figure 4. Venn diagrams of selected sepsis-trajectories that significantly altered RRsepsis dead.
The Venn diagrams show the significant RRsepsis dead values for groups of patients following trajectories containing diabetes mellitus (E10, E11), alcohol abuse (F10) and/or anemia (D64), respectively. The colored digits (inside and outside the three ellipsoids) indicate RRsepsis dead for following a trajectory that contains that particular diagnosis, independently of which of the other trajectories the patient follows. Ellipsoids without values are insignificant.
Figure 5
Figure 5. Sepsis comorbidities in the Swedish study.
This figure shows significant co-morbidities in the Swedish study, Dalianis et al.. Node size corresponds to the number of patients in the Swedish cohort with that code. The width of the arrow indicates the percentage of the sepsis subpopulation with a particular comorbidity. The lengths of the radiating arrows are arbitrary.

References

    1. Lui V. et al.. Hospital Deaths in Patients With Sepsis From 2 Independent Cohorts. J. Am. Med. Assoc. 312, 90–92 (2014). - PubMed
    1. Gofton T. E. & Young G. B. Sepsis-associated encephalopathy. Nat. Rev. Neurol. 8, 557–566 (2012). - PubMed
    1. Steckert A. V., Alves de Castro A., Quevedo J. & Dal-Pizzol F. Sepsis in the Central Nervous System and Antioxidant Strategies with N-Acetylcysteine, Vitamins, and Statins. Curr. Neurovasc. Res. 11, 83–90 (2014). - PubMed
    1. Osias J. & Manno E. Neuromuscular complications of critical illness. Crit. Care Clin. 30, 785–794 (2014). - PubMed
    1. Jensen A. B. et al.. Temporal disease trajectories condensed from population-wide registry data covering 6.2 million patients. Nat. Commun. 5, 4022 (2014). - PMC - PubMed

Publication types