. 2017 Mar;24(3):397-408.
doi: 10.1038/cdd.2016.125. Epub 2016 Nov 4.

Overexpression of Mcl-1 exacerbates lymphocyte accumulation and autoimmune kidney disease in lpr mice

Affiliations

Overexpression of Mcl-1 exacerbates lymphocyte accumulation and autoimmune kidney disease in lpr mice

Natasha S Anstee et al. Cell Death Differ. 2017 Mar.

Abstract

Cell death by apoptosis has a critical role during embryonic development and in maintaining tissue homeostasis. In mammals, there are two converging apoptosis pathways: the 'extrinsic' pathway, which is triggered by engagement of cell surface 'death receptors' such as Fas/APO-1; and the 'intrinsic' pathway, which is triggered by diverse cellular stresses, and is regulated by pro-survival and pro-apoptotic members of the Bcl-2 family of proteins. Pro-survival Mcl-1, which can block activation of the pro-apoptotic proteins, Bax and Bak, appears critical for the survival and maintenance of multiple haemopoietic cell types. To investigate the impact on haemopoiesis of simultaneously inhibiting both apoptosis pathways, we introduced the vavP-Mcl-1 transgene, which causes overexpression of Mcl-1 protein in all haemopoietic lineages, into Faslpr/lpr mice, which lack functional Fas and are prone to autoimmunity. The combined mutations had a modest impact on myelopoiesis, primarily an increase in the macrophage/monocyte population in Mcl-1tg/lpr mice compared with lpr or Mcl-1tg mice. The impact on lymphopoiesis was striking, with a marked elevation in all major lymphoid subsets, including the non-conventional double-negative (DN) T cells (TCRβ+CD4-CD8-B220+) characteristic of Faslpr/lpr mice. Of note, the onset of autoimmunity was markedly accelerated in Mcl-1tg/lpr mice compared with lpr mice, and this was preceded by an increase in immunoglobulin (Ig)-producing cells and circulating autoantibodies. This degree of impact was surprising, given the relatively mild phenotype conferred by the vavP-Mcl-1 transgene by itself: a two- to threefold elevation of peripheral B and T cells, no significant increase in the non-conventional DN T-cell population and no autoimmune disease. Comparison of the phenotype with that of other susceptible mice suggests that the development of autoimmune disease in Mcl-1tg/lpr mice may be influenced not only by Ig-producing cells but also other haemopoietic cell types.


Conflict of interest statement

The authors declare no conflict of interest.

Figures
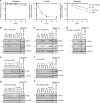
Figure 1
Figure 1
Mcl-1 transgene expression in lpr mice. (a) Lymphocytes from Mcl-1tg/lpr mice are resistant to apoptosis triggered through either the intrinsic or extrinsic pathways. Sorted CD4+CD8+ DP thymocytes from WT, Mcl-1tg, lpr and Mcl-1tg/lpr mice were cultured in vitro at 50 × 103 cells in 100 μl for 48 h in medium alone (left panel), medium containing 32 ng/ml Fc-FasL (centre panel) or 1 μg/ml etoposide (right panel). Viability was determined as the proportion of cells negative for PI uptake and annexin V surface staining, normalized to viability at 0 h. Viability following treatment with Fc-FasL and etoposide are given relative to untreated cells to show stimulus-specific apoptosis. Data represent average response of three independent mice per genotype±S.E.M. (b-h) Expression of endogenous and tg Mcl-1 protein in diverse haemopoietic cell types. Western blot analysis of lysates of (b) CD4+ T cells (CD4+CD8), (c) CD8+ T cells (CD4CD8+) and (d) unusual T cells (TCRβ+CD4CD8B220+) sorted from spleen; (e) Pre B cells (CD19+IgMIgD) sorted from bone marrow; (f) B cells (CD19+) sorted from spleen; (g) granulocytes (Mac1+Gr1+) and (h) macrophages (Mac1+Gr1) sorted from bone marrow. Genotypes and mouse identification numbers are indicated. Lysates prepared from whole spleen of lpr mouse #641 and Mcl-1tg/lpr mouse #637 were run on each gel to facilitate cross-comparison between different cell types. The solid line indicates electronic removal of two lanes. Each gel was probed with anti-Mcl-1 and anti-FLAG antibodies; because of the presence of the FLAG epitope tag, tg Mcl-1 protein is larger than endogenous Mcl-1. Representative blots of n=1–4 experimental replicates. Refer to Supplementary Figure S1 for quantification of blots; sorted myeloid cells and spleen cells appear to contain degraded Mcl-1 making interpretation of relative levels of endogenous and tg Mcl-1 ambiguous
Figure 2
Figure 2
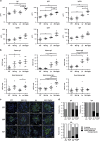
Enhanced splenomegaly and lymphadenopathy in Mcl-1tg/lpr mice. (a) Lymph nodes (from left to right, inguinal, axillary and brachial) and spleen dissected from 14-week WT, Mcl-1tg, lpr, and Mcl-1tg/lpr mice. (b) Total cellularity of lymph nodes (inguinal, axillary and brachial), spleen and peripheral blood of WT (white), Mcl-1tg (light grey), lpr (dark grey) and Mcl-1tg/lpr (black) mice aged 8, 14 and 21 weeks. An equal proportion of male and female mice were used and no difference was observed between genders. Data represent the average of 7–12 individual mice±S.E.M. *P<0.05, **P<0.01, ***P<0.001, calculated by Student's T-test with Welch's correction. Refer to Supplementary Tables S1-3 for complete data
Figure 3
Figure 3
Enhanced splenomegaly and lymphadenopathy in Mcl-1tg/lpr mice is primarily due to elevated lymphoid populations. (a) Enumeration of myeloid populations (Mac1+Gr1+ and Mac1+Gr1 cells) in the spleen and peripheral blood of mice aged 8, 14 and 21 weeks. Data represent the average of 5-12 individual mice±S.E.M. (b) Enumeration of conventional T cells (CD4+CD8 and CD4CD8+) and non-conventional DN T cells (TCRβ+CD4CD8B220+); and (c) B lymphoid populations (B220+IgMIgD, B220+IgM+IgDand B220+IgM+IgD+) in lymph nodes (inguinal, axillary and brachial lymph nodes) of mice aged 8, 14 and 21 weeks. Data represent average of 6–12 individual mice±S.E.M. *P<0.05, **P<0.01, ***P<0.001, calculated by Student's T-test with Welch's correction. An equal proportion of male and female mice were studied, with no gender differences being observed. Refer to Supplementary Tables S1-3 for complete data and Supplementary Figure S2 for gating strategies. Analysis of the B lymphoid compartment using CD19 as a marker rather than B220 revealed that the TCRβB220+IgMIgD population enumerated in (c) contained a number of non-conventional DN T cells with low TCRβ expression. Thus, although B lymphoid cell numbers were indeed elevated in Mcl-1tg/lpr mice compared with lpr mice, the actual increase was less than it had appeared using B220 as the marker: ~3-fold at 14 weeks rather than ~6-fold (see Supplementary Figure S3 and Supplementary Table S2)
Figure 4
Figure 4
Overexpression of Mcl-1 increases the severity and accelerates the onset of the lpr autoimmune disease phenotype. (a) Kaplan–Meier plot showing overall survival of lpr (grey, n=77) versus Mcl-1tg/lpr (black, n=89) mice. The lifespan of Mcl-1tg/lpr mice is significantly reduced compared with lpr mice (P<0.0001, calculated using Mantle–Cox test), median survival being 143 and 341 days, respectively. An equal number of male and female mice were aged for each genotype; no gender difference was observed. (b) Haemopoietic analysis of sick lpr (grey, n=28–30) and Mcl-1tg/lpr (black, n=25–32) mice, including weights of lymph node (inguinal, axillary and brachial) and spleen and enumeration of circulating white blood cells (WBC) and platelets. Data points represent individual mice with mean±S.E.M. indicated. **P<0.01, ***P<0.001, calculated by Student's T-test with Welch's correction. Significance for spleen weights is indicated with and without two outlier lpr mice (black circled points). (c and d) Renal pathology, assessed by (c) GN pathology scoring (score 0–4) and (d) haematuria (scored out of 4) in sick lpr (grey; n=26–41) and Mcl-1tg/lpr (black; n=34–43) mice. Data points represent individual mice with mean±S.E.M. indicated. (e) Kaplan–Meier plot of the incidence of severe GN (clinical score⩾2) in sick lpr (grey, n=26) versus sick Mcl-1tg/lpr (black, n=33) mice, P<0.0001 (Mantle–Cox test)
Figure 5
Figure 5
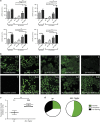
Serum Ig levels are elevated in Mcl-1tg/lpr mice. (a) ELISA quantification of Ig levels (IgA, IgG1, IgG2a, IgG2b, IgG3 and IgM) in sera of 14-week healthy WT (white, n=5), Mcl-1tg (light grey, n=4), lpr (dark grey, n=6) and Mcl-1tg/lpr (black, n=6) mice. Bars represent mean±S.E.M. (b) ELISPOT enumeration of the total number of antibody-secreting cells (ASCs) in the spleen and bone marrow (per femur) of healthy 14-week WT (white, n=7), Mcl-1tg (light grey, n=6), lpr (dark grey, n=6) and Mcl-1tg/lpr (black, n=5) mice. Data points represent individual mice with mean±S.E.M indicated. (c) Representative confocal images of snap frozen kidney sections stained with FITC-labelled antibody for the presence of IgG-, IgM- or IgA-deposition (green) in the glomeruli; nuclei are stained with DAPI (blue). One mouse of each genotype is shown. White arrows indicate Ig deposition on the glomerular capillary loops. Scale bar=25 μm. (d) Enumeration of staining patterns observed in snap frozen kidney sections analyzed for the presence of IgG-, IgM- or IgA- deposition (see also Supplementary Figure S6). Graphs indicate the proportions of WT (n=2), Mcl-1tg (n=2), lpr (n=8) and Mcl-1tg/lpr (n=4) kidneys showing no staining of glomeruli (white), staining of Ig deposition on mesangial cells only (grey), or staining of Ig deposition on both glomerular capillary tubules and mesangial cells (black). *P<0.05, **P<0.01, ***P<0.001, calculated by Student's T-test with Welch's correction
Figure 6
Figure 6
ANA levels are elevated in Mcl-1tg/lpr mice. (a) ELISA quantification of dsDNA- and ssDNA-specific IgG (top panels) and dsDNA- and ssDNA-specific IgM (bottom panels) (arbitrary units/ml) in sera of sick lpr (checkered dark grey, n=13) and Mcl-1tg/lpr (checkered black, n=13) mice and healthy 21-week WT (white, n=7), Mcl-1tg (light grey, n=9), lpr (dark grey, n=9) and Mcl-1tg/lpr (black, n=7) mice. (b) Representative confocal images of Hep-2 cells stained with sera from sick lpr mice or Mcl-1tg/lpr mice. Staining intensity scoring (0 to 3+) and type of staining (N=nuclear, P=peripheral) are indicated. Positive control=sera from aged Fasgld/gld mouse lacking functional FasL; negative control=sera from 8-week healthy WT mouse. (c) ANA fluorescence intensity of Hep-2 cells, measured in arbitrary units, from sera of sick lpr (grey, n=12) and Mcl-1tg/lpr (black, n=11) mice. Data represent mean±S.E.M. *P<0.05, **P<0.01, ***P<0.001 calculated by Student's T-test with Welch's correction. (d) Patterns of staining: homogenous nuclear staining (green); staining peripheral to the nucleus (white); or no detectable staining (black) for the mice analyzed in (c)

References

    1. Strasser A, Cory S, Adams JM. Deciphering the rules of programmed cell death to improve therapy of cancer and other diseases. EMBO J 2011; 30: 3667–3683. - PMC - PubMed
    1. Strasser A, Jost PJ, Nagata S. The many roles of FAS receptor signaling in the immune system. Immunity 2009; 30: 180–192. - PMC - PubMed
    1. Moldoveanu T, Follis AV, Kriwacki RW, Green DR. Many players in BCL-2 family affairs. Trends Biochem Sci 2014; 39: 101–111. - PMC - PubMed
    1. Lavrik IN, Krammer PH. Regulation of CD95/Fas signaling at the DISC. Cell Death Differ 2012; 19: 36–41. - PMC - PubMed
    1. Czabotar PE, Lessene G, Strasser A, Adams JM. Control of apoptosis by the BCL-2 protein family: implications for physiology and therapy. Nat Rev Mol Cell Biol 2014; 15: 49–63. - PubMed

Publication types

MeSH terms